Application of Imperialist Competitive Algorithm for
Optimal Location and Sizing of Static Compensator
Considering Voltage Profile
Vahid Rashtchi
*, Ashkan Pirooz
Department of Electrical Engineering, University of Zanjan, Iran
Copyright © 2015 Horizon Research Publishing All rights reserved.
Abstract
This paper applies the Imperialist Competitive Algorithm (ICA) to find the optimal place and size of Static Compensator (STATCOM) in power systems. The output of the algorithm is a two dimensional array which indicates the best bus number and STATCOM's optimal size that minimizes all bus voltage deviations from their nominal value. Simulations are performed on IEEE 5, 14, and 30 bus test systems. Also some comparisons have been done between ICA and the famous Particle Swarm Optimization (PSO) algorithm. Results show that this method can be considered as one of the most precise evolutionary methods for the determination of optimum compensator placement in electrical grids.Keywords
Evolutionary Computation, ImperialistCompetitive Algorithm, Power Systems Compensation, Static Compensators, Voltage Profile
1. Introduction
Restrictions like environment conditions and construction costs won't let human being expand the power grid everywhere he needs to overcome the disturbances [1]. One of these disturbances is decrease in voltage profile which causes voltage drop below the nominal value in each bus of the grid. With the emergence of power electronics utilities and invention of Flexible AC Transmission System (FACTS) devices, the majority of disturbances referring to the stability and decrease and increase in the voltage have been solved [2]. FACTS devices (such as STATCOM, SVC, and UPFC) are connected in shunt or series (or a combination of these two) to achieve different purposes. In case of voltage drop or increase in voltage profile, shunt devices such as SVC and STATCOM are used [3]. These devices can hold the voltage of the connected point on a desired value by injecting or absorbing reactive power. While designing or installing these devices, performances of two operation states are considered, viz. (i) steady state operation and (ii) transient
performance [4]. This study focuses on steady state operation of STATCOM in small and medium size power grids that need to be compensated in case of voltage profile. Voltage stability is also checked for each bus before and after the STATCOM placement to see if the grid remains stable or not, and how the STATCOM improves the stability of the entire system.
As designing, producing, and installing these devices are highly expensive, large number of these devices cannot be used in a grid and maximum performance must be gained from the minimum number and size of compensation devices. This leads us to an optimization problem.
In last decade, many approaches are applied to find the optimal place (bus number) and size of the FACTS devices in a power grid [2]. This study uses newly developed ICA method to achieve this goal [5].
The remaining part of this paper is organized as follows, the system under study and the problem are defined in section II, and in section III, a brief overview of the ICA method is provided. The optimization problem and the use of ICA method in locating and sizing of STATCOM is described in section IV and finally computer simulation results using MATLAB software are discussed in section V.
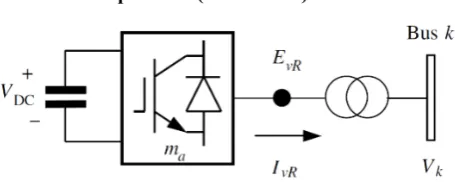
[image:1.595.317.545.585.676.2]1.1. Static Compensator (STATCOM)
heavy load time and if low voltage occurs, STATCOM injects reactive power to the connected bus, and if high voltage occurs at low load, it absorbs reactive power from the connected bus [3]. Fig. 1 shows how STATCOM is connected to the grid.
1.2. Gauss-Seidel Power Flow Solution
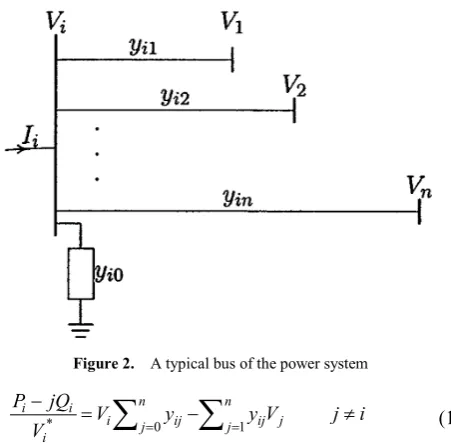
In this study, Gauss-Seidel Load-Flow solution is applied to calculate the voltages at each bus when it is needed. It is a simple solution and results are quite reliable for the needs of this study [3,6]. Application of KCL in the depicted bus as Fig. 2 results in (1).
Figure 2. A typical bus of the power system i j V y y V V jQ P n
j ij j
n
j ij
i i
i
i− =
∑
−∑
≠=
=0 1
* (1)
The power flow equation is presented in (1), where Pi
and Qi stand for the real and reactive powers at bus i. Vi
and Vj indicate the voltages of bus i and j respectively. yij
shows the actual admittance of the line connecting bus i to bus j in per unit.
From the above relation, the mathematical formulation of the power flow problem results in a system of nonlinear algebraic equations which must be solved by iterative techniques. In Gauss-Seidel method, the iterative sequence for the Vi becomes
i j Y V Y V jQ P V ii k j ij k i sch i sch i k i ≠ − − =
∑
+ ) ( ) *( ) 1( (2)
Where Pisch and Qisch are the net real and reactive
powers expressed in per unit. Yij =−yij and Yii=∑yij.
1.3. Voltage Stability Index
It is important to prevent voltage collapse during allocation of a compensator in power grids. A bus voltage stability index is proposed in [7] and it is used to see how far
a bus is away from voltage collapse. Following equations give an accurate estimate of voltage stability margin at a specified bus. 0 . 1 | | |) (| . 4 2 ≤ = i bus j
bus P diagV R
VPI (3)
0 . 1 | | |) (| . 4 2 ≤ = i bus j
bus Q diagV X
VQI (4)
VPIbus and VQIbus are stability margins for each bus
considering active and reactive power respectively. And the more they get close to unity, probability for voltage collapse happening for that specific bus goes higher. Pj and Qj are
receiving active and reactive powers for the understudy bus respectively. Vi is the bus voltage and Rbus and Xbus stand for total resistance and reactance of each specific bus.
2. System under Study
IEEE standard 5, 14, and 30 bus test systems are used in this study. The single line diagram for the 14 bus system is shown in Fig. 3. All system data are taken from [8]. The IEEE 14 Bus Test Case represents a portion of the American Electric Power System (in the Midwestern US) as of February, 1962. The 14 bus test case does not have line limits. According to [8]; compared to 1990's power systems, it has low base voltages and an overabundance of voltage control capability. All data is on 100 MVA base.
Where OF is the objective function of the problem and
ξ
is a positive coefficient usually less than 1, defining the effect of the colonies in calculating the empire's power. On each iteration, the weakest colony of the weakest empire, will be possessed by the strongest empire. This action makes the weak empires weaker, and strong ones stronger. The empire with only one colony which is its imperialist is eliminated and the only remaining colony will also be possessed by the strongest empire.
[image:2.595.377.553.120.185.2]The above stages are repeated until the stop condition is satisfied. In ICA, the stop condition is when only one empire is left and all others are eliminated and have been possessed by the only remaining empire. Imperialist of the only remaining empire will be presented as the best answer of the problem. All ICA stages are summarized in Fig. 5.
[image:2.595.67.293.236.460.2]4. Application of ICA and PSO in
STATCOM Location
Each particle in STATCOM location problem is a two dimensional vector [9], because there are two variables for the problem, Location and Size of the STATCOM to be installed. In ICA method, initial countries are modeled as countries and generated randomly.
] Size Loc [
Particlei = i i (7)
Both location and size have their own limitations. Location can take values from 1 to maximum bus number,
and size can take values in per unit depending on the size of the system or installation cost etc.
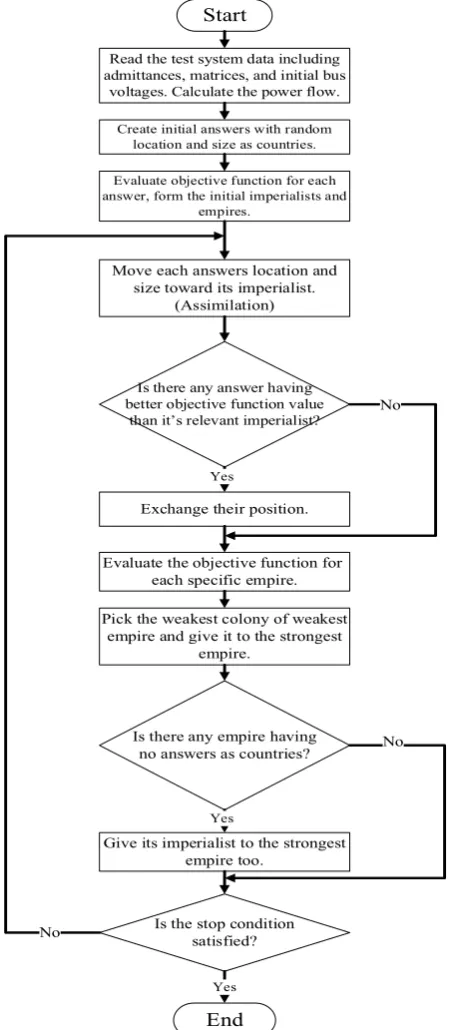
In each iteration, the specific particle is placed into the power grid, real and reactive net powers are updated corresponding to the specific particle. Power flow is done, and new value of bus voltages corresponding to the specific particle are extracted by the ICA. Then ICA calculates the objective function by the means of extracted voltage values. Final value of the function is the fitness or cost of that specific particle (country). Fig. 6 shows a flowchart of implementation of ICA in STATCOM location problem. Start
End
Read the test system data including admittances, matrices, and initial bus
voltages. Calculate the power flow.
Create initial answers with random location and size as countries.
Exchange their position.
Evaluate the objective function for each specific empire.
Pick the weakest colony of weakest empire and give it to the strongest
empire.
Give its imperialist to the strongest empire too.
Is there any answer having better objective function value
than it’s relevant imperialist?
Is the stop condition satisfied? Is there any empire having
no answers as countries? Move each answers location and
size toward its imperialist. (Assimilation)
Yes
Yes
Yes
No
No
No
Evaluate objective function for each answer, form the initial imperialists and
[image:3.595.192.418.222.738.2]empires.
4.1. Objective Function
The main objective of this study is to minimize the voltage deviation of each bus from its nominal value. So the J function will become as below:
∑
=−
=
nBusi i
country
V
J
1
|
(
1
)
|
(8)𝑉𝑉𝑖𝑖 stands for the bus voltage in per unit, country refers to
the answer of the algorithm which is a STATCOM with two variables, location and size. nBus is the number of buses on the system. The constrained optimization problem of optimal location of STATCOM is converted into an unconstrained optimization problem using penalty factor as given below.
PF )
(
OF country =Jcountry+ (9) OF is the overall objective function, J is the main function corresponding to the bus voltages, and PF is the penalty factor corresponding to the constraints violation. Constriants include:
• Answers which make one or more buses unstable, are excluded from the process. On each iteration the VPI and VQI indexes are evaluated for all buses. If a bus stability index reaches or passes unity, corresponding answer (country) is excluded from the process.
• A manualy margin is defind for bus voltages, answers (countries) resulting in voltage more than 1.05 p.u and less than 0.95 p.u are excluded by the algorithm.
4.2. Particle Swarm Optimization
To verify the applicability of ICA method, PSO algorithm is also applied to solve the problem and results are compared. A summary of PSO algorithm is described below. The initial population is generated just like initial countries in ICA method. Objective function is also the same as defined for the ICA method. But searching procedure is different. In each iteration the particles are updated and moved toward the global best answer with some deviations affected by particle's best position ever and its initial speed [10].
)) 1 ( .( . C )) 1 ( .( . ) 1 ( ) ( 2 2 1 1 − − + + − − + − = k X P rand k X P rand C k WV k V i g i i i
i (10)
) ( ) 1 ( )
(k X k V k
Xi = i − + i (11) Velocity update for particle 𝑖𝑖 is formulated in (7), and (8) shows the position update on 𝑘𝑘th iteration. 𝑊𝑊 is the inertia weight to lead the particle move on past direction. 𝐶𝐶1 and
𝐶𝐶2 are constant acceleration coefficients. 𝑟𝑟𝑟𝑟𝑟𝑟𝑟𝑟1 and 𝑟𝑟𝑟𝑟𝑟𝑟𝑟𝑟2
are separately random generated values in range of 0 to 1. First part of (7) is called "momentum" or "inertia" and leads the particle move across the same direction it had on the past iteration. Second part of (7) is called "memory" and leads the particle to the best position it have had. Third part of (7) is called "social knowledge" and leads the particle move toward the global best answer found by the whole population
[11]. Finally all particles will converge to a global best position and if the stop condition is satisfied, the algorithm presents the global best as the answer of the optimization problem.
5. Simulation Results
The ICA is applied to find the best location and size of STATCOM on 5, 14, and 30 bus test systems. All buses are free to be chosen, but the algorithm is smart enough to choose the PQ buses for the STATCOM to be installed on. To verify the applicability of the ICA method, results are compared to PSO results.
[image:4.595.312.552.343.645.2]On 5 bus test system, the convergence of both algorithms is fast, because the system is small and problem is rather easy to solve. The voltage of bus 1 remains constant as it has a generator connected. All parameters of the simulation for the 5 bus system are shown in Table 2, and results are also included. Maximum number of iterations has been set on 20.
Table 2. ICA and PSO Parameters and Simulation Results for 5 Bus System
PSO ICA
30 Number of Particles
30 Number of Countries Linearly Time Variant W 6 Number of Empires 1 C1 0.01
ξ
2 C2 0.064149 Sum of Voltage Deviations (Without STATCOM) 0.064149 Sum of VoltageDeviations (Without STATCOM)
0.028084 Sum of Voltage
Deviations (With STATCOM) 0.028084 Sum of Voltage Deviations (With STATCOM) 5 Selected Bus Number 5 Selected Bus Number 0.3478 Optimal Size of
STATCOM (p.u) 0.3478 Optimal Size of STATCOM (p.u) 595 Number of Function
Evaluations 597 Number of Function Evaluations 2.144711 Duration of process
(s) 2.232676
Duration of process (s)
Figure 7. Bus voltages in p.u before and after STATCOM installation by ICA for 5 bus system
Table 3. Bus voltage stability indexes before and after STATCOM placement at 5 bus system
VQI VPI
Bus No.
After Before
After Before
0 0
0 0
1
0.0388 0.0395
0.0064 0.0065
2
0.0141 0.0142
0.0140 0.0142
3
0.0047 0.0048
0.0113 0.0115
4
0.0793 0.0341
0.064 0.0681
[image:5.595.58.299.469.734.2]5
Table 4. ICA and PSO Parameters and Simulation Results for 14 Bus System
PSO ICA
30 Number of
Particles 30
Number of Countries
Linearly Time Variant W
6 Number of
Empires
1 C1
0.01
ξ
2 C2
0.55185 Sum of Voltage
Deviations (Without
STATCOM) 0.55185
Sum of Voltage Deviations
(Without STATCOM)
0.19057 Sum of Voltage
Deviations (With STATCOM) 0.19058
Sum of Voltage Deviations
(With STATCOM)
14 Selected Bus
Number 14
Selected Bus Number
0.2831 Optimal Size of
STATCOM (p.u) 0.2831
Optimal Size of STATCOM
(p.u)
739 Number of
Function Evaluations 620
Number of Function Evaluations
93.669712 Duration of
process (s) 73.944593
Duration of process (s)
Results for voltage stability index are shown in Table 3. The 5 bus test system remains stable and also it is gets more safe after STATCOM placement as VPI and VQI indexes get smaller. The reason VQI at bus 5 gets a larger value after the STATCOM placement is that the compensator is installed at bus 5 and injects reactive power to the grid.
Simulation parameters and results for 14 bus system are shown in Table 4. Note that despite the system expansion, the initial population is not increased in order to see the effect of system size in the operation of two algorithms for better comparison.
Both algorithms present the same results but with the expansion of the system, the ICA seems to converge a little faster because of the difference in stop condition. For both methods maximum number of iterations has been set on 25. But before ICA gets to this value, it will automatically stop the process because only one empire is left and the algorithm converges faster than expected.
Optimum compensation by ICA is depicted in Fig. 8. Voltage range limitations is expanded manually in the algorithm as the system size is expanded. On 5 bus test system the objective function constraint for voltage range was set on ±2.5% to force the algorithm operate more precise. The allowed range for 14 bus system voltages has been set on 0.95 to 1.05 p.u (±5%).
Figure 8. Bus voltages in p.u before and after STATCOM installation by ICA for 14 bus system
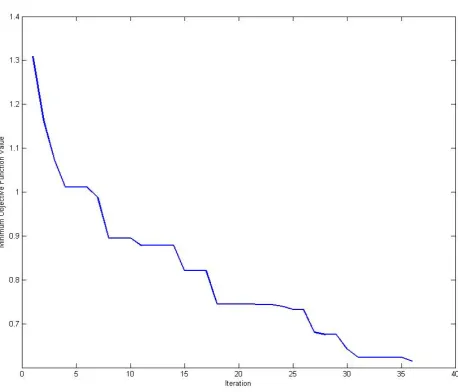
Figure 9. Convergence of ICA for 30 bus system
[image:6.595.76.535.305.697.2]For the 30 bus test system it is more likely to install more than 1 compensator, but this study has designed the algorithm to install a single STATCOM and it has successfully brought all voltages to the allowed range of 0.95 to 1.05 p.u. The convergence of the minimization process of the objective function for 30 bus test system is proposed in Fig. 9. Note that the maximum number of iterations has been set on 50.
Table 5. Bus voltage stability indexes before and after STATCOM placement at 14 bus system VQI
VPI Bus No.
After Before
After Before
0.1859 0.1870
0.6647 0.6686
1
0.7296 0.7391
0.1343 0.1361
2
0.0687 0.0699
0.4645 0.4730
3
0.1887 0.1949
0.2771 0.2863
4
0.0460 0.0474
0.0393 0.0405
5
0.1577 0.1726
0.1275 0.1396
6
0 0
0 0
7
0.1162 0.1246
0 0
8
0.0971 0.1071
0.1857 0.2049
9
0.0647 0.0714
0.0413 0.0456
10
0.0285 0.0314
0.0251 0.0276
11
0.0296 0.0329
0.0850 0.0944
12
0.1582 0.1775
0.0249 0.0279
13
0.5365 0.1431
0.1695 0.2054
14
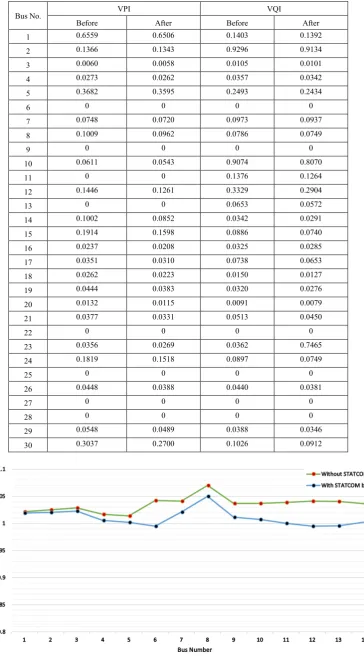
Figure 10. Bus voltages in p.u before and after STATCOM installation by ICA for 30 bus system
[image:7.595.103.513.146.650.2]Table 6. Bus voltage stability indexes before and after STATCOM placement at 30 bus system VQI VPI Bus No. After Before After Before 0.1392 0.1403 0.6506 0.6559 1 0.9134 0.9296 0.1343 0.1366 2 0.0101 0.0105 0.0058 0.0060 3 0.0342 0.0357 0.0262 0.0273 4 0.2434 0.2493 0.3595 0.3682 5 0 0 0 0 6 0.0937 0.0973 0.0720 0.0748 7 0.0749 0.0786 0.0962 0.1009 8 0 0 0 0 9 0.8070 0.9074 0.0543 0.0611 10 0.1264 0.1376 0 0 11 0.2904 0.3329 0.1261 0.1446 12 0.0572 0.0653 0 0 13 0.0291 0.0342 0.0852 0.1002 14 0.0740 0.0886 0.1598 0.1914 15 0.0285 0.0325 0.0208 0.0237 16 0.0653 0.0738 0.0310 0.0351 17 0.0127 0.0150 0.0223 0.0262 18 0.0276 0.0320 0.0383 0.0444 19 0.0079 0.0091 0.0115 0.0132 20 0.0450 0.0513 0.0331 0.0377 21 0 0 0 0 22 0.7465 0.0362 0.0269 0.0356 23 0.0749 0.0897 0.1518 0.1819 24 0 0 0 0 25 0.0381 0.0440 0.0388 0.0448 26 0 0 0 0 27 0 0 0 0 28 0.0346 0.0388 0.0489 0.0548 29 0.0912 0.1026 0.2700 0.3037 30
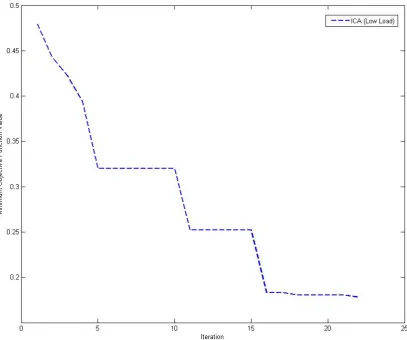
Figure 12. Convergence of ICA for 14 bus system under low load condition For all these simulation cases, systems are under heavy
loads and voltages have dropped below the nominal value. STATCOM is performing like a capacitor and injects reactive power to the system. It will be interesting to know the behavior of the algorithm applied to a system with low load. So the 14 bus system is modified and low load condition is made for the system. Optimum compensation by ICA is depicted in Fig. 11.
The answer for the low load condition by the ICA is bus number 6 and size of -0.2185 p.u. Number of Function Evaluations for this case is 703 and it converges in 22 iterations as proposed in Fig. 12. The negative value means that STATCOM is absorbing reactive power to lower the bus voltages. This case has verified the operation of ICA for low load conditions and power absorption of STATCOM.
6. Conclusions
This study has suggested the Imperialist Competitive Algorithm (ICA) for solving the location and sizing problem of the STATCOM which is a FACTS device for compensation in power systems. The procedure of ICA and its integration into the problem is described. Also Gauss-Seidel AC power flow method is used for the calculations of voltages in each bus. The simulations on
IEEE 5, 14 and 30 bus test systems show that the ICA is performing as well as PSO algorithm in the similar situation. Both heavy load and low load conditions are tested and ICA performed well on compensation by installing the STATCOM on the optimal bus and also choosing the optimal size for it. Successfully all voltages have been dragged to the allowed range of 0.95 to 1.05 p.u.
REFERENCES
[1] Saravanan, M., Slochanal, S., Venkatesh, P., & Abraham, J. (2007). Application of particle swarm optimization technique for optimal location of FACTS devices considering cost of installation and system loadability. Electric Power Systems Research, 77(3), 276-283.
[2] Sirjani, R., Mohamed, A., & Shareef, H. (2012). Optimal Placement and Sizing of Shunt FACTS Devices in Power Systems Using Heuristic Optimization Techniques: a Comprehensive Survey. Przegląd Elektrotechniczny, 88, 335-341.
[3] Acha, E., Fuerte-Esquivel, C. R., Ambriz-Perez, H., & Angeles-Camacho, C. (2004). FACTS: modelling and simulation in power networks. John Wiley & Sons.
Harley, R. G. (2006, October). Multiple STATCOM allocation and sizing using particle swarm optimization. In
Power Systems Conference and Exposition, 2006. PSCE'06. 2006 IEEE PES (pp. 1884-1891). IEEE.
[5] Atashpaz-Gargari, E., & Lucas, C. (2007, September). Imperialist competitive algorithm: an algorithm for optimization inspired by imperialistic competition. In
Evolutionary Computation, 2007. CEC 2007. IEEE Congress on (pp. 4661-4667). IEEE.
[6] Saadat, H. (1999). Power system analysis. WCB/McGraw-Hill, ch. 6.
[7] Althowibi, F. A., & Mustafa, M. W. (2013). Power System Voltage Stability: Indications, Allocations and Voltage Collapse Predictions. Power, 2(7).
[8] Richard D. Christie. (August 1999). Power Systems Test Case Archive. University of Washington Electrical Engineering Department Website, Retrieved from
http://www.ee.washington.edu/research/pstca/.
[9] Varshney, S., Srivastava, L., & Pandit, M. (2011). Comparison of PSO models for optimal placement and sizing of STATCOM.
[10] Eberhart, R. C., & Shi, Y. (2001). Particle swarm optimization: developments, applications and resources. In Evolutionary Computation, 2001. Proceedings of the 2001 Congress on (Vol. 1, pp. 81-86). IEEE.