B.E SEM VIII (EXTC) Experiment No. 09 Page | 1
Name:
Department. : EXTC
Class & Semester: B.E (Final Year), Sem VIII
Subject:
TNM
_________________________________________
Experiment No. 09
Aim.
Roll No:
Date:
Practical In-charge Sign:
B.E SEM VIII (EXTC) Experiment No. 09 Page | 2
EXPERIMENT NO: 07
Aim: Network Visualization using Etherape.
Software: Etherape ,Workstation.
Theory: EtherApe is a packet sniffer/network traffic monitoring tool, developed
for Unix. EtherApe is free, open source software developed under the GNU General Public License.
Network traffic is displayed using a graphical interface. Each node represents a specific host. Links represent connections to hosts. Nodes and links are color-coded to represent different protocols forming the various types of traffic on the network. Individual nodes and their connecting links grow and shrink in size with increases and decreases in network traffic.
Some of the features listed about EtherApe include (the following list refers to version 0.9.13 of EtherApe):
graphical network traffic display
color-coded node and links for most used protocols
traffic may be viewed on one's own network, end to end (IP) or port to port (TCP)
a variety of frame and packet types are supported
data view can be manipulated using a network filter
clicking a node or link provides additional information regarding including protocol
and traffic information
summary protocol and node table
can read traffic from a file or an actual network
handles traffic on Ethernet, WLAN, VLAN plus several other media and encapsulation types
supports both IPv4 and IPv6
XML export of node statistics
"central node" mode.
B.E SEM VIII (EXTC) Experiment No. 09 Page | 3 Procedure:
Running EtherApe
When you open EtherApe, you'll see a window much like the one shown in
Figure A.
B.E SEM VIII (EXTC) Experiment No. 09 Page | 4 Figure B
The Protocol window keeps a running total of each type of packet that traverses your network.
Protocols window
The Protocols window is a great tool to use for troubleshooting your network. Suppose your network becomes extremely slow, and you have no idea why. You can use
EtherApe to check on the traffic that's moving through your network. When you fire up EtherApe, you see a Web of traffic. You open the Protocols window and confirm that WWW is racking up an enormous amount of traffic. When you return to the Main
window, you see that the vast amount of WWW traffic is hitting one of your backup Web servers and that traffic is coming from one specific domain.
You can end this problem by blocking the domain from entering your internal network.
Blocking the offensive address is as simple as adding the suspect addresses to an input IP Tables chain like this.
B.E SEM VIII (EXTC) Experiment No. 09 Page | 5 Fig. C: The top protocol listed is the one with the most accumulated traffic.
Configuration of EtherApe
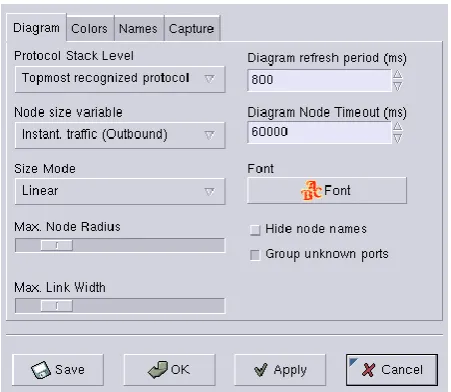
To configure EtherApe, click the Stop button on the main window and then click the Pref (preferences) button to open the Configuration window (Figure D).
Figure D
B.E SEM VIII (EXTC) Experiment No. 09 Page | 6 Using the Topmost level gives you more specific information about the packets traversing your network. For example, when viewing my network from Level 5, SNMP-TRAP is unknown; when viewing at Level 2, the only protocols visible are ARP and IP; when viewing at Level 4, SMTP is unknown.
I tend to view at the Top-most level, because I get a better picture of the packets hitting my network hardware. Node Size Variable is another handy configuration. Node Size allows you to dictate the direction in which EtherApe is monitoring. There are two types of traffic, instant and accumulative, and each type has three different directional patterns (in+out, inbound, and outbound).
On this same tab, you can alter the Diagram Refresh Rate. This rate count is in milliseconds, so don’t let the default 800 fool you. One thing I noticed with this particular configuration is the faster the refresh rate, the harder it is to follow the traffic. By setting the Diagram Refresh Rate at the fastest possible setting (50 milliseconds), the monitor became useless. Because of the high refresh rate, the size of the traffic and the host addresses were moving around so quickly, it looked as if I were playing an old Atari video game. However, at a much slower rate (2,000 milliseconds, for example), too much traffic is missed. On a larger network, I find it much easier to work somewhere between 500 and 700 milliseconds. Also on the Diagram tab is the Diagram Node Timeout option, which dictates how long a node will remain in the Diagram without activity. The default setting is 6,000 milliseconds. With a multi-node network, it would be wise to set this number to a lower number to make the Diagram more easily readable. For example, with a four-node network, the number of clients/servers and amount of traffic might be overwhelming. At this level of the network, there will be too many destination and source addresses shown on the screen at one time, which will prevent you from actually seeing the traffic. By allowing nodes to drop off the display (after a given amount of inactivity), the network traffic will be much more easily read.
Filters
B.E SEM VIII (EXTC) Experiment No. 09 Page | 7 monitor can help you to more quickly troubleshoot the problem.
WEB ADDRESS (URLS):
http://downloads.tomsguide.com/Etherape,0301-22772.ht http://sectools.org/tool/etherape/
CONCLUSION:Etherape is an advanced graphical display of connections and TCP / IP