www.ann-geophys.net/27/4039/2009/
© Author(s) 2009. This work is distributed under the Creative Commons Attribution 3.0 License.
Annales
Geophysicae
Separatrix regions of magnetic reconnection at the magnetopause
T. Lindstedt1,2, Yu. V. Khotyaintsev1, A. Vaivads1, M. Andr´e1, R. C. Fear3, B. Lavraud4, S. Haaland5,6, and
C. J. Owen7
1Swedish Institute of Space Physics, P.O. Box 537, 751 21 Uppsala, Sweden
2Department of Physics and Astronomy, Space and Plasma Physics, P.O. Box 515, 751 20 Uppsala, Sweden 3Department of Physics and Astronomy, University of Leicester, Leicester LE1 7RH, UK
4Centre d’Etude Spatiale des Rayonnements, CNRS, Toulouse, France
5Department of Physics and Technology, University of Bergen, Bergen, Norway 6Max-Planck-Institut f¨ur Extraterrestrische Physik, Garching, Germany
7Mullard Space Science Laboratory, University College London, Dorking, UK
Received: 3 November 2008 – Revised: 7 October 2009 – Accepted: 7 October 2009 – Published: 26 October 2009
Abstract. Using data from the four Cluster spacecraft we study the separatrix regions of magnetic reconnection sites at the dayside magnetopause under conditions when re-connection is occurring in the magnetopause current layer which separates magnetosheath plasma from the hot magne-tospheric plasma sheet. We define the separatrix region as the region between the separatrix – the first field line opened by reconnection – and the reconnection jet (outflow region). We analyze eight separatrix region crossings on the magne-tospheric side of the magnetopause and present detailed data for two of the events. We show that characteristic widths of the separatrix regions are of the order of ten ion inertial lengths at the magnetopause. Narrow separatrix regions with widths comparable to a few ion inertial lengths are rare. We show that inside the separatrix region there is a density cavity which sometimes has complex internal structure with multi-ple density dips. Strong electric fields exist inside the separa-trix regions and the electric potential drop across the regions can be up to several kV. On the magnetosheath side of the re-gion there is a density gradient with strong field aligned cur-rents. The observed strong electric fields and currents inside the separatrix region can be important for a local energiza-tion of ions and electrons, particularly of ionospheric origin, as well as for magnetosphere-ionosphere coupling.
Keywords. Magnetospheric physics (Magnetopause, cusp, and boundary layers) – Space plasma physics (Discontinu-ities; Magnetic reconnection)
Correspondence to: T. Lindstedt
(toli@irfu.se)
1 Introduction
Magnetic reconnection is an important process that occurs in different plasma environments: in the Earth’s magneto-sphere, at the Sun, in astrophysical plasmas as well as in laboratory plasmas (Biskamp, 2000). At the Earth’s mag-netopause, magnetic reconnection is the dominant process responsible for the entry of solar wind plasma into the mag-netosphere, as well as for the transfer of energy across the magnetopause.
X
Outflow/field reversalregion
Inflow region
Separatrix r egion Separ
atrix region
Ion edge Electron edge Magnetosheath
Separatrix
Separatrix
X-line
Magnetosphere
Inflow region 13:10:00
12:51:20
13:12:00 12:51:55
[image:2.595.50.284.62.247.2]S2 E2 I2 I1 E1S1
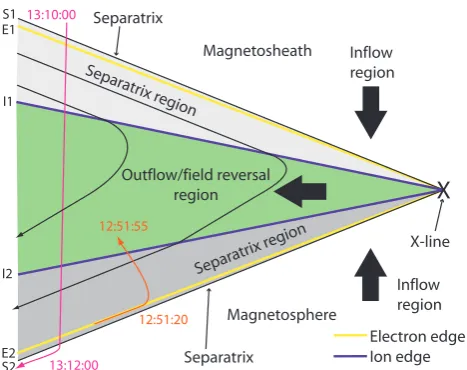
Fig. 1. Simplified sketch of a reconnection layer formed by an
X-line at the magnetopause. The separatrices are the magnetic field lines connected to the reconnection X-line. Just inside the separatrix are the electron edges in yellow. The purple lines illustrate the ion edges that are closer together than the electron edges due to the time-of-flight effect. Between the separatrices and ion edges are the separatrix regions in grey. Between the ion edges is the outflow region. Spacecraft orbits for the two events that are discussed in detail are shown by orange (12:51 UT) and pink (13:11 UT) lines. This figure is similar to Fig. 5 in Gosling et al. (1990).
Detailed experimental studies reveal that it is usually dif-ficult to identify fluid boundaries in the data, such as slow shocks. Instead, it is useful to introduce the separatrix region (see Fig. 1). The separatrix region is between the separatrix, the first field line opened by reconnection, and the reconnec-tion jet (outflow/field reversal region, Fig. 1). To identify the separatrix region kinetic particle signatures are impor-tant (Gosling et al., 1990; Vaivads et al., 2006; Khotyaintsev et al., 2006). The separatrix regions are at one side bounded by the separatrices – the magnetic field lines connected to the reconnection X-line. The separatrices are located very close to the electron edges as electrons propagate relatively fast along the magnetic field. The magnetospheric electron edge (E2) is where (going from the magnetosphere to the magnetosheath) the first electrons originating in the magne-tosheath are observed. Similarly, the magnemagne-tosheath electron edge (E1) is located where (going from the magnetosheath to the magnetosphere) the first magnetospheric electrons are observed. The separatrix regions contain a mixture of mag-netospheric and magnetosheath electrons but not of ions. The ion edges are defined in a similar way (see also Gosling et al., 1990). In some studies a difference is made between the ion edge and the fluid boundary of the reconnection jet (Bog-danova et al., 2006). In particular, this is possible to do at lower altitudes. However, similar to Gosling et al. (1990), we do not make such a distinction because at the
magne-topause it can be difficult to separate these boundaries. Thus, at the magnetospheric side the ion edge approximately coin-cides with the boundary of the reconnection jet (outflow/field reversal region in Fig. 1). Most of the magnetic field rotation from the magnetosheath to magnetospheric orientation hap-pens inside the outflow/field reversal region bounded by the ion edges.
The separatrix region on the magnetospheric side of day-side magnetopause has been extensively studied at low alti-tudes (Lockwood et al., 1994, 1996; Sandholt et al., 1998, 2002) and mid (5–7RE) altitudes (Topliss et al., 2001;
Bog-danova et al., 2004, 2006), as well as close to the mag-netopause (Gosling et al., 1990; Khotyaintsev et al., 2006; Retin`o et al., 2006). In some studies the separatrix region is referred to as the electron edge of the low latitude boundary layer (e.g. Bogdanova et al., 2006). On the basis of 8 events Bogdanova et al. (2004) discuss plasma and wave signatures characteristic for the separatrix regions (ULF waves, elec-tron beams and outflow of ionospheric ions). Topliss et al. (2001) and Bogdanova et al. (2006) presented large statisti-cal studies of this region. They found that the region can be up to 2◦ILAT thick. The median thickness was estimated to∼0.2◦ILAT corresponding to roughly about 600 km at the magnetopause.
Separatrix regions are important for the coupling between the Earth’s magnetosphere and the ionosphere, as they con-nect X-lines at the magnetopause to the ionosphere. It has been shown that separatrix regions can extend far from the X-line and still keep their narrow (ion inertial length scale) width as well as strong currents and electric fields (Khotyaintsev et al., 2006). Possible manifestations of the separatrix regions are strong auroras at the plasma sheet boundary layer (PSBL) for reconnection in the magneto-tail and poleward moving auroral forms, PMAFs, (Sandholt et al., 1998, 2002) for reconnection at the dayside magne-topause.
Earlier studies of separatrix regions have led to a signifi-cant improvement in understanding of the basic structure of these regions. It has been shown that ions are not “frozen-in”,
E+vi×B6=0, in the separatrix region (Khotyaintsev et al.,
2006). The deviation from the “frozen-in” condition oc-curs on scales comparable to or smaller than the ion iner-tial length, λi=c/ωpi, and is mainly provided by the Hall
term and electron pressure effects in the generalized Ohm’s law (Andr´e et al., 2004; Vaivads et al., 2004b; Khotyaintsev et al., 2006). The separatrix regions are regions of strong electric fields, currents and wave activity. As in the case of the slow shock, plasma heating and energization takes place in the separatrix region (Wygant et al., 2005; Vaivads et al., 2006; Topliss et al., 2001; Bogdanova et al., 2004).
strong currents and electric fields within the separatrix re-gion (Shay et al., 2001; Pritchett and Coroniti, 2004). Several mechanisms have been suggested to explain the formation of the cavity: electron density decrease close to a separatrix can be caused by escape of energetic (hot) magnetospheric electrons to the magnetosheath along a newly opened field line (Khotyaintsev et al., 2006) and/or due to parallel electric fields at the separatrix (Cattell et al., 2005). At the same time, the decrease of ion density within the cavity can be due to the acceleration of ions by the strong electric fields in the normal direction as ions move from the magnetosphere into the out-flow region (Shay et al., 2001; Khotyaintsev et al., 2006).
Systematic statistical studies addressing the internal struc-ture and the electric and magnetic fields of the separatrix regions have so far been lacking. Here we present a study of multiple encounters of separatrix regions by the Cluster spacecraft during ongoing reconnection at the magnetopause. We investigate if the features of the separatrix region identi-fied in single event studies (the density cavity, strong current and potential jump) are typical for most of the separatrix re-gion crossings.
2 Data set
We analyze data from the four Cluster spacecraft during the time interval 12:30–14:30 UT on 4 January 2004. The space-craft position is shown in Fig. 2 together with geomagnetic field lines obtained from the Tsyganenko T96 model (Tsy-ganenko, 1995). Cluster is located on the dusk side in the Northern Hemisphere sunward of the cusp. The separations between the spacecraft are small, about 300 km.
During the time interval we have studied, Cluster is in burst mode with high sampling rates on all instruments. We use data from all spacecraft. The electric field is obtained from the EFW instrument (Gustafsson et al., 2001). EFW measures two components of the electric field in the space-craft spin plane low-pass filtered at 180 Hz and sampled at 450 Hz. We use plasma density derived from the spacecraft potential, available at a resolution of 5 Hz, using an empirical conversion law (Escoubet et al., 1997; Pedersen et al., 2008) and calibrated using electron density measured by PEACE. Thus we can obtain plasma density estimates at a higher temporal resolution than from particle instruments where the data must be integrated over the spin period of 4 s to obtain plasma density. The magnetic field data is from the flux-gate magnetometer (FGM) (Balogh et al., 2001). FGM has a sampling frequency of 67 Hz. The electron data is from the plasma electron and current experiment (PEACE) (Johnstone et al., 1997; Owen et al., 2001) on spacecraft C2. We have used the 3DXP product from the high energy electron ana-lyzer (HEEA), which covers the energy range from 30 eV to 26 keV. The ion data is from the hot ion analyser part of the Cluster ion spectrometry experiment (CIS-HIA) (R`eme et al., 2001) on C1, which measures the ion fluxes in the energy
X
GSM(R
E)
Z
GSM(R
E)
5
5
10
Z
GSM(R
E)
5 10
5
[image:3.595.312.540.63.477.2]Y
GSM(R
E)
Fig. 2. Cluster orbit on 4 January 2004, 12:30–14:30 UT. During
this time interval Cluster moved from [2.3 9.8 5.7]RE (GSM) to
[3.7 11.2 5.7]RE (GSM). The maximum separation between the
spacecraft is∼300 km. The plot was created using OVT (http://ovt. irfu.se).
range from 5 to 32 000 eV/e. From the CIS-HIA instrument we also use the spin averaged ion velocity moment.
An overview of ACE (Smith et al., 1998; McComas et al., 1998) and Cluster data during the interval 12:30–14:30 UT on 4 January 2004 is presented in Fig. 3. The interplanetary magnetic field (IMF) z-component, measured by the MAG instrument on the ACE spacecraft, is shown in Fig. 3a to-gether with the IMF clock angle θ=arctan(By/Bz). This
means that 0◦and 360◦correspond to positiveBz, 90◦to
pos-itiveBy, 180◦to negativeBzand 270◦to negativeBy. The
-4 0 4
IMF B
z
[n
T] GSM
a
3 4
P s
w [nP
a]
b
c
B [n
T] GSM C1
-40 -20 0 20 40
60 Bx
By Bz Btot
-500 -250 0 250 500
V CIS
[k
m/s] GSM C1
d Vx
Vy Vz
10-1 100 101
NV
ps [cm
-3] C1
e nEFW
nCIS nPEACE
101 102 103 104
Ion Ener
gy
[eV
] C1
f
12:30 13:00 13:30 14:00 14:30
102 103 104
Elec
tr
on Ener
gy
[eV
] C2
04-Jan-2004
0 90 180 270 360
IMF Clock angle
-1 0 1
Distanc
e t
o MP [R
E
]
4 5 6 7
Log D e
-flux
keV/(cm s sr keV
)
12:47 12:51 12:58 13:06 13:09 13:11 13:46 13:55
0.1 0.2 0.3 0.4 0.5 0.6 0.7 0.8 0.9 1 g
Log D e
-flux
er
gs/(cm s sr eV
)
-6 -5 -4 -3
2
[image:4.595.104.495.63.592.2]2
Fig. 3. Overview of the Cluster magnetopause crossing on 4 January 2004, 12:30–14:30 UT from SC1. Panel (a) shows the interplanetary
magnetic field (IMF)Bzand the clock angle observed by the ACE spacecraft. Panel (b) shows the solar wind pressure and the estimated
between −8 nT and 4 nT. In Fig. 3b we show the solar wind dynamic pressure together with the distance between the Cluster location and the model magnetopause calculated using the Shue model (Shue et al., 1997). The negative dis-tance corresponds to locations inside the magnetosphere, as it is at the beginning of the interval, and the positive distance corresponds to the location inside the magnetosheath. ACE is located at the Lagrangian point L1 between the Sun and Earth. The time delay of the solar wind data is estimated with the method described by Weimer et al. (2003) with modifica-tions by Haaland et al. (2006).
Figure 3c–g shows Cluster data during the same inter-val 12:30–14:30 UT. In the first half of the interinter-val, be-tween 12:30 and 13:45 UT, Cluster is located primarily in-side the magnetosphere, and after a number of magnetopause crossings (change of sign ofBy andBz between 12:45 and
14:15 UT, Fig. 3c) exits to the magnetosheath at 14:12 UT. At the magnetospheric side the magnetic field is directed pri-marily along the+Bzand−ByGSM. The magnetospheric
plasma is stagnant (flow velocity is close to zero) and has a relatively low density∼0.5 cm−3 (Fig. 3d). The ion spec-trogram at spin resolution in Fig. 3f show omni-directional ion energy fluxes. Magnetospheric ions (Fig. 3f) and elec-trons (Fig. 3g) are hot, their temperatures are a few keV and∼10 keV respectively. In the magnetosheath the condi-tions are very different. The magnetic field is directed pri-marily along the−Bz and +By GSM. The plasma is
rel-atively dense, ∼14 cm−3, and flowing around the magne-topause (negativeVx, and positiveVy andVz in Fig. 3d) at
∼350 km/s. The temperature of ions is ∼400 eV and elec-trons∼100 eV.
3 Reconnection evidence
In this section, we discuss large scale evidence of ongoing reconnection during the selected time interval when Cluster is located close to the magnetopause. Then we illustrate the motion of the flux tubes assuming reconnection is occurring. The kinetic evidence of reconnection based on the electron distribution properties is discussed in the next section where two crossings of separatrix region are presented in detail.
Earlier studies show that reconnection at the magne-topause can be associated with flux transfer events (FTEs), bulges due to varying magnetic reconnection rate propagat-ing along the magnetopause (Russell and Elphic, 1978; Sc-holer, 1995; Khotyaintsev et al., 2004). The multiple cross-ings of the magnetopause we observe can also be caused by FTEs. Comparing magnetopause crossings with solar wind pressure variations in Fig. 3b we find no clear correlation and thus rule out solar wind pressure variations as a cause of most magnetopause crossings. During the first part of the interval Cluster is primarily located inside the magne-tosphere, the FTEs can be identified in Fig. 3 as encoun-ters of magnetosheath-like plasma on the magnetospheric
-40 -20 0 20 40
-40 -20 0 20 40
B [n
T] SC 1
-40 -20 0 20 40
12:46:30 12:47:00 12:47:30 12:48:00
12:51:10 12:51:30 12:52:00 12:52:30
12:58:00 12:58:30 12:59:00 12:59:20
04-Jan-2004
[image:5.595.317.545.63.412.2]BL BM BN Btot
Fig. 4. The magnetic field in local LMN-coordinates from
Clus-ter 1 for the events 12:47, 12:51 and 12:58, whereBLis dark blue, BM is green,BNis red andBT OT is light blue. TheN-direction
here is the normal to the magnetopause for the entry into the magne-tosheath at 14:10. This is direction is very similar to the local timing on the parallel current sheet used in the analysis. TheL-direction is the local magnetospheric direction.
field lines, e.g. at 12:47, 12:51, 12:58 UT. At these times the magnetic field increases in magnitude, however does not change to the magnetosheath direction. The ion velocity is sometimes as high as∼500 km/s and the plasma density in-creases almost to the magnetosheath level. The plasma is a mixture of magnetospheric and magnetosheath populations. The magnetic field in local LMN-coordinates from Cluster 1 for the events 12:47, 12:51 and 12:58 are shown in Fig. 4. The normal component of the magnetic fieldBN (red,
nor-mal direction is determined by inter-spacecraft timing on the full magnetopause crossing at 14:10) shows a bipolar signa-ture characteristic for FTEs (Russell and Elphic, 1978; Owen et al., 2008).BNchanges from positive to negative, which is
-200 -150 -100 -50 0 50 100 150 200 -200
-150 -100 -50 0 50 100 150 200
vL [km/s] vM
[k
m/s]
vobs vth 13:09
Fig. 5. Results of the Wal´en test for the event at 13:09 UT. The
outflow region is observed for more than 10 s and the result indicate that reconnection is ongoing sunward of the spacecraft. The blue line corresponds to the observed velocity and the red line to the calculated velocity.
an FTE traveling tailward, and the event at 12:47 UT is very similar. The event at 12:58 UT has a more complicated struc-ture of the normal magnetic field component; this strucstruc-ture, however, is likely to be produced by the same process as the FTE and can be interpreted as overlaid bipolar signatures.
To test for the presence of reconnection locally we have also carried out the Wal´en test (Sonnerup et al., 1981) for the events where there is data from both the outflow region and the magnetosheath, i.e. when the spacecraft cross the magne-topause. Figure 5 shows the Wal´en test for the magnetopause crossing at 13:09 UT. Figure 5 shows a comparison of the measured and estimated change of the velocityvL andvM
components. The ratio between the absolute values of the predicted and the observed magnitudes of the velocity vec-tors is 0.73 and the angle between the vectors is 7◦. The event at 13:09 UT shows a good agreement between the observed and predicted ion velocities and we conclude that within the magnetopause there is likely a rotational discontinuity with the reconnection X-line located sunward of the spacecraft. For the events 13:06 and 13:11 UT the crossings of the out-flow region are very fast and ion moments are measured only in at most 1–2 points inside the outflow region. However, these few points cannot be fully trusted because the ion mo-ments are computed from the data collected during one spin (∼4 s), and both the magnetic field and plasma density are highly variable at such time scales. Thus, we do not expect a good Wal´en test for these events. In summary, a reliable Wal´en test was only possible to perform on one crossing and this test suggest that the spacecraft are passing reconnect-ing flux tubes that has been reconnectreconnect-ing sunward from the spacecraft in all of the three analyzed crossings.
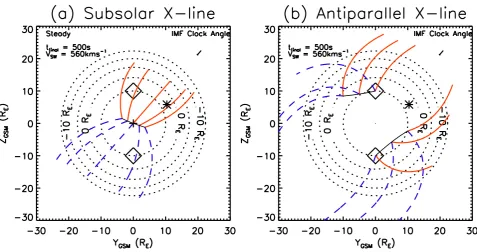
Both the polarity of the observed FTEs and the Wal´en test indicate that the reconnection site is located sunward from the spacecraft and this location is further supported by the Cooling model (Cooling et al., 2001). The Cooling model predicts the motion of reconnected flux tubes by calculating their velocity. This is the velocity of the de Hoffman-Teller frame calculated from the magnetosheath velocity, magnetic field and density. The magnetosheath magnetic field is from a model by Kobel and Fluckiger (1994) where character-istic solar wind magnetic field values for the time interval 12:50–13:10 UT is used. The geomagnetic field used by Cooling et al. (2001) to estimate the magnetopause current is very simple and the location of the anti-parallel X-line is approximate. We have made one run of the Cooling model for characteristic solar wind conditions during the interval (southward-duskward pointing IMF). In Fig. 6 we show the predictions of flux tube motion for the location of the recon-nection X-line at the subsolar point (in Fig. 6a) and where the reconnecting fields are antiparallel (in Fig. 6b). In the first case, where we assume that the reconnection occurs near the subsolar point, see Fig. 6a, the flux tubes connected to the Northern Hemisphere move poleward and duskward (red paths) and pass the location of the spacecraft. In the second case, see Fig. 6b, we assume that reconnection sites are in the pre-noon sector of the Northern Hemisphere and post-noon sector of the Southern Hemisphere, as expected from anti-parallel reconnection (Crooker, 1979), and the model pre-dicts that we should not expect reconnected flux tubes to pass the location of the spacecraft. Thus, we conclude that for characteristic IMF conditions during the interval the recon-nection X-line is most probably located close to the subsolar point.
The FTE signatures and the Wal´en test show the presence of ongoing reconnection with an X-line located southward of the spacecraft during the major part of the studied interval with southward IMF. The Cooling model results indicate that for these IMF conditions the reconnection X-line is located near the sub-solar region. Note that there is additional evi-dence for Cluster crossing reconnected flux tubes related to the properties of the separatrix regions themselves and that is discussed in the next section, e.g. the mixture of magne-tosheath and magnetospheric electrons.
4 Observations of separatrix regions
[image:6.595.51.287.64.254.2]Fig. 6. Motion of the opened field lines predicted by the Cooling model. Field lines connected to the Northern Hemisphere are shown in
red and field lines connected to the Southern Hemisphere are shown in blue. In (a) reconnection is initiated near the subsolar point. In
(b) reconnection is initiated in region of highest shear in the Northern and Southern Hemisphere. The position of Cluster is shown with an
asterisk. The diamond show the location of the cusp. The dotted lines are contours inXGSM.
entries into regions with magnetosheath-like plasma located on magnetospheric field lines; the dominant magnetic field component Bz does not change sign throughout the
cross-ing and thus the magnetic field preserves its magnetospheric orientation. The first event, at 12:47 UT, was analyzed in de-tail by Khotyaintsev et al. (2006). Note that some of these events may look like full crossings of the magnetopause re-connection layer in the overview plot (Fig. 3), e.g. 13:46 UT, but this is due to a short time delay between a partial and a full crossing. In the other events, at 13:06, 13:09 and 13:11 UT in Fig. 1, the spacecraft fully cross the main mag-netopause current layer (identified by the change ofBzsign).
We find similar characteristics for the eight events we have studied and present detailed data for the two sub-intervals (at 12:51 and 13:11 UT) marked with pink on top of Fig. 3. These two cases represent the two different situations: a par-tial (12:51 UT) and a full (13:11 UT) crossing of the magne-topause reconnection layer.
4.1 Full crossing of the magnetopause reconnection
layer, 13:11 UT
The observations are presented in the local LMN-coordinate system of the magnetopause obtained from minimum vari-ance analysis (MVA). The N direction given by MVA is consistent with normal direction obtained from timing anal-ysis of the magnetopause crossing (both density and
mag-netic field). Observations of the magnetopause crossing at 13:11 UT are shown in Fig. 7. The panels from top to bot-tom show: plasma density from EFW spacecraft potential (Fig. 7a), LMN-components of the magnetic field from FGM (Fig. 7b),N(Fig. 7c) andL(Fig. 7d) components of plasma flow velocity, full (green) and perpendicular (red) from CIS-HIA andE×Bfrom EFW, antiparallel (Fig. 7e) and parallel (Fig. 7f) toB electron fluxes from the PEACE 3DXP prod-uct (HEEA sensor) which has been rebinned using the actual magnetic field measured by the FGM.
Cluster is located in the magnetosheath (high density side) in the beginning of the interval and plasma flow is nearly parallel toB. Then plasma convection in theN direction in-creases (magnetopause moves outward) and Cluster crosses the main magnetopause current layer between 13:10:58 and 13:11:06 UT whereBL changes sign. On scales larger than
ion inertial lengthvEFW∼vCIS⊥and this velocity reflects the
102 103 104
Ener
gy [eV
]
e
13:10:00 13:10:20 13:10:40 13:11:00 13:11:20 13:11:40 13:12:00 102
103 104
Ener
gy [eV
]
04-Jan-2004
f a
NV
ps
[cm
-3 ]
10-1 100 101
b
B
[n
T]
-20 0 20
BL BM BN
c
V N
[k
m/s]
0 100 200
vEFW,N C2
vCIS,N C1
vCIS,⊥ C1
d
V L
[k
m/s]
0 100 200
an
tipar
Log D e
-flux
er
gs/(cm s sr eV
)
-7 -6 -5 -4
par
2
Figure 8 Separatrix region
Separatrix region OR
C2
C2
C2
C2
Fig. 7. Cluster crossing of the magnetopause reconnection layer on 4 January 2004, 13:11 UT. The panels from top to bottom show:
(a) plasma density, (b) LMN-components of the magnetic field, (c)vNnormal plasma flow velocity, (d)vLflow velocity components of
at the edge of the ion jet.BNis negative, which is consistent
with reconnection X-line being sunward from the spacecraft. While in the magnetosheath, at 13:10:20 UT Cluster detects a sharp increase in anti-parallel (away from the magnetopause) electron flux at energies above 400 eV, i.e. electrons of mag-netospheric origin. At the same time there is no change in the parallel flux. We identify this point as the outer sepa-ratrix or magnetosheath electron edge (E1), see Fig. 1. In the separatrix region on the magnetospheric side of the mag-netopause, 13:11:06–13:11:28 UT, we observe a mixture of magnetosheath-like electrons and electrons with energies 1– 10 keV, similar to the magnetospheric electron population. The transition to purely magnetospheric populations happens at 13:11:28 UT. We identify this point as the inner separatrix or magnetospheric electron edge (E2).
We further investigate the details of the reconnection layer, particularly concentrating on its magnetospheric side. Fig-ure 8 shows detailed observations. FigFig-ure 8a–d shows LMN-components and magnitude of the magnetic field. Figure 8e shows density derived from the EFW spacecraft potential. Figure 8f shows the ion energy spectrogram. Note that this ion spectrogram does not display the spin-averaged flux; it shows snapshots of the ion energy flux spectra for sub-spin accumulation periods of∼0.25 s. The fact that ion energy fluxes vary in a periodic fashion simply reflects the presence of a bulk ion flow relative to the spacecraft which appears modulated due to the spacecraft spin. Figure 8g shows cur-rent parallel to the magnetic field. The observed localized current sheets are too narrow to use multi-spacecraft tech-niques such as the curlometer (Robert et al., 2000) to estimate their current density. Instead, we estimate the current using a single spacecraft method (Luhr et al., 1996): we assume that changes in the magnetic field are due to plane current sheets moving across the spacecraft with a velocity,vdis, which is determined from timing analysis. Figure 8h shows theN -component of the electric field from EFW. Figure 8i shows the electric potential which is obtained by integrating theN -component of the electric field across the boundary. The full E-field vector is computed from the 2-D electric field mea-sured by EFW using the zero parallel electric field assump-tion. Figure 8j–k show the electron differential energy flux in two directions. The flux is obtained from the PEACE 3DXP product (HEEA sensor) which has been rebinned using the actual magnetic field measured by the FGM. Then we se-lect the sectors being perpendicular (Fig. 8j) and with the smallest measured angle relative to the magnetic field (the most parallel direction, Fig. 8k). The observed angle be-tween the selected sector with the smallest pitch angle and the magnetic field is shown in Fig. 8l (blue line). The sector with the smallest pitch angle is often rather far from being parallel to the magnetic field (up to 60◦) and the direction parallel toB is generally sampled only once per spin (an-gle∼0◦). Since the electron distribution is anisotropic, the changing pitch angle of the parallel sector recorded in Fig. 8k produces a characteristic periodic pattern. Figure 8m shows
distance to the magnetopause obtained by integration of the N-component of the plasma convection velocity,(E×B)N,
shown in Fig. 7c. The time axes of spacecraft SC1, SC3 and SC4 have been time shifted so that the different spacecraft data can be compared in the boundary reference frame.
The magnetopause current layer is identified by a change ofBLfrom negative in the magnetosheath to positive in the
magnetosphere. Inside this current layerBM makes a
bipo-lar change (Fig. 8b). Such bipobipo-lar signatures are usually at-tributed to Hall magnetic fields (Vaivads et al., 2004b). The magnetospheric edge of theBM variation coincides with the
main magnetopause density gradient, at which the density drops from the magnetosheath to magnetospheric level, and this is also the location of the ion edge (marked by the purple bar). At the density gradient there is a strong current par-allel to the magnetic field (Fig. 8g); the current density is 0.2 µA/m2. The parallel current is produced by Hall currents flowing towards and away from the X-line, in this case the strongest parallel current is flowing towards the X-line.
The high energy magnetospheric ion population is present on both sides of the magnetopause current layer (Fig. 8f). The magnetospheric population starts at several keV and goes outside the CIS-HIA energy range. The magnetospheric edge of the ion jet is located at 13:11:06 UT, at the main density gradient. At the high density side the plasma is dominated by the magnetosheath population with a typical energy of several hundred eV. As the spacecraft cross the density gradient it moves into a region populated mainly by plasma of dayside plasma sheet origin. At the same time (13:11:06 UT) theL-component of the plasma flow velocity decreases (Fig. 7d). The ion jet (VL∼200 km/s), accelerated
by theJ×Bforce, is localized inside the magnetopause cur-rent layer and is directed mostly perpendicular toB. On the magnetospheric side the main density gradient bounds the ion jet and we identify it as the “ion edge” (I2), see Fig. 1. Some magnetosheath ions with flux lower than in the mag-netosheath are still seen within the gyroradius distance from the density gradient,ρi∼230 km, and even deeper inside the
magnetosphere (seen around 13:11:22 UT in Fig. 8f, and a corresponding secondary velocity peak in VL in Fig. 7d).
The ion edges bound the outflow region observed between 13:10:58–13:11:06 UT where the plasma flowL-component increases in Fig. 7. On the magnetosheath side the ion edge cannot be well defined due to the data resolution and the larger gyroradius of magnetospheric ions. A good estimation of the position of the ion edge on the magnetosheath side is at the start of the accelerated ion flow, i.e. where the longi-tudinal plasma flow,VL, in Fig. 7 increases as the spacecraft
enter the outflow region from the magnetosheath.
Prior to the magnetopause current layer crossing we observe mainly the magnetosheath electron population in Fig. 8j and Fig. 8k, with electron energies up to 200 eV (Te∼40 eV). On the magnetospheric side of the
a
B L
[n
T]
-20 0 20
b
B M
[n
T]
0 15 30
c
B N
[n
T]
-10 0 10
d
B [n
T]
20 30
e
NV
ps
[cm
-3 ]
10-1 100 101
f
ion ener
gy
[eV
]
101 102 103 104
g
j ||
[
µ
V/m
2 ]
-0.20 0.2
h
E N
[mV/m]
-40 -200
20 40
i
pot
en
tial
[kV
]
-5 0 5
102 103 104
Ener
gy [eV
]
102 103 104
C2
l
pit
ch angle
[deg] 0 45 90
m
04-Jan-2004
D [k
m]
13:10:50 13:11:00 13:11:10 13:11:20 13:11:30 13:11:40 13:11:50 -2000
0 2000
per
p
par
Log D e
-flux
er
gs/(cm s sr eV
)
Log D e
-flux
keV/(cm s sr keV
)
4 5 6 8 7
density cavity dips
separatrix region
separ
atr
ix
ion edge
C1
outflow region
C2
C2
-7 -6 -5 -4 -3
j
k
2
2
0.3 0.4 0.5
NV
ps
[cm
-3] C1
C1 separatrix
region
[image:10.595.65.537.66.626.2]ion edge
Fig. 8. Cluster crossing of the magnetopause reconnection layer on 4 January 2004, 13:11 UT. Panels (a–d) show the magnetic field
with the magnetospheric population (energies above 2 keV, Te∼2 keV). Alongside with high energy (above 2 keV)
mag-netospheric electrons, electrons in the intermediate energy range 0.2–2 keV (above typical magnetosheath energy and below the magnetospheric) are observed between 13:11:06 (magnetospheric ion edge) and 13:11:28 UT, which we have identified as “magnetospheric separatrix”. The region be-tween the separatrix and the ion jet, is the “separatrix re-gion”. At the magnetospheric side of the separatrix (after 13:11:28 UT) electrons have a typical distribution with a nar-row loss cone, calculated to be∼2◦. The loss cone appears as periodic pattern in the parallel electrons (Fig. 8k) observed after 13:11:28 UT; the pattern is created due to a variation of the detector angle with respect toB: minima are seen when the angle (Fig. 8l) is close to zero. When plasma crosses the separatrix from the closed magnetic field lines of the mag-netosphere to the open field lines of the separatrix region, parallel magnetospheric electrons start to escape to the mag-netosheath creating a wider loss cone. At the same time also the magnetosheath electrons enter the separatrix region along the open field lines. During the magnetopause current layer crossing these electrons can be further accelerated into the in-termediate energy range 0.2–2 keV that is higher than typical electron energies in the magnetosheath. Such electrons with parallel energies less than 2 keV are observed at 13.11:28, 24, 20 UT, e.g. at times when PEACE samples the most field aligned population (pitch angle∼0◦in Fig. 8l). We locate the separatrix around 13:11:28 UT where the most energetic parallel electrons start to disappear and the accelerated mag-netosheath electrons appear.
The separatrix region is 2400 km wide (Fig. 8m) and it coincides with a region of increased magnetic field magni-tude and decreased plasma density (cavity, Fig. 8e). How-ever, it is important to notice that the density is derived from the spacecraft potential and changes in the spacecraft poten-tial are mainly related to variations in electron density, but also depend slightly on variations in electron temperature. Therefore on boundaries separating plasmas of different tem-peratures and densities, as in our case the separatrix region, the estimation of the density from the spacecraft potential is more complicated and the absolute depth of the density cav-ities needs to be further investigated. The density/spacecraft potential cavities are characteristic for separatrix regions on the magnetospheric side and they can even be useful in the identification of separatrix regions. In the cavity there are at least two individual density dips (Fig. 8e), each a few seconds long. Multi-spacecraft data allow us to see that the observa-tions of the individual density dips are time lagged among the spacecraft in such a way that we can conclude that the space-craft cross multiple density dips and do not make multiple encounters of the same density dip.
Inside the separatrix region there are strong normal electric fields (EN, Fig. 8h) up to 30 mV/m. The estimated change
of the electric potential across separatrix region is 4 kV be-tween 13:11:05–13:11:16 UT. The small distance bebe-tween
13:11:16–13:11:28 UT does not affect the electric potential considerably.
4.2 Partial crossing of the magnetopause reconnection
layer, 12:51 UT
The event at 12:51 UT (partial BL crossing, FTE) is pre-sented in Fig. 9 (the format is the same as for Fig. 8). In this case the reference system based on the minimum variance analysis is not appropriate because the spacecraft does not cross the main magnetopause current, but the parallel current sheets within the boundary layer, where the minimum vari-ance analysis does not gives reliable results. Instead we use
N=L×(n×L), wherenis the boundary normal given by the boundary velocityvdis=vdisnwhich is determined from the time delays between observations of the boundary by differ-ent spacecraft. The timing analysis is made on both the par-allel current sheet and the density gradient to give the best fit over the boundary. Note that this parallel current sheet is not the main magnetopause current layer, but a local cur-rent sheet located on the magnetospheric side from the mag-netopause current layer on the border between the magne-tosphere (separatrix region) and the outflow region. TheL -direction is the -direction of the magnetic field inside the mag-netosphere.Mcompletes the orthogonal systemM=N×L. In the event at 12:51 UT the longitudinal component of the magnetic field (BL in Fig. 9a) decreases to almost zero but
does not change sign. It means that the spacecraft does not cross the main magnetopause current layer but enters into it and then return back to the magnetosphere. At 12:51:46 UT perpendicular electrons in Fig. 9j show a characteristic tran-sition from the hot magnetospheric plasma (electron tem-peratureTe∼3 keV) to the colder magnetosheath-like plasma
(Te∼80 eV). Low energy perpendicular electrons are not
present prior to the transition. The flux of high energy mag-netospheric perpendicular electrons drastically decreases at the transition; however, some of these electrons are still present after the transition. The first magnetosheath ions (en-ergies between 100 eV–3 keV) are observed at the transition corresponding to the ion edge (purple bar), as seen in the high resolution time-energy ion spectrogram (Fig. 9f). Magneto-spheric ions (∼10 keV) are still present after the ion edge. After 12:51:46 UT there are mixed ions and electrons from the magnetosheath and the magnetosphere. At the same time the ion velocity (not shown) increases to about 300 km/s which means that the spacecraft enters the ion jet (reconnec-tion outflow/field reversal region). The density in the outflow region (n∼6 cm−3) is significantly higher than the magneto-spheric density (n∼0.5 cm−3).
a
B L
[n
T]
0 20
b
B M
[n
T] 0
c
B N
[n
T]
-10 0 10
d
B [n
T]
20 30
e
NV ps
[cm
-3 ]
100 101
f
ion ener
gy
[eV
]
101 102 103 104
g
j ||
[
µ
V/m
2 ]
-0.10 0.1 0.2
h
E N
[mV/m]
-50 0 50
i
pot
en
tial
[kV
]
-1 0 1
102 103 104
Ener
gy [eV
]
102 103 104
C2 l
pit
ch angle
[deg] 0
45
C1 m
04-Jan-2004
D [k
m]
12:51:20 12:51:30 12:51:40 12:51:50
-2000 0 2000
Log D e
-flux
keV/(cm s sr keV
)
4 5 6 7
0.5 0.4
0.3 NV
ps
[cm
-3 ] C1
Log D e
-flux
er
gs/(cm s sr eV
)
separatrix region outflow region
density cavity dips
C2 j
-7 -6 -5 -4 -3
C2 k
per
p
par
2
2
C1
ion edge
[image:12.595.75.523.64.590.2]separatrix
Fig. 9. Cluster crossing from the magnetosphere into the reconnection layer on 4 January 2004, 12:51 UT. Format of the figure is the same
as for Fig. 8. The LMN-directions are :L=[−0.21−0.95 0.25],M=[−0.08 0.27 0.96],N=[0.92 0.40−0.04] in GSE. The velocity of the discontinuity isvdis=176[−0.92−0.40 0.04] km/s GSE. The time axes for spacecraft 1–4 are shifted by [−0.42 0−1.40 0.03] s.
∼0.5–1 keV which is lower than the plasma sheet energies and, thus, originate from the magnetosheath, i.e. being the most energetic part of the magnetosheath population. We ex-pect to observe such magnetosheath electrons only very close
only during one spacecraft spin and the separatrix can be lo-cated very precisely, such a distribution is observed for many spins in this second event and the separatrix is observed for a longer time interval in Fig. 9. However, this interval still corresponds to a very narrow region in space. For this event we calculate the distance in the same way as for the previous event. Prior to 12:51:33 UT the spacecraft move very slowly and efficiently stay at the same position relative to the mag-netopause (Fig. 9m).
At 12:51:33 UT the normal velocity increases to
∼180 km/s (corresponding to the slope of the distance Din Fig. 9m) and the spacecraft cross the separatrix region reaching the ion edge at∼12:51:46 UT. The width of the separatrix region is ∼2100 km. Similar to the first event, the separatrix region coincides with the density cavity and the increased total magnetic field. As the spacecraft cross the separatrix region and get closer to the ion edge the characteristic energy of parallel electrons continuously decreases (Fig. 9k); the energy of the parallel electrons is changing more gradually than the rapid change in the perpendicular electrons at 12:51:46 UT in Fig. 9j. After the ion edge (12:51:47 UT) magnetosheath electrons are the dominant population.
Strong electric fields normal to the boundary (EN, Fig. 9h)
with amplitude up to 50 mV/m are observed inside the sepa-ratrix region. By integrating the normal electric field we get the electric potential which will affect ions crossing the sepa-ratrix region (Fig. 9i). Inside the sepasepa-ratrix region the poten-tial first increases and then decreases and in total the electric potential changes by 1.4 kV across the region. The steady po-tential increase inside the outflow region (after 12:51:47 UT) is due to the large plasma convection there. The strongest electric fields are localized on the low density side of the main density gradient. In Fig. 9g there is a current paral-lel to the magnetic field with a magnitude of 0.2 µA/m2at 12:51:47 UT. The parallel current is coinciding with the den-sity gradient located on the ion edge (I2) in Fig. 1. The mag-nitude of this parallel current and its location is the same as for the first event. The calculation of the current depends on the timing analysis which is valid up to only 12:51:47 UT for this event so the current estimation is no longer valid.
5 Discussion
We have analyzed in detail eight crossings of the mag-netopause reconnection layer (marked by vertical lines in Fig. 3) which are consistent with the spacecraft crossing sep-aratrix regions of reconnection sites during ongoing recon-nection. Evidence for ongoing reconnection are based on the properties of the observed reconnection ion jets and observa-tions of FTEs as well as observaobserva-tions of separatrix regions. The Cooling model shows that the observations are consis-tent with a reconnection site located sunward of the space-craft.
All the events we analyzed show a very similar bound-ary structure to the ones presented in detail in Fig. 8 and 9. Table 1 presents a summary of the main characteristics for all these events: the boundary velocity, the width of the separatrix region (distance between the separatrix and the main density gradient), potential variation inside the sepa-ratrix region and the maximum parallel current. For all of our events summarized in Table 1 we observe a density cav-ity between the magnetosphere and the outflow region (ion jet). The cavities contain a density decrease down to about half of the magnetospheric density and have a width rang-ing from 300 km (∼1c/ωpi(MS)∼4c/ωpi(SH )) to 2500 km
(∼9c/ωpi(MS)∼34c/ωpi(SH )). We find cavities which are
on average much wider than the one found by Andr´e et al. (2004) that is about 300 km, and by Retin`o et al. (2006) which is only 100 km wide. A discussion on how the density cavity is created can be found in Khotyaintsev et al. (2006). We could not identify the cause of different cavity widths. Our typical values of the width of the separatrix region can be compared with the separatrix region width estimates at much lower altitude in the mid altitude cusp region by Bogdanova et al. (2006). They find the separatrix region to have widths up to 2◦ILAT with 0.2◦ILAT being characteristic value. This width corresponds to a width of∼600 km near the magne-topause when mapped along the magnetic field and thus falls within the range of our estimates.
Almost all the magnetopause reconnection layer crossings show similar characteristic properties of the separatrix re-gion. The main density gradient defines the edge of the ion jet and the ion boundary to the the separatrix region. The outflow region is dominated by plasma of magnetosheath ori-gin. In the data we see that the outflow region and the mag-netopause current layer, identified as the time interval when theBL-component rotate from positive to negative values, at
Table 1. Summary of parameters of the observed separatrix regions on 4 January 2004. The table shows (1) the time of the event, (2) the
velocity of the discontinuity, (3) the width of the separatrix region, (4) the potential change over the separatrix region with the starting point on the magnetospheric side of the separatrix region, (5) the potential dip with respect to the magnetospheric level and positive sign corresponds to diverging electric fields and (6) the magnitude of the parallel current. The potential dip is a potential change over a region smaller than the width of the separatrix region.
Time vdis width potential change potential dip current (km/h) (km) (kV) (kV) (µA/m2)
12:47 270 300 −2.6±1.3 – 0.3 12:51 180 1400 −0.7±0.3 0.8±0.3 0.2 12:58 250 1500 1.1±0.6 −1.0±0.4 0.5 13:06 60 1500 5.4±0.9 – 0.6 13:09 150 1500 5.4±1.6 – 0.3 13:11 210 2300 3.8±0.7 – 0.2 13:46 180 2500 0.8±0.8 −1.5±0.5 0.1 13:55 140 300 0.75±0.3 – 0.2
of the separatrix region is the separatrix, a transition from the open to closed magnetospheric field lines. Low energy (below the typical plasma sheet energies) field aligned elec-trons are no longer observed on the magnetospheric side of the separatrix. This point also coincides with the magneto-spheric edge of the density cavity.
On the main density gradient which is located on the ion boundary of the magnetospheric separatrix region we ob-serve a thin parallel current sheet with typical current den-sities between 0.1 µA/m2and 0.6 µA/m2. Presumably, these field-aligned currents are at one end closed by the Hall cur-rents in the ion diffusion region (Vaivads et al., 2004b), and at the other end most probably closed through the currents in the ionosphere. Mapping the field aligned current densities to the ionosphere results in expected field aligned current densi-ties at the top of the ionosphere of 200 µA/m2–1200 µA/m2. For the mapping we use thatB∼1/R2andJ∼1/R2soB∼J and a typical magnetic field value of 20 nT in the magneto-sphere and 4×10⁴nT in the ionosphere. Large field aligned currents of hundreds µA/m2have previously been observed by the low altitude satellites such as Freja and Astrid-II on similar magnetospheric flux tubes (Stasiewicz et al., 1998; Ivchenko and Marklund, 2002). In the ionosphere the man-ifestation of field-aligned currents originating in the magne-tosheath have been observed, e.g. in the form of poleward moving auroral forms (PMAFs) (Sandholt et al., 1998).
All observed separatrix regions are associated with strong electric fields. The strongest electric field component is in the direction normal to the boundary and the values that we have observed (e.g. in Fig. 8 and Fig. 9) are of the same mag-nitude as previously observed by Andr´e et al. (2004) and Retin`o et al. (2006). Note that it is the tangential electric field and not the normal electric field that corresponds to the plasma motion across the boundary. The normal electric field has a fast fluctuating component with frequency above a few Hz, that is most probably related to electrostatic lower
Magnetosphere Magnetosheath
Major X-line Secondary island
Secondary X-line
[image:15.595.99.497.69.193.2](a) (b)
Fig. 10. Illustration of the spacecraft crossings of the magnetopause during reconnection due to multiple X-lines. The major X-line is on the
right and the secondary X-line is on the left. Separatrices associated with the X-lines are marked in red and plasma density is shaded in grey, density cavities associated with the X-lines can be seen as light grey bands next to the separatrices. Two example crossings by spacecraft are marked in yellow. The spacecraft on the left crosses a wide cavity with multiple dips due to multiple X-lines, the spacecraft on the right crosses closer to the major X-line and sees only one narrow cavity.
the separatrix region. Earlier studies show that the strong normal electric fields are mainly Hall fields, E∼j×B/ne, and do not correspond to the large scale motion of the plasma (Khotyaintsev et al., 2006).
In 7 out of 8 events we observe a complex internal struc-ture of the separatrix region with multiple density dips inside the cavities. The origin of the dips is not fully understood. One possibility involves existence of multiple X-lines (and multiple separatrices) due to formation of secondary mag-netic islands at the reconnection site. The existence of such islands has been confirmed both using numerical simulations (Daughton et al., 2006) and spacecraft observations (East-wood et al., 2007; Chen et al., 2008). If the formation of a density cavity is characteristic for every active X-line we could use this to monitor whether reconnection is ongoing at a single or multiple X-lines. Figure 10 illustrates spacecraft crossings of the magnetopause with two X-lines. The yel-low line shows the spacecraft orbit. In the crossing (a) to the right in Fig. 10 the spacecraft is crossing the magnetopause near the major X-line and only observe a single separatrix on the magnetospheric side. The density in Fig. 10 is illustrated by the grey background color. Light grey color corresponds to low density and darker to high density. The single sepa-ratrix crossing then corresponds to the crossing of a single density cavity. In the crossing (b) to the left in Fig. 10 there is another X-line present between the spacecraft and the ma-jor X-line. In this case we observe a density cavity with two density dips corresponding to crossing two separatrices, one from the major X-line and one from the secondary X-line. In the future it is necessary to test if similar wide density cav-ities with multiple dips can be produced in numerical sim-ulations and whether multiple dips are correlated with the presence of multiple X-lines.
6 Conclusions
We have studied Cluster spacecraft observations in the vicin-ity of the dayside magnetopause on 4 January 2004, between 12:30 and 14:30 UT. During this time the IMF was varying but mainly directed southward and we find signatures of on-going reconnection. We analyze in detail eight encounters of the separatrix region of magnetic reconnection on the mag-netospheric side of the magnetopause current layer, i.e. the region located between the inner (magnetospheric) separa-trix and the reconnection jet.
We find a similar structure of the separatrix region in all our events: (1) a density cavity, (2) strong parallel currents which coincide with the ion boundary, (3) strong electric fields and (4) large potential variations across the region. In most events there are multiple density dips inside the cavi-ties. The total width of the cavities varies between 300 km and 2500 km which is from a few to a few tens of the ion in-ertial length and consistent with observations at much lower altitudes (Bogdanova et al., 2006). The electron distribu-tions observed inside the separatrix regions show a gradual change in the parallel energy due to transition from the mag-netospheric to magnetosheath electron population that is con-sistent with expected signatures when magnetospheric and magnetosheath electrons mix on newly opened field lines.
Inside the density cavity we find strong electric fields di-rected normal to the boundary. We integrate this electric field to obtain the electric potential structure across the separatrix region. The electric potential shows potential jumps of sev-eral kV across the separatrix region. In some cases there can be internal structure of the electric potential showing di-verging electric fields but in most cases the potential changes monotonically across the separatrix region. The strong elec-tric fields within the separatrix region can contribute to the energization (by a few keV), of the ions crossing this region. This can be particularly important for cold ionospheric ions.
Acknowledgements. We Would like to thank CIS, FGM and
PEACE teams as well as the ESA Cluster Active Archive for pro-viding the data.
Topical Editor I. A. Daglis thanks two anonymous referees for their help in evaluating this paper.
References
Andr´e, M., Vaivads, A., Buchert, S. C., Fazakerley, A. N., and Lahiff, A.: Thin electron-scale layers at the magnetopause, Geo-phys. Res. Lett., 31, 3803, doi:10.1029/2003GL018137, 2004. Balogh, A., Carr, C. M., Acu˜na, M. H., Dunlop, M. W., Beek, T.
J., Brown, P., Fornacon, H., Georgescu, E., Glassmeier, K.-H., Harris, J., Musmann, G., Oddy, T., and Schwingenschuh, K.: The Cluster Magnetic Field Investigation: overview of in-flight performance and initial results, Ann. Geophys., 19, 1207–1217, 2001,
http://www.ann-geophys.net/19/1207/2001/.
Biernat, H. K., Semenov, V. S., Drobysh, O. A., and Heyn, M. F.: Magnetic reconnection: Observations on October 29, 1979, and model results, J. Geophys. Res., 103, 11919–11928, doi: 10.1029/98JA00587, 1998.
Biskamp, D.: Magnetic reconnection in Plasmas, Cambridge Uni-versity Press, iSBN 0 521 58288 1, 2000.
Bogdanova, Y. V., Fazakerley, A. N., Owen, C. J., Klecker, B., Cornilleau-Wehrlin, N., Grison, B., Andr´e, M., Cargill, P., R`eme, H., Bosqued, J. M., Kistler, L. M., and Balogh, A.: Cor-relation between suprathermal electron bursts, broadband ex-tremely low frequency waves, and local ion heating in the mi-daltitude cleft/low-latitude boundary layer observed by Clus-ter, J. Geophys. Res. (Space Physics), 109, 12226, doi:10.1029/ 2004JA010554, 2004.
Bogdanova, Y. V., Owen, C. J., Fazakerley, A. N., Klecker, B., and R`eme, H.: Statistical study of the location and size of the electron edge of the Low-Latitude Boundary Layer as observed by Cluster at mid-altitudes, Ann. Geophys., 24, 2645–2665, 2006, http://www.ann-geophys.net/24/2645/2006/.
Cattell, C., Dombeck, J., Wygant, J., Drake, J. F., Swisdak, M., Goldstein, M. L., Keith, W., Fazakerley, A., Andr´e, M., Lucek, E., and Balogh, A.: Cluster observations of electron holes in association with magnetotail reconnection and comparison to simulations, J. Geophys. Res. (Space Physics), 110, 1211, doi: 10.1029/2004JA010519, 2005.
Chen, L.-J., Bhattacharjee, A., Puhl-Quinn, P. A., Yang, H., Bessho, N., Imada, S., M¨uhlbachler, S., Daly, P. W., Lefebvre, B., Khotyaintsev, Y., Vaivads, A., Fazakerley, A., and Georgescu,
E.: Observation of energetic electrons within magnetic islands, Nature Physics, 4, 19–23, doi:10.1038/nphys777, 2008. Cooling, B. M. A., Owen, C. J., and Schwartz, S. J.: Role
of the magnetosheath flow in determining the motion of open flux tubes, J. Geophys. Res., 106, 18763–18776, doi:10.1029/ 2000JA000455, 2001.
Crooker, N. U.: Dayside merging and cusp geometry, J. Geophys. Res., 84, 951–959, doi:10.1029/JA084iA03p00951, 1979. Daughton, W., Scudder, J., and Karimabadi, H.: Fully kinetic
sim-ulations of undriven magnetic reconnection with open bound-ary conditions, Phys. Plasmas, 13, 2101, doi:10.1063/1.2218817, 2006.
Eastwood, J. P., Phan, T.-D., Mozer, F. S., Shay, M. A., Fuji-moto, M., Retin`o, A., Hesse, M., Balogh, A., Lucek, E. A., and Dandouras, I.: Multi-point observations of the Hall electromag-netic field and secondary island formation during magelectromag-netic re-connection, J. Geophys. Res. (Space Physics), 112, 6235, doi: 10.1029/2006JA012158, 2007.
Escoubet, C. P., Pedersen, A., Schmidt, R., and Lindqvist, P. A.: Density in the magnetosphere inferred from ISEE 1 spacecraft potential, J. Geophys. Res., 102, 17595–17610, doi:10.1029/ 97JA00290, 1997.
Gosling, J. T., Thomsen, M. F., Bame, S. J., Onsager, T. G., and Russell, C. T.: The electron edge of the low latitude boundary layer during accelerated flow events, Geophys. Res. Lett., 17, 1833–1836, 1990.
Gustafsson, G., Andr´e, M., Carozzi, T., Eriksson, A. I., F¨althammar, C.-G., Grard, R., Holmgren, G., Holtet, J. A., Ivchenko, N., Karlsson, T., Khotyaintsev, Y., Klimov, S., Laakso, H., Lindqvist, P.-A., Lybekk, B., Marklund, G., Mozer, F., Mur-sula, K., Pedersen, A., Popielawska, B., Savin, S., Stasiewicz, K., Tanskanen, P., Vaivads, A., and Wahlund, J.-E.: First results of electric field and density observations by Cluster EFW based on initial months of operation, Ann. Geophys., 19, 1219–1240, 2001,
http://www.ann-geophys.net/19/1219/2001/.
Haaland, S., Paschmann, G., and Sonnerup, B. U. ¨O.: Comment on “A new interpretation of Weimer et al.’s solar wind propaga-tion delay technique” by Bargatze et al., J. Geophys. Res. (Space Physics), 111, 6102, doi:10.1029/2005JA011376, 2006. Ivchenko, N. and Marklund, G.: “Current singularities” observed
on Astrid-2, Adv. Space Res., 30, 1779–1782, 2002.
Johnstone, A. D., Alsop, C., Burge, S., Carter, P. J., Coates, A. J., Coker, A. J., Fazakerley, A. N., Grande, M., Gowen, R. A., Gur-giolo, C., Hancock, B. K., Narheim, B., Preece, A., Sheather, P. H., Winningham, J. D., and Woodliffe, R. D.: Peace: a Plasma Electron and Current Experiment, Space Sci. Rev., 79, 351–398, doi:10.1023/A:1004938001388, 1997.
Khotyaintsev, Y., Buchert, S., Stasiewicz, K., Vaivads, A., Savin, S., Papitashvili, V. O., Farrugia, C. J., Popielawska, B., and Tung, Y.-K.: Transient reconnection in the cusp during strongly nega-tive IMF By, J. Geophys. Res. (Space Physics), 109, 4204, doi: 10.1029/2003JA009908, 2004.
Khotyaintsev, Y. V., Vaivads, A., Retin`o, A., Andr´e, M., Owen, C. J., and Nilsson, H.: Formation of Inner Structure of a Re-connection Separatrix Region, Phys. Rev. Lett., 97, 205003, doi: 10.1103/PhysRevLett.97.205003, 2006.
doi:10.1029/94JA01778, 1994.
Levy, R. H., Petschek, H. E., and Siscoe, G. L.: Aerodynamic as-pects of the magnetospheric flow, AIAA, 2, 2065–2076, 1964. Lin, Y. and Lee, L. C.: Reconnection layer at the flank
magne-topause in the presence of shear flow, Geophys. Res. Lett., 21, 855–858, doi:10.1029/94GL00704, 1994.
Lockwood, M., Onsager, T. G., Davis, C. J., Smith, M. F., and Denig, W. F.: The characteristic of the magnetopause recon-nection X-line deduced from low-altitude satellite observations of cusp ions, Geophys. Res. Lett., 21, 2757–2760, doi:10.1029/ 94GL02696, 1994.
Lockwood, M., Cowley, S. W. H., and Onsager, T. G.: Ion ac-celeration at both the interior and exterior Alfv´en waves asso-ciated with the magnetopause reconnection site: Signatures in cusp precipitation, J. Geophys. Res., 101, 21501–21514, doi: 10.1029/96JA01948, 1996.
Luhr, H., Warnecke, J. F., and Rother, M. K. A.: An algorithm for estimating field-aligned currents from single spacecraft magnetic field measurements: a diagnostic tool applied to Freja satellite data, IEEE Transactions on Geoscience and Remote Sensing, 34, 1369–1376, doi:10.1109/36.544560, 1996.
Lundin, R., Yamauchi, M., Woch, J., and Marklund, G.: Boundary layer polarization and voltage in the 14 MLT region, J. Geophys. Res., 100, 7587–7597, 1995.
McComas, D. J., Bame, S. J., Barker, P., Feldman, W. C., Phillips, J. L., Riley, P., and Griffee, J. W.: Solar Wind Electron Pro-ton Alpha Monitor (SWEPAM) for the Advanced Composi-tion Explorer, Space Sci. Rev., 86, 563–612, doi:10.1023/A: 1005040232597, 1998.
Mozer, F. S., Bale, S. D., and Phan, T. D.: Evidence of Diffusion Regions at a Subsolar Magnetopause Crossing, Phys. Rev. Lett., 89, 015002, doi:10.1103/PhysRevLett.89.015002, 2002. Owen, C. J., Fazakerley, A. N., Carter, P. J., Coates, A. J.,
Krauk-lis, I. C., Szita, S., Taylor, M. G. G. T., Travnicek, P., Wat-son, G., WilWat-son, R. J., Balogh, A., and Dunlop, M. W.: Clus-ter PEACE observations of electrons during magnetospheric flux transfer events, Ann. Geophys., 19, 1509–1522, 2001,
http://www.ann-geophys.net/19/1509/2001/.
Owen, C. J., Marchaudon, A., Dunlop, M. W., Fazakerley, A. N., Bosqued, J.-M., Dewhurst, J. P., Fear, R. C., Fuse-lier, S. A., Balogh, A., and R`eme, H.: Cluster observations of “crater” flux transfer events at the dayside high-latitude magne-topause, J. Geophys. Res. (Space Physics), 113, 7, doi:10.1029/ 2007JA012701, 2008.
Pedersen, A., Lybekk, B., Andr´e, M., Eriksson, A., Masson, A., Mozer, F. S., Lindqvist, P.-A., D´ecr´eau, P. M. E., Dandouras, I., Sauvaud, J.-A., Fazakerley, A., Taylor, M., Paschmann, G., Svenes, K. R., Torkar, K., and Whipple, E.: Electron den-sity estimations derived from spacecraft potential measurements on Cluster in tenuous plasma regions, J. Geophys. Res. (Space Physics), 113, 7, doi:10.1029/2007JA012636, 2008.
Petschek, H. E.: Magnetic Field Annihilation, pp. 425–+, 1964. Pritchett, P. L. and Coroniti, F. V.: Three-dimensional
collision-less magnetic reconnection in the presence of a guide field, J. Geophys. Res. (Space Physics), 109, 1220, doi:10.1029/ 2003JA009999, 2004.
R`eme, H., Aoustin, C., Bosqued, J. M., Dandouras, I., Lavraud, B., Sauvaud, J. A., Barthe, A., Bouyssou, J., Camus, Th., Coeur-Joly, O., Cros, A., Cuvilo, J., Ducay, F., Garbarowitz, Y., Medale,
J. L., Penou, E., Perrier, H., Romefort, D., Rouzaud, J., Vallat, C., Alcayd´e, D., Jacquey, C., Mazelle, C., d’Uston, C., M¨obius, E., Kistler, L. M., Crocker, K., Granoff, M., Mouikis, C., Popecki, M., Vosbury, M., Klecker, B., Hovestadt, D., Kucharek, H., Kuenneth, E., Paschmann, G., Scholer, M., Sckopke, N., Seiden-schwang, E., Carlson, C. W., Curtis, D. W., Ingraham, C., Lin, R. P., McFadden, J. P., Parks, G. K., Phan, T., Formisano, V., Amata, E., Bavassano-Cattaneo, M. B., Baldetti, P., Bruno, R., Chion-chio, G., Di Lellis, A., Marcucci, M. F., Pallocchia, G., Korth, A., Daly, P. W., Graeve, B., Rosenbauer, H., Vasyliunas, V., Mc-Carthy, M., Wilber, M., Eliasson, L., Lundin, R., Olsen, S., Shel-ley, E. G., Fuselier, S., Ghielmetti, A. G., Lennartsson, W., Es-coubet, C. P., Balsiger, H., Friedel, R., Cao, J.-B., Kovrazhkin, R. A., Papamastorakis, I., Pellat, R., Scudder, J., and Sonnerup, B.: First multispacecraft ion measurements in and near the Earth’s magnetosphere with the identical Cluster ion spectrometry (CIS) experiment, Ann. Geophys., 19, 1303–1354, 2001,
http://www.ann-geophys.net/19/1303/2001/.
Retin`o, A., Vaivads, A., Andr´e, M., Sahraoui, F., Khotyaintsev, Y., Pickett, J. S., Bavassano Cattaneo, M. B., Marcucci, M. F., Mo-rooka, M., Owen, C. J., Buchert, S. C., and Cornilleau-Wehrlin, N.: Structure of the separatrix region close to a magnetic recon-nection X-line: Cluster observations, Geophys. Res. Lett., 33, 6101, doi:10.1029/2005GL024650, 2006.
Robert, P., Dunlop, M. W., Roux, A., and Chanteur, G.: Accu-racy of Current Density Determination, in: Analysis Methods for Multi-Spacecraft Data, edited by Paschmann, G. and Daly, P. W., chap. 16, pp. 395–418, Int. Space Sci. Inst., Bern., 2000. Russell, C. T. and Elphic, R. C.: Initial ISEE magnetometer results
- Magnetopause observations, Space Sci. Rev., 22, 681–715, doi: 10.1007/BF00212619, 1978.
Sandholt, P. E., Farrugia, C. J., Moen, J., Noraberg, Ø., Lybekk, B., Sten, T., and Hansen, T.: A classification of dayside auroral forms and activities as a function of interplanetary magnetic field orientation, J. Geophys. Res., 103, 23325–23346, doi:10.1029/ 98JA02156, 1998.
Sandholt, P. E., Denig, W. F., Farrugia, C. J., Lybekk, B., and Trond-sen, E.: Auroral structure at the cusp equatorward boundary: Re-lationship with the electron edge of low-latitude boundary layer precipitation, J. Geophys. Res. (Space Physics), 107, 1235, doi: 10.1029/2001JA005081, 2002.
Scholer, M.: Models of Flux Transfer Events, pp. 235, Physics of the Magnetopause, 1995.
Schwartz, S. J.: Shock and Discontinuity Normals, Mach Num-bers, and Related Parameters, in: Analysis Methods for Multi-Spacecraft Data, edited by: Paschmann, G. and Daly, P. W., chap. 10, pp. 249–270, Int. Space Sci. Inst., Bern., 2000. Semenov, V. S., Kubyshkin, I. V., Lebedeva, V. V., Rijnbeek, R. P.,
Heyn, M. F., Biernat, H. K., and Farrugia, C. J.: A comparison and review of steady-state and time-varying reconnection, Planet. Space Sci., 40, 63–87, doi:10.1016/0032-0633(92)90150-M, 1992.
Shay, M. A., Drake, J. F., Rogers, B. N., and Denton, R. E.: Alfv´enic collisionless magnetic reconnection and the Hall term, J. Geophys. Res., 106, 3759–3772, doi:10.1029/1999JA001007, 2001.
Res., 102, 9497–9512, doi:10.1029/97JA00196, 1997.
Smith, C. W., L’Heureux, J., Ness, N. F., Acu˜na, M. H., Burlaga, L. F., and Scheifele, J.: The ACE Magnetic Fields Experiment, Space Sci. Rev., 86, 613–632, doi:10.1023/A:1005092216668, 1998.
Sonnerup, B. U. O., Paschmann, G., Papamastorakis, I., Sckopke, N., Haerendel, G., Bame, S. J., Asbridge, J. R., Gosling, J. T., and Russell, C. T.: Evidence for magnetic field reconnection at the earth’s magnetopause, J. Geophys. Res., 86, 10049–10067, 1981.
Stasiewicz, K., Holmgren, G., and Zanetti, L.: Density depletions and current singularities observed by Freja, J. Geophys. Res., 103, 4251–4260, doi:10.1029/97JA02007, 1998.
Topliss, S., Johnstone, A., Coates, A., Peterson, W. K., Kletz-ing, C. A., and Russell, C. T.: Charge neutrality and ion conic distributions at the equatorward electron edge of the midalti-tude cusp, J. Geophys. Res., 106, 21095–21108, doi:10.1029/ 2000JA003032, 2001.
Tsyganenko, N. A.: Modeling the Earth’s magnetospheric magnetic field confined within a realistic magnetopause, J. Geophys. Res., 100, 5599–5612, doi:10.1029/94JA03193, 1995.
Vaivads, A., Andr´e, M., Buchert, S. C., Wahlund, J.-E., Fazakerley, A. N., and Cornilleau-Wehrlin, N.: Cluster observations of lower hybrid turbulence within thin layers at the magnetopause, Geo-phys. Res. Lett., 31, 3804, doi:10.1029/2003GL018142, 2004a.
Vaivads, A., Khotyaintsev, Y., Andr´e, M., Retin`o, A., Buchert, S. C., Rogers, B. N., D´ecr´eau, P., Paschmann, G., and Phan, T.: Structure of the Magnetic Reconnection Diffusion Region from Four-Spacecraft Observations, Phys. Rev. Lett., 93, 105001, doi: 10.1103/PhysRevLett.93.105001, 2004b.
Vaivads, A., Retin`o, A., and Andr´e, M.: Microphysics of Mag-netic Reconnection, Space Sci. Rev., 122, 19–27, doi:10.1007/ s11214-006-7019-3, 2006.
Weimer, D. R., Ober, D. M., Maynard, N. C., Collier, M. R., McCo-mas, D. J., Ness, N. F., Smith, C. W., and Watermann, J.: Predict-ing interplanetary magnetic field (IMF) propagation delay times using the minimum variance technique, J. Geophys. Res. (Space Physics), 108, 1026, doi:10.1029/2002JA009405, 2003. Wygant, J. R., Cattell, C. A., Lysak, R., Song, Y., Dombeck, J.,
![Fig. 2. Cluster orbit on 4 January 2004, 12:30–14:30 UT. Duringthis time interval Cluster moved from [2.3 9.8 5.7] RE (GSM) to[3.7 11.2 5.7] RE (GSM)](https://thumb-us.123doks.com/thumbv2/123dok_us/8163716.250346/3.595.312.540.63.477/fig-cluster-orbit-january-duringthis-interval-cluster-moved.webp)