R E S E A R C H A R T I C L E
Open Access
The difference of T cell phenotypes in end
stage renal disease patients under different
dialysis modality
Jiao Xiaoyan
1,2,3†, Chen Rongyi
1,2,3†, Cao Xuesen
1,2,3, Zou Jianzhou
1,2,3,4, Ji Jun
1,2,3,4, Ding Xiaoqiang
1,2,3,4and
Yu Xiaofang
1,2,3,4*Abstract
Background:Impaired T cell immune function exists in end-stage renal disease (ESRD) patients. Dialysis treatment may lead to changes in T cell subsets. In the present study, we aimed to identify alterations of T cell phenotypes in ESRD patients, especially in those receiving peritoneal dialysis (PD), and analyze the potential associated factors. Methods:In the present study, 110 PD patients and 110 age/gender-matched hemodialysis (HD) patients who met the inclusion criteria were studied. Pre-dialysis blood samples were obtained and analyzed by flow cytometry to detect the expression of CD45RO and CCR7. Univariate and multivariate regression analyses were used to determine the factors associated with the alteration of T cell phenotypes.
Results:In all dialysis patients, age was associated with the frequencies of both CD4+ and CD8+ naïve T cells, effector memory (EM) T cells and effector memory RA (EMRA) T cells but not central memory (CM) T cells. Dialysis modality was also associated with T cell subsets. Compared with HD patients, PD patients showed an increase in both CD4+ and CD8+ CM T cells and a reduction in both CD4+ and CD8+ EM and EMRA T cells. However, the number of CD4+ naïve T cells was lower and the number of CD8+ naïve T cells was higher in PD patients than those in HD patients. In PD patients, further multivariate analysis revealed that the frequency of CD4+ naïve T cells was positively associated with nPCR, while the frequency of CD8+ naïve T cells was negatively associated with age.
Conclusion:In dialysis patients, the dialysis modality and age influence T cell subsets. There is a progression from naïve to effector T cells in HD patients compared with PD patients. In PD patients, different factors may influence the frequencies of CD4+ and CD8+ naïve T cells.
Keywords:End-stage renal disease, Peritoneal dialysis, Hemodialysis, T cell phenotypes
Background
End-stage renal disease (ESRD) is associated with immune dysfunction, characterized as systemic inflammation and immune deficiency [1, 2]. The immunological abnorma-lities increased the risk of cardiovascular disease (CVD) and susceptibility to infection and cancer, accounting for high morbidity and mortality in patients with ESRD [3,4].
T cells, the major mediator of adaptive immunity, can be classified according to the surface markers (CD45RO
and CCR7) into four subsets: naïve, central memory (CM), effector memory (EM) and effector memory RA (EMRA) T cells [5]. Upon antigen stimulation, naïve T cells expand and differentiate into long-lived memory T lymphocytes and shorted-lived effector T lymphocytes. The long-lived CM T cells can rapidly expand in response to secondary challenge, whereas effector T cells exert specific functions [5,6].
In ESRD patients, T-cell mediated immune dysfunc-tion results from an inverted CD4+/CD8+ ratio, marked loss of naïve T cells and accumulation of differentiated T cells [7–9]. With the loss of renal function, the abun-dance of naïve T cells decreases [8,10]. The reduction in the number of naïve T cells leads to an inadequate
© The Author(s). 2019Open AccessThis article is distributed under the terms of the Creative Commons Attribution 4.0 International License (http://creativecommons.org/licenses/by/4.0/), which permits unrestricted use, distribution, and reproduction in any medium, provided you give appropriate credit to the original author(s) and the source, provide a link to the Creative Commons license, and indicate if changes were made. The Creative Commons Public Domain Dedication waiver (http://creativecommons.org/publicdomain/zero/1.0/) applies to the data made available in this article, unless otherwise stated.
* Correspondence:yu.xiaofang@zs-hospital.sh.cn
†Jiao Xiaoyan and Chen Rongyi contributed equally to this work. 1Department of Nephrology, Zhongshan Hospital, Fudan University, NO180,
Feng’lin Road, Shanghai 200032, China
2Shanghai Medical Center for Kidney, Shanghai, China
immune response to antigen [11, 12]. Hemodialysis (HD) and peritoneal dialysis (PD) have different effects on CD4+ T cell phenotypes and proliferation parame-ters [13]. However, the effect of dialysis modality, particularly the effect of PD on T cell subsets, has not been fully discussed.
Therefore, we hypothesized that T cell phenotypes could be influenced by different dialysis modalities. We also investigated the factors associated with the frequency of naïve T cells in PD patients.
Methods Patients
In the present study, ESRD patients with stable dialysis for at least 3 months were recruited from January 1, 2016 to June 30, 2017. The patients with malignancy, acute and chronic infection (including the infection of common bacteria, hepatitis B virus, hepatitis C virus and human immunodeficiency virus), kidney transplantation, and use of immunosuppressive drugs within the past 3 months were excluded.
The 110 enrolled PD patients, aged between 18 and 85 years old, were treated on standard continuous ambu-latory peritoneal dialysis (CAPD) with glucose-based PDF (Dianeal®; Baxter). For every PD patient, one age-and gender-matched HD patient was included. All HD patients were undergoing dialysis for at least 4 h thrice weekly. Hemodialysis was performed with standard dialysate by low-flux dialyzers. All patients remained on the initial dialysis modality.
The study and protocol were reviewed and approved by the Medical Ethics Committee of Zhongshan Hospital, Fudan University.
Preparation of cells
Fasting blood samples were obtained from a peripheral vein before dialysis. Subsequently, the whole blood sam-ples were lysed by red blood cell lysis solution (10 mM KHCO3, 155 mM NH4Cl from Sangon Biotech, and 0.1 mM EDTA from Sigma-Aldrich, pH =7.2). After washing twice, the cells were resuspended with staining buffer (PBS containing 0.2% FBS from Invitrogen and 0.09% NaN3 from Sigma-Aldrich).
Flow cytometry analysis
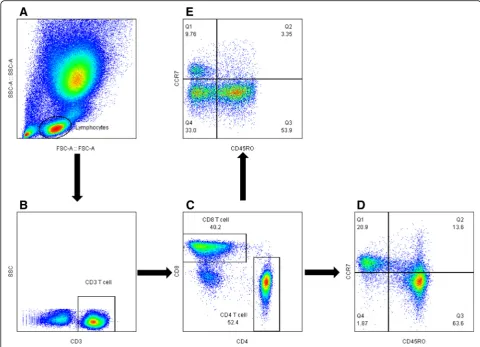
Peripheral blood cells in staining buffer were stained for 30 min at 4 °C and T lymphocytes was determined by staining of CD3-PE (Bio-Legend, San Diego, CA, USA) and CD4-APC or CD8a-PerCP/Cy5.5 (eBioscience, San Diego, CA, USA). FITC-labeled anti-CD45RO (Miltenyi Biotec, Bergisch Gladbach, Germany), and APC/Cy7-la-beled anti-CCR7 (BioLegend) was used to identify the differentiation of T lymphocytes. The data were analyzed with a BD LSRFortessa™flow cytometer (BD Bioscience,
San Jose, CA, USA). Flow cytometry was used to assess markers of T cell subsets (Fig. 1). The surface markers CCR7 and CD45RO were used to classify the T cells into subsets: (1) naïve cells (CD45RO-, CCR7+); (2) central memory cells (CD45RO+, CCR7+); (3) effector memory cells (CD45RO+, CCR7-); and (4) effector memory RA cells (CD45RO-, CCR7-).
Data analysis and statistics
The normally distributed variables were expressed as the means ± standard deviation. Skewed variables are shown as the median and interquartile range (IQR). Comparisons were performed by Student’s t test or the Mann–Whitney U test according to the normality of data. Pearson or Spear-man’s correlation analysis was performed to explore the related factors for T cell subsets. Univariate and multivari-ate regression models were constructed to determine the associations between variables. All analyses were performed with SPSS (Chicago, IL, USA), version 23.0. The statistical significance level was set to 0.05 in 2-tailed testing.
Results
Characteristics of patients
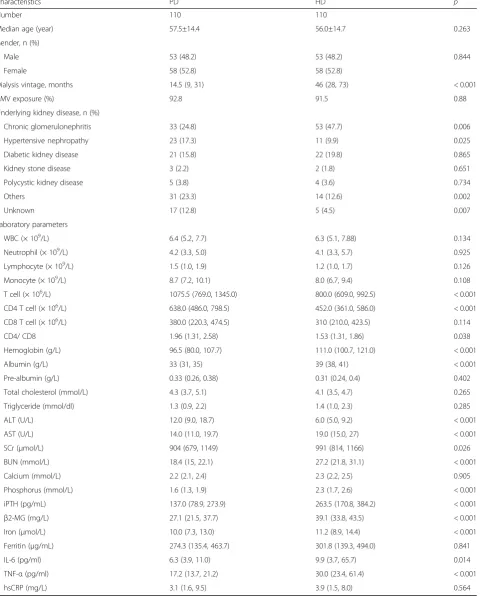
Demographic and clinical characteristics are summarized in Table 1. Dialysis vintage of HD patients was signifi-cantly longer than that of PD patients (p < 0.001). The underlying kidney diseases of PD patients were chronic glomerulonephritis (24.8%), hypertensive nephropathy (17.3%) and diabetic kidney disease (15.8%), whereas the major cause in HD patients was glomerulonephritis (47.4%), followed by diabetic kidney disease (19.8%) and hypertensive nephropathy (9.9%).
Considering the dialysis treatment adequacy, total Kt/ V in PD patients was 1.82 (1.52, 2.31) while that in HD patients was 1.23 (1.1, 1.38). In PD patients, serum creatinine and blood urea nitrogen were lower than those in HD group. The serum levels of hemoglobin, albumin,β2-MG, AST, as well as phosphorus, iPTH and iron were significantly lower in PD patients than those observed in HD patients. However, serum TC, TG, calcium concentrations were similar between the two groups. PD patients showed a marked reduction of IL-6 and TNF-α in comparison to HD patients. hsCRP, ferritin level and the prevalence of cytomegalovirus infection (determined by detecting anti-CMV IgM and IgG antibodies in serum), did not differ significantly between PD and HD patients.
Associations of age and dialysis modality with T cell subsets
To identify the factors that interact with T cell subsets in dialysis patients, a univariate general linear model was used to analyze the associations of age, gender, CVD, dia-betes, dialysis modality, dialysis vintage and residual renal function (anuria) with the frequencies of T cells in the entire study population. As shown in Table2, there was a significant interaction of age with the frequencies of naïve, EM and EMRA cells, but not CM T cells, among both CD4+ and CD8+ T cells. Dialysis modality was also signifi-cantly associated with the percentage of all the T cell subsets. However, T cell subsets were not affected by gen-der, CVD, diabetes, dialysis vintage or anuria.
T cell subsets in hemodialysis and peritoneal dialysis patients
Compared with HD patients, PD patients had a higher percentage of CD4+ CM T cells and a lower percentage
of CD4+ naïve, EMRA and TEMRA T cells. In terms of CD8+ T cells, there was a similar distribution of higher CM and lower EMRA and TEMRA T cells in PD patients. However, the number of CD8+ naïve T cells in PD patients was higher than that in HD patients (Table3).
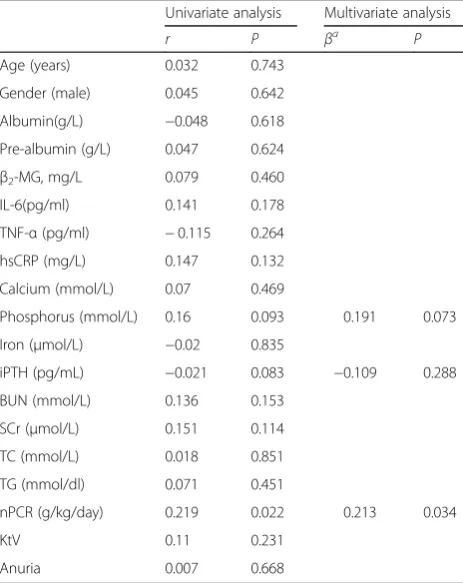
Factors associated with naïve T cells in the PD group Considering the different distributions of CD4+ and CD8+ naïve T cells in PD patients, we further explored factors that influence naïve T cells in PD patients.
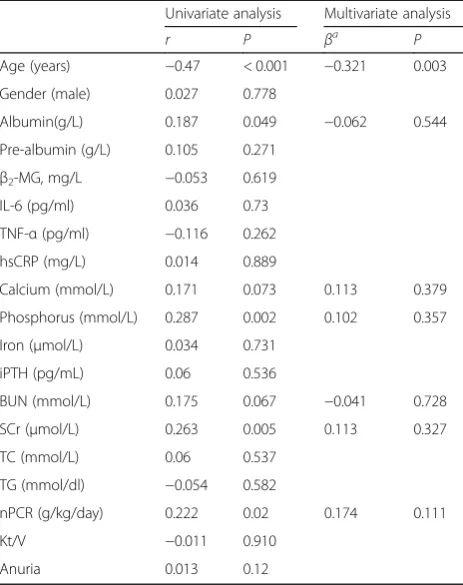
In the univariate regression analysis, the nPCR was significantly positively associated with the frequency of CD4+ naïve T cells (Table 4). The frequency of CD8+ naïve T cells was negatively associated with age and posi-tively associated with the serum albumin level, the nPCR, the serum phosphorus level, the serum calcium level, BUN and the SCr level (Table5).
Table 1Baseline characteristics of peritoneal dialysis patients and hemodialysis patients
Characteristics PD HD p
Number 110 110
Median age (year) 57.5±14.4 56.0±14.7 0.263 Gender, n (%)
Male 53 (48.2) 53 (48.2) 0.844
Female 58 (52.8) 58 (52.8)
Dialysis vintage, months 14.5 (9, 31) 46 (28, 73) < 0.001
CMV exposure (%) 92.8 91.5 0.88
Underlying kidney disease, n (%)
Chronic glomerulonephritis 33 (24.8) 53 (47.7) 0.006 Hypertensive nephropathy 23 (17.3) 11 (9.9) 0.025 Diabetic kidney disease 21 (15.8) 22 (19.8) 0.865 Kidney stone disease 3 (2.2) 2 (1.8) 0.651 Polycystic kidney disease 5 (3.8) 4 (3.6) 0.734 Others 31 (23.3) 14 (12.6) 0.002
Unknown 17 (12.8) 5 (4.5) 0.007
Laboratory parameters WBC (× 109
/L) 6.4 (5.2, 7.7) 6.3 (5.1, 7.88) 0.134 Neutrophil (× 109/L) 4.2 (3.3, 5.0) 4.1 (3.3, 5.7) 0.925 Lymphocyte (× 109/L) 1.5 (1.0, 1.9) 1.2 (1.0, 1.7) 0.126 Monocyte (× 109/L) 8.7 (7.2, 10.1) 8.0 (6.7, 9.4) 0.108 T cell (× 106/L) 1075.5 (769.0, 1345.0) 800.0 (609.0, 992.5) < 0.001 CD4 T cell (× 106/L) 638.0 (486.0, 798.5) 452.0 (361.0, 586.0) < 0.001 CD8 T cell (× 106/L) 380.0 (220.3, 474.5) 310 (210.0, 423.5) 0.114 CD4/ CD8 1.96 (1.31, 2.58) 1.53 (1.31, 1.86) 0.038 Hemoglobin (g/L) 96.5 (80.0, 107.7) 111.0 (100.7, 121.0) < 0.001 Albumin (g/L) 33 (31, 35) 39 (38, 41) < 0.001 Pre-albumin (g/L) 0.33 (0.26, 0.38) 0.31 (0.24, 0.4) 0.402 Total cholesterol (mmol/L) 4.3 (3.7, 5.1) 4.1 (3.5, 4.7) 0.265 Triglyceride (mmol/dl) 1.3 (0.9, 2.2) 1.4 (1.0, 2.3) 0.285 ALT (U/L) 12.0 (9.0, 18.7) 6.0 (5.0, 9.2) < 0.001 AST (U/L) 14.0 (11.0, 19.7) 19.0 (15.0, 27) < 0.001 SCr (μmol/L) 904 (679, 1149) 991 (814, 1166) 0.026 BUN (mmol/L) 18.4 (15, 22.1) 27.2 (21.8, 31.1) < 0.001 Calcium (mmol/L) 2.2 (2.1, 2.4) 2.3 (2.2, 2.5) 0.905 Phosphorus (mmol/L) 1.6 (1.3, 1.9) 2.3 (1.7, 2.6) < 0.001 iPTH (pg/mL) 137.0 (78.9, 273.9) 263.5 (170.8, 384.2) < 0.001
β2-MG (mg/L) 27.1 (21.5, 37.7) 39.1 (33.8, 43.5) < 0.001 Iron (μmol/L) 10.0 (7.3, 13.0) 11.2 (8.9, 14.4) < 0.001 Ferritin (μg/mL) 274.3 (135.4, 463.7) 301.8 (139.3, 494.0) 0.841 IL-6 (pg/ml) 6.3 (3.9, 11.0) 9.9 (3.7, 65.7) 0.014 TNF-α(pg/ml) 17.2 (13.7, 21.2) 30.0 (23.4, 61.4) < 0.001 hsCRP (mg/L) 3.1 (1.6, 9.5) 3.9 (1.5, 8.0) 0.564
Further multiple stepwise regression analyses indicated that the nPCR positively influenced the frequency of CD4+ naïve T cells (Table 4), while age was a negative independent factor influencing the frequency of CD8+ naïve T cells in PD patients (Table5).
Discussion
In the present study, we demonstrated that T cell sub-sets alteration were influenced by age and dialysis mo-dality. T cell subsets in HD patients showed a more tendency to progress from naïve to effector cells than that in PD patients. Lower nPCR in PD patients con-tributed to the reduced frequency of CD4+ naïve T cells, while age was negatively associated with the frequency of CD8+ naïve T cells.
T cells alteration and dysfunction was associated with the progression of chronic kidney disease (CKD) [14]. The accumulation of uremic toxin and presence of inflammation milieu in ESRD patients accelerated the T cell premature aging, which was characterized as the reduction of naïve T cell but increased proportion of
EMRA T cell [10, 15]. Considering the difference of inflammation milieu between HD and PD patients, their impact on the distribution of T cell phenotype has not been fully demonstrated. In the present study, we found that the dialysis modality was an important factor that influenced the proportion of T cells subsets. Consistent with other studies [8, 16], age was associated with
Table 2Factors associated with T cell subsets in ESRD patients
Age Gender CVD DM Dialysis modality Dialysis vintage Anuria R2 CD4 + T Cell
Naïve CD4,% 0.027 0.732 0.584 0.382 0.002 0.987 0.884 0.060 CM CD4,% 0.858 0.091 0.505 0.674 < 0.001 0.199 0.141 0.311 EM CD4,% 0.001 0.099 0.935 0.155 < 0.001 0.153 0.286 0.157 EMRA CD4,% 0.023 0.124 0.951 0.993 < 0.001 0.848 0.451 0.092 CD8+ T Cell
Naïve CD8,% < 0.001 0.171 0.674 0.924 < 0.001 0.937 0.178 0.378 CM CD8,% 0.993 0.998 0.987 0.997 < 0.001 0.160 0.074 0.180 EM CD8,% < 0.001 0.069 0.240 0.987 < 0.001 0.813 0.129 0.135 EMRA CD8,% < 0.001 0.603 0.144 0.592 < 0.001 0.252 0.268 0.264
CVDCardiovascular disease,DMDiabetes mellitus,CMCentral memory,EMEffector memory,EMRAEffector memory RA
Table 3Comparison of T cell subsets between PD and HD patients
T Cell Subsets PD(n= 110) HD(n = 110) p CD4+ T Cell
Naïve CD4, % 28.1(19.2, 41.3) 35.3(26.1, 46.8) 0.001 CM CD4, % 36.4(25.9, 51.3) 19.2(14.1, 26.2) < 0.001 EM CD4, % 25.7(15.9, 33.6) 34.4(27.4, 45.2) < 0.001 EMRA CD4, % 2.5(1.4, 4.9) 4.6(2.9, 8.8) < 0.001 CD8+ T Cell
Naïve CD8, % 40.2(19.6, 52.9) 21.4(13.0, 31.7) < 0.001 CM CD8, % 6.3(2.8, 12.6) 2.4(1.5, 3.9) < 0.001 EM CD8, % 31.9(17.9, 49.1) 50.7(37.7, 60.1) < 0.001 EMRA CD8, % 14.2(8.4, 24.6) 20.5(13.9, 29.4) < 0.001
CMCentral memory,EMEffector memory,EMRAEffector memory RA
Table 4Regression analysis for CD4+ naïve T cells in PD patients
Univariate analysis Multivariate analysis
r P βa P
Age (years) 0.032 0.743 Gender (male) 0.045 0.642 Albumin(g/L) −0.048 0.618 Pre-albumin (g/L) 0.047 0.624
β2-MG, mg/L 0.079 0.460
IL-6(pg/ml) 0.141 0.178 TNF-α(pg/ml) −0.115 0.264 hsCRP (mg/L) 0.147 0.132 Calcium (mmol/L) 0.07 0.469
Phosphorus (mmol/L) 0.16 0.093 0.191 0.073 Iron (μmol/L) −0.02 0.835
iPTH (pg/mL) −0.021 0.083 −0.109 0.288 BUN (mmol/L) 0.136 0.153
SCr (μmol/L) 0.151 0.114 TC (mmol/L) 0.018 0.851 TG (mmol/dl) 0.071 0.451
nPCR (g/kg/day) 0.219 0.022 0.213 0.034 KtV 0.11 0.231
Anuria 0.007 0.668
β2-MGβ2-microglobin,hsCRPhigh-sensitive C-reactive protein,SCrSerum creatinine,BUNBlood urine nitrogen,iPTHParathyroid hormone,BUNBlood urea nitrogen,SCrSerum creatinine,TCTotal cholesterol,TGTriglyceride,nPCR
normalized protein catabolic rate
a
alteration of T cell subsets in dialysis patients. We found the dialysis vintage and anuria were not related with the proportion of T cell subsets. Besides, as common complica-tions or comorbidities in dialysis patients, DM and CVD also had no association with T cell subsets in our study.
The altered differentiation of T cells from naïve to effector T cells could occur with aging or cytomegalovirus infection [17, 18]. However, dialysis treatment may also prompt this alteration through decreasing the ability of T cell proliferation, exacerbating T cell apoptosis and reducing thymic output [7, 13,19]. This alteration of T cell subsets may contribute to the attenuated response to antigen and increasing the risk of CVD in ESRD patients [11,20,21].
In the present study, a lower frequency of effector cells and a higher frequency of CM cells among both CD4+ and CD8+ T cells were found in PD patients than in HD patients. Thus, T cells were prone to a differentiated type in HD patients compared with PD patients. Besides, we found that HD patients had higher levels of inflamma-tory markers (such as IL-6 and TNF-a) and more serious azotemia than PD patients, so it is plausible that the dif-ference of T cell phenotypes may be influenced by the altered microenvironment in HD and PD patients. Although it has been suggested that the improvement of
inflammation status in ESRD patients by kidney trans-plantation could not change T cell subsets [22], the patients in that study included induction therapy via immunosuppression, which contributed to the exhaus-tion of T cells with replicative senescence [16].
Naïve T cells play key roles in maintaining the adaptive immunity function, and its loss would lead to a poor vac-cine response and susceptibility to infection [23, 24]. Thus, the maintenance of naïve T cells may be pivotal in ESRD patients. With respect to naïve T cells in PD patients, the alteration was not consistent: the lower in CD4+ and higher in CD8+, compared with those in HD patients. It is reported that iron overload was associated with increased risks for death, infection and CVD [25,26]. Ferritin level, an indicator of iron store and systemic inflammation, was also found to be negatively related to monocyte telomere length, but did not influence the T cell subsets frequency in HD patients [20]. Although the serum hemoglobin level in HD patients was higher than PD patients in our study, we did not find significant differ-ence of serum ferritin level between HD and PD patients (Table 1), so the iron status may not be the cause of the alteration of naïve T cell.
It has been reported that the number of CD4+ naïve T cells was maintained for up to 60 years and then drama-tically decreased in subsequent years with aging, owing to a reduction in homeostatic proliferation ability [27]. IL-7 may also prompt the expansion of CD4+ naïve T cells [28,29], while patients with CKD 5 stage usually has significantly lower serum IL-7 than healthy controls [10]. In the present study, we found that only decreased nPCR was independ-ently associated with reduced CD4+ naïve T cell subset in PD patients. Thus the diminished immune response, due to decreased proportion of CD4+ naïve T cells, may contribute to the risk of infection and mortality in PD patients. As to CD8+ naïve T cells, aging and dialysis therapy (either PD or HD) may influence the differences of CD8+ T cells in the previous studies [5,7]. In agreement with these studies, we also found that age was an independent factor negatively influencing CD8+ naïve T cells in PD patients.
In summary, age and dialysis modality were factors altering T cell subsets. Compared with HD, PD reduced the progression from naïve T cells to effector T cells. In PD patients, the frequency of CD4+ naïve T cells may be affected by nutrition status, while the frequency of CD8+ naïve T cells may only associate with age.
Conclusion
In summary, age and dialysis modality were factors alter-ing T cell subsets. Compared with HD, PD reduced the progression from naïve T cells to effector T cells. In PD patients, the frequency of CD4+ naïve T cells may be af-fected by nutrition status, while the frequency of CD8+ naïve T cells may only associate with age.
Table 5Regression analysis for CD8+ naïve T cells in PD patients
Univariate analysis Multivariate analysis
r P βa P
Age (years) −0.47 < 0.001 −0.321 0.003 Gender (male) 0.027 0.778
Albumin(g/L) 0.187 0.049 −0.062 0.544 Pre-albumin (g/L) 0.105 0.271
β2-MG, mg/L −0.053 0.619
IL-6 (pg/ml) 0.036 0.73 TNF-α(pg/ml) −0.116 0.262 hsCRP (mg/L) 0.014 0.889
Calcium (mmol/L) 0.171 0.073 0.113 0.379 Phosphorus (mmol/L) 0.287 0.002 0.102 0.357 Iron (μmol/L) 0.034 0.731
iPTH (pg/mL) 0.06 0.536
BUN (mmol/L) 0.175 0.067 −0.041 0.728 SCr (μmol/L) 0.263 0.005 0.113 0.327 TC (mmol/L) 0.06 0.537
TG (mmol/dl) −0.054 0.582
nPCR (g/kg/day) 0.222 0.02 0.174 0.111 Kt/V −0.011 0.910
Anuria 0.013 0.12
β2-MGβ2-microglobin,hsCRPhigh-sensitive C-reactive protein,SCrSerum creatinine,BUNBlood urine nitrogen,iPTHParathyroid hormone,TCTotal cholesterol,TGTriglyceride,nPCRnormalized protein catabolic rate
a
In the backward stepwise multiple regression model, AdjustedR2
Abbreviations
ALT:Alanine aminotransferase; AST: Aspartate aminotransferase; BUN: Blood urine nitrogen; CAPD: Continuous ambulatory peritoneal dialysis; CKD: Chronic kidney disease; CM: Central memory; EM: Effector memory; EMRA: Effector memory RA; ESRD: End-stage renal disease; HD: Hemodialysis; hsCRP: high-sensitive C-reactive protein; iPTH: Parathyroid hormone; PD: Peritoneal dialysis; SCr: Serum creatinine; WBC: White blood cells;β 2-MG:β2-microglobin
Acknowledgments
The authors wish to appreciate the assistance of all participants.
This work was supported by the grants from National Natural Science Funds of China (No. 81570600) and Shanghai Top Young Talents Program.
Authors’contributions
JXY analyzed the data and drafted the paper; YXF and JJ made the diagnosis and designed the experiments; DXQ, JJ and YXF revised the manuscript; CXS, JXY and CRY collected the data. All authors read and approved the final manuscript.
Funding
This work was supported by the grants from National Natural Science Funds of China (No. 81570600) and Shanghai Top Young Talents Program. These funders are non-profit government institution to prompt research.
Availability of data and materials
The datasets supporting the current study are available from the corresponding author on reasonable request.
Ethics approval and consent to participate
The study and protocol were reviewed and approved by the Medical Ethics Committee of Zhongshan Hospital, Fudan University. Written informed consent have been obtained from participants. The study complies with the Declaration of Helsinki.
Consent for publication Not applicable.
Competing interests
The authors declare that they have no competing interests.
Author details
1Department of Nephrology, Zhongshan Hospital, Fudan University, NO180,
Feng’lin Road, Shanghai 200032, China.2Shanghai Medical Center for Kidney,
Shanghai, China.3Shanghai Key Laboratory of Kidney and Blood Purification,
Shanghai, China.4Shanghai Institute of Kidney and Dialysis, Shanghai, China. Received: 13 May 2018 Accepted: 19 July 2019
References
1. Betjes MG, Meijers RW, Litjens NH. Loss of renal function causes premature aging of the immune system. Blood Purif. 2013;36(3–4):173–8.
2. Vaziri ND, Pahl MV, Crum A, Norris K. Effect of uremia on structure and function of immune system. J Ren Nutr. 2012;22(1):149–56.
3. Cheung CY, Chan GCW, Chan SK, Ng F, Lam MF, Wong SSH, et al. Cancer incidence and mortality in chronic Dialysis population: a multicenter cohort study. Am J Nephrol. 2016;43(3):153–9.
4. Mathew R, Mason D, Kennedy JS. Vaccination issues in patients with chronic kidney disease. Expert Rev Vaccines. 2014;13(2):285–98.
5. Appay V, van Lier RA, Sallusto F, Roederer M. Phenotype and function of human T lymphocyte subsets: consensus and issues. Cytometry A. 2008;73(11):975–83.
6. Sallusto F, Lenig D, Forster R, Lipp M, Lanzavecchia A. Two subsets of memory T lymphocytes with distinct homing potentials and effector functions. Nature. 1999;401(6754):708–12.
7. Meijers RW, Litjens NH, de Wit EA, Langerak AW, van der Spek A, Baan CC, et al. Uremia causes premature ageing of the T cell compartment in end-stage renal disease patients. Immun Ageing. 2012;9(1):19.
8. Yoon JW, Gollapudi S, Pahl MV, Vaziri ND. Naive and central memory T-cell lymphopenia in end-stage renal disease. Kidney Int. 2006;70(2):371–6.
9. Betjes MG, Huisman M, Weimar W, Litjens NH. Expansion of cytolytic CD4+ CD28- T cells in end-stage renal disease. Kidney Int. 2008;74(6):760–7. 10. Litjens NH, van Druningen CJ, Betjes MG. Progressive loss of renal function
is associated with activation and depletion of naive T lymphocytes. Clin Immunol. 2006;118(1):83–91.
11. Litjens NH, Huisman M, van den Dorpel M, Betjes MG. Impaired immune responses and antigen-specific memory CD4+ T cells in hemodialysis patients. J Am Soc Nephrol. 2008;19(8):1483–90.
12. Effros RB. Role of T lymphocyte replicative senescence in vaccine efficacy. Vaccine. 2007;25(4):599–604.
13. Lisowska KA, Debska-Slizien A, Jasiulewicz A, Heleniak Z, Bryl E, Witkowski JM. Hemodialysis affects phenotype and proliferation of CD4-positive T lymphocytes. J Clin Immunol. 2012;32(1):189–200.
14. Crepin T, Legendre M, Carron C, Vachey C, Courivaud C, Rebibou JM, et al. Uraemia-induced immune senescence and clinical outcomes in chronic kidney disease patients. Nephrol Dial Transplant; 2018.
15. Chung BH, Kim KW, Sun IO, Choi SR, Park HS, Jeon EJ, et al. Increased interleukin-17 producing effector memory T cells in the end-stage renal disease patients. Immunol Lett. 2012;141(2):181–9.
16. George RP, Mehta AK, Perez SD, Winterberg P, Cheeseman J, Johnson B, et al. Premature T cell senescence in pediatric CKD. J Am Soc Nephrol. 2017;28(1):359–67.
17. Wertheimer AM, Bennett MS, Park B, Uhrlaub JL, Martinez C, Pulko V, et al. Aging and cytomegalovirus infection differentially and jointly affect distinct circulating T cell subsets in humans. J Immunol. 2014;192(5):2143–55. 18. Litjens NH, de Wit EA, Betjes MG. Differential effects of age,
cytomegalovirus-seropositivity and end-stage renal disease (ESRD) on circulating T lymphocyte subsets. Immun Ageing. 2011;8(1):2.
19. Meier P, Dayer E, Blanc E, Wauters JP. Early T cell activation correlates with expression of apoptosis markers in patients with end-stage renal disease. J Am Soc Nephrol. 2002;13(1):204–12.
20. Ducloux D, Legendre M, Bamoulid J, Rebibou JM, Saas P, Courivaud C, et al. ESRD-associated immune phenotype depends on dialysis modality and iron status: clinical implications. Immun Ageing. 2018;15:16.
21. Betjes MG, de Wit EE, Weimar W, Litjens NH. Circulating
pro-inflammatory CD4posCD28null T cells are independently associated with cardiovascular disease in ESRD patients. Nephrol Dial Transplant. 2010; 25(11):3640–6.
22. Meijers RWJ, Litjens NHR, de Wit EA, Langerak AW, Baan CC, Betjes MGH. Uremia-associated immunological aging is stably imprinted in the T-cell system and not reversed by kidney transplantation. Transpl Int. 2014;27(12):1272–84.
23. Cicin-Sain L, Smyk-Pearson S, Currier N, Byrd L, Koudelka C, Robinson T, et al. Loss of naive T cells and repertoire constriction predict poor response to vaccination in old primates. J Immunol. 2010;184(12):6739–45.
24. Ahmed M, Lanzer KG, Yager EJ, Adams PS, Johnson LL, Blackman MA. Clonal expansions and loss of receptor diversity in the naive CD8 T cell repertoire of aged mice. J Immunol. 2009;182(2):784–92.
25. Kuragano T, Matsumura O, Matsuda A, Hara T, Kiyomoto H, Murata T, et al. Association between hemoglobin variability, serum ferritin levels, and adverse events/mortality in maintenance hemodialysis patients. Kidney Int. 2014;86(4):845–54.
26. Ruiz-Jaramillo Mde L, Guizar-Mendoza JM, Amador-Licona N, Gutierrez-Navarro Mde J, Hernandez-Gonzalez MA, Dubey-Ortega LA, et al. Iron overload as cardiovascular risk factor in children and adolescents with renal disease. Nephrol Dial Transplant. 2011;26(10):3268–73.
27. Naylor K, Li G, Vallejo AN, Lee WW, Koetz K, Bryl E, et al. The influence of age on T cell generation and TCR diversity. J Immunol. 2005;174(11):7446–52. 28. Goronzy JJ, Fang F, Cavanagh MM, Qi Q, Weyand CM. Naive T cell
maintenance and function in human aging. J Immunol. 2015;194(9):4073–80. 29. Sportes C, Hakim FT, Memon SA, Zhang H, Chua KS, Brown MR, et al.
Administration of rhIL-7 in humans increases in vivo TCR repertoire diversity by preferential expansion of naive T cell subsets. J Exp Med. 2008;205(7):1701–14.
Publisher’s Note