R E S E A R C H
Open Access
The overlapping continuum of host range
among strains in the
Pseudomonas syringae
complex
Cindy E. Morris
1*, Jay Ram Lamichhane
1,2, Ivan Nikoli
ć
3, Slavi
š
a Stankovi
ć
3and Benoit Moury
1Abstract
Pseudomonas syringaeis the most frequently emerging group of plant pathogenic bacteria. Because this bacterium is ubiquitous as an epiphyte and on various substrates in non-agricultural settings, there are many questions about how to assess the risk for plant disease posed by strains in the environment. AlthoughP. syringaeis considered to have discrete host ranges in defined pathovars, there have been few reports of comprehensive comparisons of host range potential. Here we present results of host range tests for 134 strains, representing eight phylogroups, from epidemics and environmental reservoirs on 15 to 22 plant species per test conducted in four separate tests to determine the patterns and extent of host range. We sought to identify trends that are indicative of distinct pathotypes and to assess if strains in theP. syringaecomplex are indeed restricted in their host range. We show that for each test, strains display a diversity of host ranges from very restricted to very broad regardless of the gamut of phylogroups used in the test. Overall, strains form an overlapping continuum of host range potential with equal representation of narrow, moderate and broad host ranges. Groups of distinct pathotypes, including strains with currently the same pathovar name, could not be identified. The absence of groupings was validated with statistical tests for pattern recognition. The extent of host range was positively correlated with the capacity of strains to swarm on semi-solid agar medium and with the abundance of genes in biosynthetic clusters and was inversely correlated with the abundance of genes for proteins with transmembrane domains in their genomes. Our results are consistent with the current paradigm that disease symptoms are the result of multiple molecular interactions betweenP. syringaeand its plant host that are modulated by abiotic and biotic conditions. This leads us to propose that pathovar denominations do not correspond to the underlying biology ofP. syringae.A new concept of pathogenicity that accounts for the continuum of pathogenic potential inP. syringaewould open new perspectives to understand the evolution of pathogenicity in this bacterium and new insights to anticipate disease and to manage plant health.
Keywords:Emergence, Network analysis, Pathovar, Artificial inoculation, Swarming motility
Background
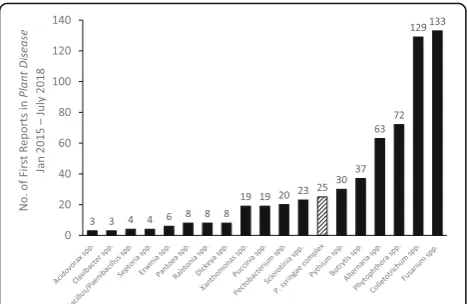
Bacteria in the Pseudomonas syringaecomplex regularly cause new disease epidemics of herbaceous and woody crops throughout the world (Lamichhane et al. 2014; Lamichhane et al.2015). According to“First Reports”of plant diseases published in the Plant Disease journal over ca. the past 3 years (Jan. 2015 to July 2018), reports of diseases caused by strains in the P. syringae complex are more frequent than those for diseases caused by any
other group of plant pathogenic bacteria and are more or equally frequent as those for certain fungi (Fig. 1). When new crop diseases occur, diagnosis can provide practical information useful for implementing efficient control measures in the current cropping season and in limiting future disease outbreaks. This includes informa-tion about capacity of the pathogen to adapt to climatic conditions, sensitivity to biocides and biocontrol agents, about its virulence on the range of available cultivars of the crop, and about potential reservoirs and sources of inoculum. This information facilitates decisions concern-ing the use of biocides, biocontrol agents, resistant varieties and cultural practices so as to avoid inoculum * Correspondence:[email protected]
1Plant Pathology Research Unit 407, PACA Research Center, INRA, Montfavet 84143, France
Full list of author information is available at the end of the article
and the favorable conditions for disease. For diseases caused by P. syringae, agronomic practices to avoid inoculum sources and the conditions that are favorable to disease are the most relied-upon means of control (Lamichhane et al. 2014; Lamichhane et al. 2015). Therefore, knowledge of traits relative to the aptitude to survive in various reservoirs or to spread to other crops is particularly pertinent for implementing preventive measures as well as for the spatial and temporal organization of crops in polyculture.
Among the numerous reports of disease emergence due to P. syringae, several suggest that the pathogen originated from epidemics on plant genera or species different from that on which emergence was reported. For example, the strains ofP. syringaecausing a new leaf spot on kale in California were considered to be a tomato pathogen (Koike et al. 2017). Tomato has been reported to be a common host of a range of pathovars of P. syringae that attack crucifers including strains called pv. maculicola, pv.appi and pv. antirrhini (Hendson et
al. 1992). Likewise, bristle oats planted as a green
ma-nure in fields cultivated to crucifers in Japan developed a brown spot disease caused by strains that were previ-ously described asP. syringaepv.alisalensis—pathogenic to crucifers (Ishiyama et al. 2013). Pathogenicity of P. syringaepv.alisalensisstrains to bristle oats and to other graminaceous crops and green manures such as oats and timothy has also been reported elsewhere (Cintas et al. 2002). Sugar beet has been observed to be a common host for various strains that cause disease to cucurbits (Morris et al.2000; Sedighian et al.2014) leading to sug-gestions that epidemics on beets are inoculum sources for cucurbits. For a blight of coffee seedlings that emerged in the state of São Paulo, Brazil in 2006, strains that caused the disease had PCR-RFLP profiles identical to those of the type strain of P. syringae pv. tabaci but
not of the known coffee pathogenP. syringaepv. garcae (Destéfano et al. 2010). In another example, emergence in Italy of bacterial blight on the ornamental tree White Bird of Paradise (Strelitzia augusta) was attributed to strains of P. s.pv.lachrymansand were also virulent on zucchini (Polizzi et al. 2005). Furthermore, for several diseases caused by P. syringae, the bacterial populations associated with epidemics are genetically very diverse and the strains are virulent on a range of plant species. Strains identified asP. syringae pv.pisithat cause blight on pea are genetically very diverse and have varying host ranges in laboratory tests. Furthermore, in these tests some of the most aggressive strains on pea were those closely related to strains from pea but that had been iso-lated from other diseased plants including lilac, common bean, hairy vetch and cantaloupe (Martin-Sanz et al.
2013). Several independent studies onP. syringae
caus-ing blights to cucurbits have revealed that there is a wide genetic diversity of strains from epidemics to cantaloupe, squash and watermelon and that the strains are virulent to numerous cucurbit species as well as to other herb-aceous plants (Morris et al. 2000; Sedighian et al.2014; Newberry et al. 2016). These examples raise questions about the extent of cross contaminations and spill over. Knowledge of the potential for spill over could guide agricultural practices to avoid reservoirs of inoculum.
Managing or avoiding reservoirs of P. syringaehas been complicated by accumulating data that this bacterium is present in various substrates that are nearby or that can come into contact with crops. These substrates include rainfall (Monteil et al. 2014), irrigation waters and their sources (Riffaud and Morris 2002; Monteil et al. 2013), symptomless weeds, wild plants and ground covers (Mal-vick and Moore1988; Hirano and Upper2000; Morris et
al.2008). The strains from these substrates had traits
com-mon to strains from diseased plants including a functional Type 3 Secretion System able to induce hypersensitivity in tobacco and the capacity to provoke disease symptoms on a range of plants in greenhouse tests. The prevalence of po-tentially pathogenic strains ofP. syringaein non-plant sub-strates such as irrigation waters or in symptomless weeds, wild plants and ground covers raises the obvious question of the risk they pose for crops. In the case of hazelnut can-ker, for example, wild relatives of cultivated hazelnut are thought to be the source of at least two distinct genetic lines ofP. syringaethat have caused damage to hazelnut or-chards (O'Brien et al. 2012). Likewise, all of the examples cited in the preceding paragraph suggest that green ma-nures, crops in rotation or nearby crops can also be sources of inoculum for disease.
Accounting for the breadth of host range of a patho-gen—viz. whether it is a specialist or is a generalist—is seen as one of the future challenges for modeling disease epi-demics (Cunniffe et al. 2015). In epidemiological models
the number of different hosts to which a pathogen causes disease influences the spatial density and distribution of the host landscape. Increasing host density increases the ease for a pathogen to be invasive (Madden and Van Den Bosch 2002). Hence, for a generalist there could be a greater effective density of susceptible host tissue avail-able—if the plants in its host range were cultivated at the same time—and therefore generalists would have a greater potential for invasion and emergence than would special-ists. Although the influence of host range on disease epi-demiology can be formalized mathematically, this influence is also reflected in age-old strategies to manage diseases caused by generalists (such as the soft rot enteric bacteria, for example) that rely mostly on avoidance and hygiene vs. those caused by obligate, host specific organisms (such as rust fungi) where deployment of resistant plant varieties can be very effective.
It is not well established to what extent strains ofP. syr-ingae are generalists or specialists. P. syringae has often been described as having a broad host range collectively for the species complex but that its individual genetic lines generally have a restricted host range (Sarkar et al. 2006; Lindeberg et al. 2009; Baltrus et al. 2011; Mucyn et al. 2014). This notion of restricted host range refers to the fact that there are few reports of the same strain being iso-lated from epidemics on different crop species. The pau-city of such reports might not necessarily be due solely to the inherent host range limitation of any particular strain. A likely contributing factor is the lack of efforts to com-pare the genomes of strains from new epidemics with that of strains in collections from previous epidemics. This possibility is technically feasible now, but this has not al-ways been the case. Another contributing factor could also be a hitherto lack of opportunity for encounters with cer-tain susceptible hosts under conducive conditions. The paucity of reports is probably also attributable to the ex-tensive diversity and ubiquity ofP. syringae. This bacterial group has a global metapopulation of at least 1022 cells and the number of different genetic lines is likely to be only a few orders of magnitude smaller than the total number of cells (Morris et al. 2010; Morris et al. 2013). These traits of the metapopulation have two consequences on disease etiology. Firstly they lead to the high genetic di-versity of strains that cause epidemics on a same host. Secondly they make it highly improbable that a same clone would be found in diverse situations. An exception would be the case where vegetative propagation of the host leads to widespread dissemination of a clonal line as in the case of kiwifruit canker. In spite of the many reports that characterize the pathogenicity ofP. syringae, compre-hensive evaluation of the host range potential ofP. syrin-gaestrains under comparable conditions is lacking.
The objective of this work is to assess the patterns in an ensemble of host range data that we have collected
forP. syringaeover the past decades in inoculation trials. We sought to identify trends that are indicative of dis-tinct pathotypes and to assess if strains in theP. syringae complex are indeed restricted in their host range. The data here represent four host range tests conducted in 1998 (test A), 2008 (test B), 2013 (test C) and 2017 (test D) for a collective total of 134 strains from epidemics and environmental reservoirs on 15 to 22 plant species per test.
Results
Variability of plant-bacterial interactions
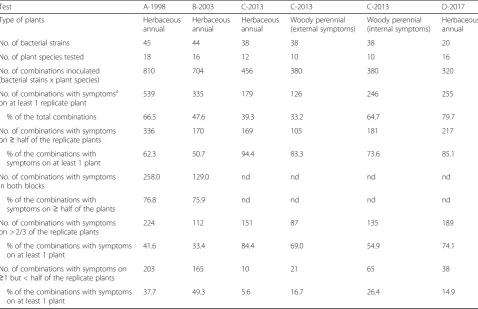
For all strains and plant species considered together, in-oculation of any given plant species frequently resulted in a reaction that could be considered as a disease symp-tom. For herbaceous plants, 40% to 80% of inoculations resulted in symptom expression and for woody plants 33% and 65% of the inoculations resulted in external or internal lesions, respectively, for at least one of the repli-cate plants, depending on the test (Table1). Inoculations that resulted in symptoms for only one of the replicate plants represented less than 17% of the inoculations for external symptoms for tests C and D and 26% of the in-oculations for internal symptoms on woody plants. For tests A and B, inoculations resulted in symptoms for only one replicate plant in up to 49% of the inoculations. The regularity of symptom expression depended on the test. In tests C and D, 74% to 94% of the inoculations that resulted in disease symptoms for at least one repli-cate plant also resulted in symptoms for at least half of the plants (Table 1). In tests A and B, 51% to 62% of symptom expression were cases where at least half of the plants had symptoms (Table1). Tests C and D were each conducted in a shorter period of time representing more homogenous environmental conditions in the greenhouse than tests A and B.
The host range of strain CC0094 was evaluated mul-tiple times: in test A as part of the initial determination of its host range, as a control strain in test D, and was part of four independent trials with the 16 different spe-cies deployed as a control in test B. In test B the patho-genicity of CC0094 was identical on 14 of the 16 plant species among the four independent trials and showed variable results on tomato (Solanum lycopersicum) and eggplant (S. melongena) (Table 2). When tests A, B and D were considered collectively, there were at least 17 plant species (not considering botanical variety or culti-var) where the host range of CC0094 was examined at least 2 times. The pathogenicity of CC0094 was identical for 11 of these species among the different tests.
onion, eggplant and pepper whereas in test B it also caused symptoms (≥3 of the 6 replicate plants) on 7 other species for which it did not consistently cause symptoms in test A suggesting that the conditions of test
B were more permissive for this strain. The
pathogenicity of B728A (from PG02) and of strains from PG01 (CC1544, KN10, MAFF302278, MAFF302280, USA0007), PG03 (MAFF301020, 0893_23) and PG04 (1448A, 1_6) were also evaluated in tests B and C for which five plant species were in common (sorghum, soy-bean, sunflower, cantaloupe and tomato). With the ex-ception of strain 1_6, all strains had a broader host range in test C than in test B. Overall, the mean host range of strains in PG01 and PG03 were broadest in test C. For PG02, the mean host range of strains was similar for tests A, B and C but greater for test D (Fig.2).
Host range patterns
Host range patterns were characterized in terms of the repeatable reactions (symptoms on at least half of the replicate plants) within each test. We observed that, within each test, the strains displayed a diversity of host ranges from very restricted to very broad regardless of
the gamut of phylogroups used in the test (Additional
file1: Figure S1). This diversity among strains occurred
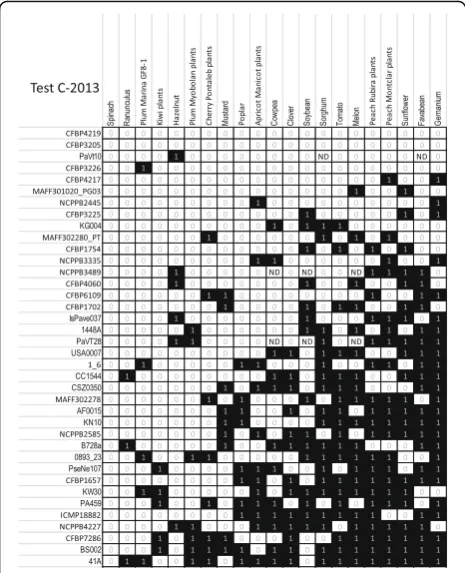
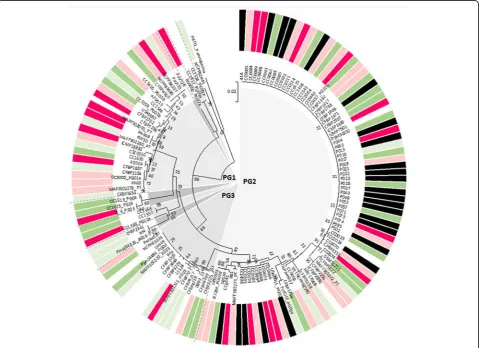
even for tests A and D where most of the strains within a test had been isolated from newly occurring disease epidemics on a same host (cantaloupe for test A and sugar beet for test D) (in Additional file1: Figure S1 all strains labeled “CC” in test A were from outbreaks of cantaloupe blight in France and those labeled“P”in test D were from outbreaks of sugar beet blight in Serbia). Furthermore, there were several examples of strains that had been attributed the same pathovar denomin-ation and were phylogenetically very close but that nevertheless had different host ranges from one an-other. For example, the three strains from reference collections that are called P. syringae pv. actinidiae (CFBP 7286, KW30 and PA459) induced symptoms on 11 to 12 different hosts but with only tomato, sun-flower, kiwi and two cultivars of peach in common (Fig.3 and Additional file2: Table S1, test C). Likewise the two strains named pv. savastanoi(NCPPB3335 and PseNe107) both caused symptoms on cowpea, gera-nium, apricot and Montclar peach but strain PseNe107 caused symptoms on six additional hosts. (Fig. 3 and Table 1Variability in the response of plants to inoculation with strains ofPseudomonas syringaefor each of the four tests and for woody and herbaceous plants
Test A-1998 B-2003 C-2013 C-2013 C-2013 D-2017
Type of plants Herbaceous
annual
Herbaceous annual
Herbaceous annual
Woody perennial (external symptoms)
Woody perennial (internal symptoms)
Herbaceous annual
No. of bacterial strains 45 44 38 38 38 20
No. of plant species tested 18 16 12 10 10 16
No. of combinations inoculated (bacterial stains x plant species)
810 704 456 380 380 320
No. of combinations with symptomsa on at least 1 replicate plant
539 335 179 126 246 255
% of the total combinations 66.5 47.6 39.3 33.2 64.7 79.7
No. of combinations with symptoms on≥half of the replicate plants
336 170 169 105 181 217
% of the combinations with symptoms on at least 1 plant
62.3 50.7 94.4 83.3 73.6 85.1
No. of combinations with symptoms in both blocks
258.0 129.0 nd nd nd nd
% of the combinations with symptoms on≥half of the plants
76.8 75.9 nd nd nd nd
No. of combinations with symptoms on > 2/3 of the replicate plants
224 112 151 87 135 189
% of the combinations with symptoms on at least 1 plant
41.6 33.4 84.4 69.0 54.9 74.1
No. of combinations with symptoms on
≥1 but < half of the replicate plants
203 165 10 21 65 38
% of the combinations with symptoms on at least 1 plant
37.7 49.3 5.6 16.7 26.4 14.9
a
Additional file 2: Table S1, test C). The two strains named pv.aptata (CFBP1617 and CFBP1906) also had different host ranges, with eight hosts in common in addition to sugar beet but with six additional hosts for CFBP1906 (Additional file2: Table S1, test A).
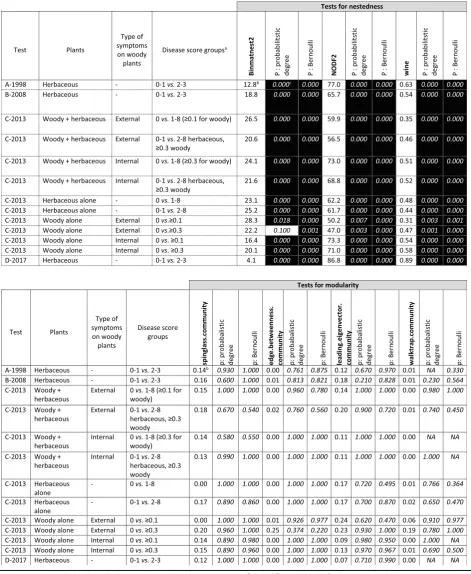
In none of the tests the host range showed patterns that revealed groups of strains with distinct, well-defined host ranges. Strikingly, in all tests, host ranges were overlapping and could be arranged into patterns that appeared nested (Fig. 3 for test C, Additional file 1: Figure S1 for the others). The three statistics for nestedness (overlapping host ranges) and the four statistics for modularity (distin-guishable groups with defined host ranges) calculated here showed that the host range patterns in all four tests were significantly nested and showed no detectable modules (Table 3). For test C we assessed the effect of different thresholds of regularity and intensity of symptom expression on the host range pattern for all plant species considered together and for herbaceous and woody species considered independently (Table3). None of the different thresholds resulted in significant modularity and all re-sulted in significant nestedness of host range patterns.
Relationship between the extent of host range, phylogeny, general genomic features and motility The outcomes of host range tests conducted under la-boratory conditions are contingent on numerous factors that can modulate the success of microorganisms in
Fig. 2Extent of host range of phylogroups 1 (red), 2 (blue) and 3 (green) ofP. syringae, expressed as the percent of plant species for which at least half of the inoculated replicate plants manifest symptoms in each of four independent tests. Error bars indicate standard error of mean percents
Table 2Number of replicate plants with symptoms in different inoculation trials with strain CC0094
A-1998a B-2003a B-2003 B-2003 B-2003 D-2017b
Plant species Cultivar trial: 1 2 3 4
Allium cepa Jaune Paille 6 6 6 6 6 5
Beta vulgarisvar.cicla Verte à carde blanche sel Bressane
5
B. vulgarisvar.conditiva White Silver 5
B. vulgarisvar.rapa Ardan XS 1389 6 6 6 6
B. vulgarisvar.rapa Sucrière 6 0
Capsicum annuum Yolo Wonder 6 6 6 6 6 5
Cucumis melovar.cantalupensis Védrantais 11 6 6 6 6 4
C. sativus Marketer 3 5 6 6 6 4
Glycine max Paoki 2 6 5 5 4
Helianthus annuus Dogo 5 6 6 6 6
Hordeum vulgare Baronesse 1 3 6 4 5
Lactuca sativa Mantila 3 6 6 6 6 5
Phaseolus vulgaris Canadian Wonder 5 6 6 6 3
Pisum sativum Douce Provence 6 6 6 6 6 3
Solanum lycopersicum Monalbo 5 5 4 4 2 5
S. melongena Violette 4 2 5 2 4
Sorghum bicolor Argence 0 6 5 3 3
Triticum aestivum Vic 3 6 6 6
T. aestivum Soisson 0
Zea maysL. Epi d’Or 3 3 6 3 6
a
invading plant tissue and the ability of the plants to elicit their defenses. These modulating factors might be differ-ent in the laboratory compared to those under field con-ditions thereby leading to debate about the value of laboratory tests for assessing virulence of a microorgan-ism on a given plant species—especially if disease on this species has not already been observed under field condi-tions. In light of this concern, we searched for traits of P. syringae that could bolster the pertinence of our la-boratory host range tests as an indicator of the potential ofP. syringae.
To summarize the host range of strains into a param-eter comparable across all tests we calculated the extent of the host range. This could be calculated for all strains within a test and did not rely on having common plant species among tests. Host range extent was expressed as the percent of plant species on which each strain was virulent within a test. As described above, a strain was considered virulent on a given plant species if at least half of the replicate plants tested showed symptoms. For strains that were evaluated in more than one test, the mean percent was calculated.
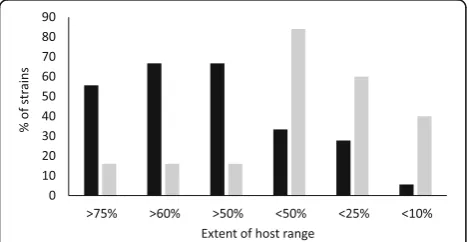
Among all 134 strains of P. syringae, representing eight phylogroups, the extent of host range ranged from 0 to 100%. This range was variable within phylogroups, but only PG02 contained strains that were virulent on more than 75% of the plant species tested (Fig. 4). An analysis of variance (1 factor) indicated that there was a significant effect of phylogroup on the extent of host range (P < 0.000). In pairwise comparisons, strains in PG02 had a significantly greater mean extent of host range compared to those in PG01 and PG03 (Tukey’s Honest Significant Difference Test, P ≤ 0.02) (Fig. 5). The variability among strains and the low number of strains tested for the other phylogroups did not facilitate statistical comparisons for these groups.
The extent of host range was compared to the capacity of strains to swarm in amoeboid, star-like patterns on semi-solid nutrient medium. Swarming was evaluated for 51 strains from PG01, PG02, PG03 and PG04 that were selected to represent closely related strains with contrasting host ranges (Additional file 2: Table S1). About 70% of the strains that consistently displayed swarming within 27 h after inoculation on soft-agar medium were virulent on at least half of the plant species tested whereas over 80% of the strains that did not swarm by 48 h were virulent on fewer than half of the plant species tested (Fig. 6). To assess the statistical significance of the interaction between motility and host range, we compared the frequencies of strains that caused disease to i) more than 60% or ii) less than 25% of the plant species tested coupled to whether or not they consistently swarmed. There were sufficient strains to test the interaction of motility and host range for all strains combined and for strains in PG02 apart from the others. Contingency tests showed that there was a significant association (P < 0.01) of swarming motility with broad host range (> 60% of plant species) and of lack of motility with narrow host range (< 25% of plant species) for PG02 and for all strains considered together (Table4).
The correlation of each of 13 genomic features provided on the JGI platform (see Methods) with the extent of host range was assessed with Spearman’s Rank Correlation test. Only two of these features showed significant correlations (P< 0.05). For all strains considered together, the extent of host range had a significant negative correlation with the number of genes for transmembrane domains (correlation coefficient =−0.330) and a positive correlation with the number of genes in biosynthetic clusters (correlation coefficient = 0.313) (Fig.7).
Discussion
Our results strongly suggest that the individual strains in the P. syringae complex constitute an overlapping continuum of potential host ranges with roughly equal
Table 3Estimation and statistical significance of nestedness and modularity in thePseudomonas syringae-plant symptomatology matrices
a
Disease scores, as described in the Methods section, were combined into two groups reflecting different thresholds for disease category“0”(no symptoms, no virulence) vs. disease category“1”(sensitive host, virulent pathogen).b
representation of those with narrow, intermediate and broad host ranges. This result is consistent with the current view that the mechanisms leading to disease involve mul-tiple factors of virulence and fitness of the pathogen and of a corresponding multiplicity of host defenses that are all modulated by environmental factors. ForP. syringae, viru-lence involves an interplay of extracellular outer membrane structures (such as MAMPs (Newman et al. 2013)) that can set off generic, nonhost defenses in the plant; of mul-tiple effectors that can elicit and/or disarm host defenses more or less specifically and that target a wide range of plant cell functions; and toxins that can have either specific or a wide range of targets (Pfeilmeier et al.2016; Xin et al. 2018). During the process of inciting disease, growth of bacteria in plant tissue depends on expression of genes for traits that assure tolerance of osmotic conditions in the apoplast and the metabolism ofγ-aminobutyric acid as its availability in the apoplast increases (Pfeilmeier et al.2016). All of these processes, as well as those involved in plant
responses to infection, are highly dependent on environ-mental conditions, with temperature, water availability and soil nutrients in particular having marked effects (Dordas
2008; Velásquez et al. 2018) and being among the most
pertinent to the outcome of laboratory tests of pathogen-icity. These environmental factors influence the outcome of the host-pathogen interaction via their effects on, for ex-ample, the effectiveness of PAMP-triggered immunity, the regulation of defense hormones, the expression of proteins involved in effector-triggered immunity of the plant, the ex-pression of phytotoxins and regulation of the type 3 secre-tion system by bacteria (Velásquez et al.2018). Given the complex processes involved in disease causation and in light of the results of our experimental inoculations, we propose that strains ofP. syringaehave general tendencies of host range potential, but that the outcome of the mo-lecular interaction with the plant—in terms of symptom ex-pression—is highly contingent on the biotic and abiotic context. Although this contingency on the environment is
a well-accepted phenomenon, it implies that it is very diffi-cult to define the precise host range of strains ofP. syrin-gae—in terms of a list of plants on which it can cause disease—without conducting multifactorial experiments that account for the effect of environment on the many interacting factors involved in disease manifestation. On the other hand, our results suggest that the potential breadth of the host range, relative to that of other strains, can be estimated.
The breadth of host range that we observed was con-sistent with other traits that have been reported to be well correlated with pathogenic potential—such as mo-tility, the function of certain transmembrane proteins and the products of biosynthetic clusters. Swarming mo-tility has been shown to be an important means for plant associated bacteria to assure invasion of plant tissue and to move to new nutritional reservoirs (summarized in
(Venieraki et al. 2016)) and to be positively correlated with pathogenicity in individual strains as revealed by mutants that are altered in their ability to swarm (Ichinose et al.2016; Cheng et al.2017). This is consist-ent with our observation that strains with the broadest host range tend to be those that swarm, and conversely those that do not swarm tend to have narrower host ranges. Concerning transmembrane domains, in the strains used here there was a wide range of genes that were characterized as coding for transmembrane pro-teins (1062 to 1565 such genes per strain) and included efflux pumps, various transporters, Type 3 Secretion System components, pili and fimbriae components, and cold shock proteins among others. These could consti-tute some of the known PAMPs that stimulate host de-fenses (Ingle et al.2006) and therefore the accumulation of such factors could interfere with virulence. This is consistent with the negative correlation between the ex-tent of host range and the number of genes for transmem-brane proteins that we observed. Biosynthetic clusters refer to genes for polyketides, non-ribosomal peptides, ter-penoids, alkaloids and other ribosomally-synthesized and post-translationally modified peptides, as well as saccha-rides (Medema et al.2015). Many of the molecules synthe-sized in these pathways have biocidal activity against prokaryotic and/or eukaryotic cells (Arnison et al. 2013) and therefore the accumulation of such traits could over-come host defenses and also increase the aggressiveness of strains. This is consistent with the positive correlation that we observed between host range extent and the number of genes in biosynthetic clusters.
What are the implications of these results? Firstly, they have consequences for how to anticipate and protect plants from new disease epidemics caused byP. syringae. Indeed, among the vast diversity of strains (clonal lines) ofP. syringaethat inhabit Earth, relatively few have been captured in the act of causing disease to plants. The relatively few strains that have caused epidemics have succeeded, in part, because they have traits that allow them to proliferate in plant tissue and also because of a concurrence of circumstances that fostered i) their con-tact with plants, ii) the expression of the traits that allow them to proliferate in plants and iii) the inhibition of plant defense mechanisms. Over time there will be new opportunities for strains in the environment that have not already been responsible for epidemics to come into contact with crops. Changes in the climate and in the global environment will likely also increase opportunities for pathogens such as P. syringae to cause disease (Velásquez et al. 2018). Protecting plants from disease involves a combination of a rapid response to the ap-pearance of disease symptoms and the avoidance of risky situations. In light of ever-changing environmental con-texts, of the wide-spread dissemination of P. syringae
Fig. 5Extent of host range of the strains in different phylogroups of Pseudomonas syringae. Host range is expressed as the mean of the percent of plant species in each test on which strains in a given phylogroup were virulent (caused symptoms on at least half of the replicate plants). The number of strains tested in each phylogroup is indicated in boldface. Only phylogroups for which more than 2 strains were tested are presented here. Error bars represent standard error of the means. Means associated with the same lower case letter are not significantly different based on pair-wise comparisons (Tukey’s Honest Significant Difference Test,P< 0.05)
within agriculture and among all the various habitats of this bacterium, and of the vast diversity of this bacterial group (Berge et al.2014) the main challenge is to iden-tify and survey for risky situations that can set crops into contact with reservoirs of P. syringae under conditions favorable for disease. Avoiding risky situations involves
knowing the conditions that favor disease as well as sur-veying for early detection of the pathogen. It is increas-ingly easy to deploy biotechnological tools to survey cropping systems, their frontiers and inputs for risky mi-croorganisms before they cause disease symptoms. Our results suggest that surveying for strains of P. syringae that could cause new diseases would involve identifying the factors that underlie broad host range. This ap-proach would be distinct from and complementary to the diagnostics used to target the lines of the bacterium that are known to have already caused disease to specific crops. In addition, our results have implications for how breeders select plants for resistance to diseases caused byP. syringaein terms of the traits and origin of strains to use in screening.
A second consequence of these results concerns how we perceive pathotypes of P. syringae. Our results pro-vide strong epro-vidence that strains do not cluster into groups with similar and distinct host ranges under com-parable experimental conditions. This lack of groupings was observed for strains from diverse sources (tests B and C) as well as for strains that were mainly from epi-demics on a single host species (cantaloupe for test A and sugar beet for test C). These results are difficult to reconcile with the pathovar nomenclature that specifies that strains should have“distinctive pathogenicity to one or more plant hosts” and that they are usually “ distin-guished in terms of proved differences in host range” (Young et al.2001). According to these characteristics of pathovars, one could argue that nearly every strain among those characterized here is in a distinct patho-var—including strains that currently have the same pathovar names such as pv.actinidiae, pv.savastanoi, or pv. aptata. As far as we are aware, the data presented here represent the most comprehensive effort to assess differences in host range, including reports that describe pathovars. Our observations suggest that current patho-var names do not necessarily take into account the full potential of strains. Furthermore, in view of the overlap-ping continuum of pathogenicity under comparable con-ditions and the lack of pathotypes that can be distinguished from one another, we suggest that the Table 4The number of strains ofPseudomonas syringaein phylogroup 2 and for all phylogroups considered together according to their host range extent and capacity to swarm on semi-solid nutrient medium. In both cases, there is a significant interaction of host range extent and swarming (Fisher’s exact test,P< 0.01). There were not sufficient strains to test the interaction of swarming and host range for phylogroups other than PG02
PG02 Swarming at 27 h No swarming at 48 h
Extent of host range > 60% 10 4
Extent of host range < 25% 1 8
All phylogroups
Extent of host range > 60% 12 4
Extent of host range < 25% 4 15
concept of pathovar as currently defined is inappropriate forP. syringaeand is misleading.
At present, “pathovars” constitute an important vo-cabulary for diagnostics and quarantine. Therefore, we expect considerable opposition to proposals to eliminate this vocabulary forP. syringae. However, the obstacles to changing the vocabulary for P. syringae can be over-come. As pointed out previously, although pathovars are named in legislation to control the emergence and movement of various strains of phytopathogenic bac-teria, in reality the directives are implemented in the form of standard diagnostic procedures that correspond to approved techniques (Morris et al. 2017). Clear de-scription of the techniques and their proper implemen-tation—and not a description of the pathovar—are what assure the efficacy of quarantine and the accuracy of the diagnostics. Furthermore, there is growing recognition that the various clades in theP. syringaecomplex (Berge et al. 2014) can be grouped into separate species based on genetic similarities and the naming of new species within the complex (such asP. amygdali) in addition to P. viridiflava is increasing (Gomila et al. 2017). The work of Gomila and colleagues (Gomila et al. 2017) on the phylogenetic groupings across the P. syringae com-plex illustrates that new species designations will bring together strains that currently have different pathovar names and will distribute other strains with the same pathovar names across several species. This will lead to important confusion if pathovar naming according to current practices is maintained.
The concept that pathogenicity ofP. syringaeis struc-tured in distinct groups ignores the complex factors in-volved in the manifestation of symptoms including the vagaries of the physical environment and possible syner-gies with other plant microflora. This concept can be a barrier to understanding the etiology, epidemiology and emergence of diseases. It also constrains how detection, diagnostics and breeding for disease resistance are con-ceived and implemented. A more robust concept of host range that accounts for the continuum of pathogenic be-haviors inP. syringaewould be an impetus to search for novel markers of pathogenicity that could be deployed for risk assessment. It could also incite breeders to take new approaches to screening for disease resistance by establishing collections of challenge strains that sent this continuum and thereby are likely to also repre-sent a diversity of virulence mechanisms or the fine-tuning of their regulation.
Conclusions
We present a comprehensive effort to assess differences in host range among strains ofP. syringaeto address the questions of the breadth of its host range and how pathotypes are structured. In four independent tests our
results show that host range in theP. syringae complex is an overlapping continuum of potential with strains that have narrow host ranges being just as frequent as those with moderate and those with broad host ranges. These results are consistent with the current paradigm that manifestation of disease symptoms is the result of multiple molecular interactions betweenP. syringae and its plant host that are modulated by abiotic and biotic conditions. We argue that these results strongly support the need to move beyond the concept thatP. syringaeis composed of discrete, discernable pathovars and it opens the door to explore new scenarios of evolution of patho-genicity, of disease emergence and of the means to man-age plant diseases caused by this bacterium.
Methods Bacterial strains
We assessed the pathogenic potential of 134 strains from phylogroups (PG) 1, 2, 3, 4, 5, 7, 9 and 10. Reference strains for the P. syringae complex isolated from dis-eased plants were sourced from public collections or kindly provided by others. A strain ofP. corrugata from tomato was also included. The origin of all strains used in this study is described in Additional file 2: Table S1. For strains in the inoculation test C described below, molecular fingerprints were determined for all strains by BOX-PCR as described previously (Versalovic et al. 1991) to allow traceability in host range testing. All strains were stored in 40% glycerol at −80 °C. Strain CC0094 was used as a common strain in all tests except C so that variability or results could be compared. This strain was isolated from a cantaloupe blight epidemic in France, represents a clonal line that has been found in both epidemics and environmental reservoirs (Monteil et al. 2016) and has been used as a reference strain in our laboratory for over 20 years.
To determine the relative phylogenetic context of all of the strains, Neighbor-joining phylogenetic trees were constructed on the basis of partial sequences of the cit-rate synthase housekeeping gene (cts) as previously de-scribed (Berge et al. 2014). The forward and reverse primers for amplification and the primers for sequencing were, respectively, Cts-FP (forward): 5’-AGTTGATCA TCGAGGGCGC(AT)GCC-3′, Cts-RP (reverse): 5’-TGA
TCGGTTTGATCTCGCACGG-3′ and Cts-FS (fwd):
5’-CCCGTCGAGCTGCCAAT(AT)TTGCTGA-3′ as
used previously (Stopelli et al. 2017). DAMBE (version 5.6.8) was used for aligning sequences and Neighbor-joining trees were built with Mega (version 5.05). Refer-ence strains used to build the trees and not used for inoculations of plants were described elsewhere (Berge et al.2014).
the Joint Genomic Institute (JGI) Integrated Microbial Genomes and Microbiome System (https://img.jgi.doe.-gov/). The variables obtained were as follows: genome size, gene count, CRISPR count, coding base count, CDS count, RNA count, tRNA count, pseudogene count, fused gene count, signal peptide count, transmembrane domain count, horizontally-transferred gene count, and biosynthetic cluster gene count.
Plant material and cultivation
Collectively across all tests, 40 species of plants were used for pathogenicity tests (Table5). Plants were grown and maintained in the greenhouse. All annual plants tested were seed-grown and transplanted in fresh medium-decomposed white sphagnum peat.Prunusspp. plants were sourced from commercial nurseries produ-cing plants from seed, re-potted in the same substrate and maintained in a glasshouse at ambient temperature until inoculation. The rest of the woody plants, (hazel-nut, kiwifruit, oleander and poplar) were vegetatively propagated, re-potted in the same substrate and main-tained in the same conditions. All perennial plant mate-rials used were certified. Annual plants were inoculated one month after sowing (3 to 5 true leaves) while 2-year-old Prunus spp. and 3-month-old hazelnut, kiwi-fruit, oleander and poplar plants were used for the inoculation.
Host range tests
Four separate host range tests were conducted. Test A was conducted in 1998 to characterize strains from a new epidemic of bacterial canker of cantaloupe that was emerging in France. Test B was conducted in 2008 to compare reference strains to strains from environmental reservoirs. Test C was conducted in 2013 to compare strains from woody hosts with reference strains and strains from environmental reservoirs. Test D was con-ducted in 2017 to characterize strains from a new epi-demic of bacterial blight of sugar beet that was emerging in Serbia. Results for some of the strains in test A were described previously (Morris et al.2000) but none of the results from the other tests have been reported previously.
Tests A and B were each conducted in 2 separate blocks with 3 plants per species for each bacterial strain per block. Tests C and D were each conducted in 1 block with 4 and 5 plants per species, respectively, for each bacterial strain. Plants were inoculated with 10– 50μL of bacterial suspension, prepared in sterile distilled water from 48 h cultures on King’s medium B (King et
al. 1954) and adjusted to about 108CFU/mL depending
on the test. This concentration of inoculum is among the most frequently used in host range testing of P. syr-ingaeand well within the range of conditions commonly
used to test the pathogenicity ofP. syringae(Additional
file 3: Table S2). Plants were incubated in greenhouses
and scored for up to 6–15 days for herbaceous plants and up to 60 days for woody plants depending on the test. The specific conditions and the scoring methods used for each test are described in Table 6. For all tests, strains were considered to have pathogenic potential on a plant species only if at least half of the replicate plants tested for each species showed compatible reactions.
Motility and swarming
Strains were tested for motility and swarming in soft nu-trient agar composed of 15 g tryptone casein soy broth (Fisher Scientific, Illkirch-Graffenstaden, France) and 4 g agar per liter of distilled water. For each strain, 10μL of a suspension prepared in sterile distilled water from 48 h cultures on King’s medium B (King et al.1954) and ad-justed to 108CFU/mL were deposited on each of 4 repli-cate plates of the soft nutrient agar in 90 mm Petri dishes. Plates were incubated in the dark at 25 °C and the extent of motility and swarming were noted after 15, 20, 27 and 48 h of incubation.
Statistical analyses
To identify host range patterns of strains, mean disease scores were transformed into categorical values (values of“0” or“1”). In the resulting host × pathogen matrices of these categorical data, we determined if there were structural patterns of modularity (distinct groups) or nestedness (overlapping continuum) of the host range. Such matrices containing binary data can be analyzed similarly to bipartite networks (Weitz et al. 2013). Each combination of strain and plant was assigned to category
“1”(compatible host-pathogen interaction) only if symp-tom expression was repeatable, i.e.≥3 of the 6 plants for tests A and B inoculated with each strain showed symp-toms, ≥3 of the 4 plants for test C, and ≥ 3 of the 5 plants for test D. Otherwise the strain-plant interaction was assigned to the category “0”. The effect on the matrix patterns of different severity thresholds was de-termined for the different tests as indicated in the
Results section. The nestedness and modularity of the
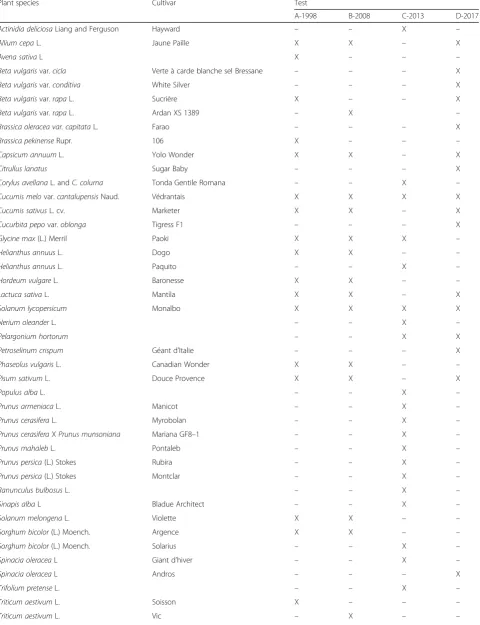
Table 5Plant species and cultivars used in the four different tests of this studya
Plant species Cultivar Test
A-1998 B-2008 C-2013 D-2017
Actinidia deliciosaLiang and Ferguson Hayward – – X –
Allium cepaL. Jaune Paille X X – X
Avena sativaL X – – –
Beta vulgarisvar.cicla Verte à carde blanche sel Bressane – – – X
Beta vulgarisvar.conditiva White Silver – – – X
Beta vulgarisvar.rapaL. Sucrière X – – X
Beta vulgarisvar.rapaL. Ardan XS 1389 – X –
Brassica oleracea var. capitataL. Farao – – – X
Brassica pekinenseRupr. 106 X – – –
Capsicum annuumL. Yolo Wonder X X – X
Citrullus lanatus Sugar Baby – – – X
Corylus avellanaL. andC. colurna Tonda Gentile Romana – – X –
Cucumis melovar.cantalupensisNaud. Védrantais X X X X
Cucumis sativusL. cv. Marketer X X – X
Cucurbita pepovar.oblonga Tigress F1 – – – X
Glycine max(L.) Merril Paoki X X X –
Helianthus annuusL. Dogo X X – –
Helianthus annuusL. Paquito – – X –
Hordeum vulgareL. Baronesse X X – –
Lactuca sativaL. Mantila X X – X
Solanum lycopersicum Monalbo X X X X
Nerium oleanderL. – – X –
Pelargonium hortorum – – X X
Petroselinum crispum Géant d’Italie – – – X
Phaseolus vulgarisL. Canadian Wonder X X – –
Pisum sativumL. Douce Provence X X – X
Populus albaL. – – X –
Prunus armeniacaL. Manicot – – X –
Prunus cerasiferaL. Myrobolan – – X –
Prunus cerasiferaXPrunus munsoniana Mariana GF8–1 – – X –
Prunus mahalebL. Pontaleb – – X –
Prunus persica(L.) Stokes Rubira – – X –
Prunus persica(L.) Stokes Montclar – – X –
Ranunculus bulbosusL. – – X –
Sinapis albaL Bladue Architect – – X –
Solanum melongenaL. Violette X X – –
Sorghum bicolor(L.) Moench. Argence X X – –
Sorghum bicolor(L.) Moench. Solarius – – X –
Spinacia oleraceaL Giant d’hiver – – X –
Spinacia oleraceaL Andros – – – X
Trifolium pretenseL. – – X –
Triticum aestivumL. Soisson X – – –
Values close to zero correspond to random partitions of the matrix into modules of randomly distributed host cases and values are positive if the number of host cases within modules exceeds the number expected on the basis of chance. Because none of the module detection algorithms developed to date provide consistently optimal results in all matrices (Aldecoa and Marín 2013), we used four different algorithms implemented into the edge.bet-weenness (Brandes 2001), the spinglass.community
(Newman and Girvan2004; Reichardt and Bornholdt2006; Traag and Bruggeman 2009) and leading.eigenvector.com-munity (Newman 2006) functions in the R software. To determine the statistical significance of the patterns (nested-ness or modularity) of the plant-P. syringaeinteraction,the observed interaction matrices were compared to matrices simulated under two different null models that were gener-ated by random assignment of compatibility between bac-teria and host plants (Weitz et al.2013): (i) in the Bernoulli Table 5Plant species and cultivars used in the four different tests of this studya(Continued)
Plant species Cultivar Test
A-1998 B-2008 C-2013 D-2017
Vicia fabaL. Agua Dulce – – X –
Vigna unguiculata(L) Walp. – – X –
Zea maysL. Epi d’Or X X – –
a
Plants used in each test are indicated with "X" and those not used are indicated with "–"
Table 6Inoculation and incubation conditions and disease scoring scales used in the four tests of this study
Test A-1998 B-2008 C-2013 D-2017
Date of inoculations
Block 1 Feb-June 1998 Mar-June 2008 Mar-June 2013 May–June 2017
Block 2 May-Sept 1998 July-Nov 2008
# Plants/spp./ strain/block
3 3 4 5
Total # plants tested/ strain/ plant species
6 6 4 5
Age of plants Dicots: 2-leaf stage (2 trifoliate leaves for bean plants), except peas which were inoculated at the 4-leaf stage.
Monocots: 2–3 leaf stage.
Annual plants: one month after sowing (3 to 5 true leaves); 2-year-oldPrunusspp.; 3-month-old hazelnut, kiwifruit, oleander and poplar plants
All plants: one month after sowing (2–6 true leaves)
Inoculum concentration
5 × 10⁷to 1 × 10⁸CFU/mL 108CFU/mL 108CFU/mL
Inoculation of herbaceous plants
Infiltration in leaf blade near the base of the leaf (ca. 50μL)
10 droplets (10μL) on a leaf and 1 droplet (10μL) injected into stem on each plant.
Infiltration in leaf blade near the base of the leaf (10μL) after wounding the site with a sterile plastic stick.
Inoculation of woody plants
1 droplet (10μL) on a scar at the petiole-stem junction,
sealed with parafilm.
Scoring method 0: apparent no reaction; 1: HR-like reaction that does
not evolve;
2: symptoms on < half of leaf; 3: symptoms on > half of the
leaf blade.
0: no apparent reaction;
1: < 5 lesions/leaf, no symptoms on stems; 2: 5–10 lesions/leaf, no symptoms on stems; 3: > 10 lesions/leaf, no symptoms on stems; 4: some dead leaves, no symptoms on stems; 5: leaf score 1 with lesions on stems or petioles
< 5 mm long;
6: leaf score 2 with lesions on stem or petiole from 5 to 10 mm;
7: leaf score 3 with necrosis on stem or petiole > 10 mm;
8: dead plant
0: no apparent reaction; 1: weak symptoms, no necrosis; 2: necrosis at point of inoculation
without spreading;
3:-necrosis up to 25% of leaf blade; 4: necrosis from 25 to 50% of leaf blade; 5: necrosis for > 50% of leaf blade; 6: wilting of entire leaf.
Scoring dates (days after inoculation)
2 and 7 days Herbaceous plants: 5, 10 and 15 days. Woody plants: 15, 30, 45, 60 days
random null model, the same total number of infection/dis-ease cases as in the actual matrix was randomly distributed in matrices containing the same number of lines and col-umns as the actual matrix, (ii) in the probabilistic degree null model, each plant-P. syringae combination of the matrix was assigned a probability of corresponding to an in-fection/disease case which was equal to the mean of the fre-quencies of infection/disease cases in the same column and in the same line of the matrix (Bascompte et al.2003; Weitz et al. 2013). Estimates of nestedness and modularity were contrasted with those of 1000 and 100 matrices simulated under both null models, respectively. Other statistical tests were conducted with Statistica (v.10, StatSoft, Inc., Tulsa, Oklahoma, USA).
Additional files
Additional file 1:Figure S1.Host range relative to phylogenetic context of strains ofPseudomonas syringae(upper figures) or ordered by rank of increasing host range and increasing number of pathogens per plant (lower figures) for each of the four independent inoculation tests. Phylogenetic trees are Neighbor-joining trees based on partial sequences of the cts (citrate synthase) gene, 413 bp. (XLSX 58 kb)
Additional file 2:Table S1.Strains ofPseudomonas syringaeused in this study, the substrates from which they were isolated and the sources from which they were obtained or that described them previously. Strains that were tested for motility and for which whole genome sequences were obtained are indicated. (XLSX 21 kb)
Additional file 3:Table S2.Conditions of tests reported in the literature to determine pathogenicity of strains ofPseudomonas syringae to hosts in addition to the plant species from which strains were isolated. (DOCX 54 kb)
Abbreviations
cts:citrate synthase; PG: Phylogroup
Acknowledgements
We thank the staff of the INRA Plant Pathology Research Unit who manage the greenhouses and growth chambers, led by J. Beraud, and who, over the past several decades, have assured the production and maintenance of plants and the growth facilities that allowed us to do this work
unencumbered over the past 20 years. We also thank the technicians at the INRA Plant Pathology Research Unit who maintain our vast culture collection and who assure quality gene sequencing for phylogenetic analyses, in particular C. Guilbaud, C. Chandeysson and C. Glaux (retired 2013). We are grateful to J. Dangl (University of North Carolina) for providing us several dozen strains, characterized here, for which whole genome sequences are available.
Funding
The research for this work was supported by in-house funding from INRA and from the Ministry of Education, Science and Technological Development of Serbia, grant No. 173026. The salary of JRL was supported by DAFNE, University of Tuscia. The sojourn of IN to conduct pathogenicity tests in Avignon was supported by a Research Grant from the Federation of European Microbiology Societies.
Availability of data and materials
All primary data that are not published with this work - either as tables, figures or supplemental material - can be obtained from the corresponding author. Strains that we have isolated and that are not part of exclusive contracts can be obtained from the authors. Strains that are from other culture collections can be obtained directly from those collections.
Authors’contributions
CEMestablished the strain collections for tests A and B and conducted these host range tests;JRLestablished the strain collection for test C and conducted this test;INandSSestablished the collection for test D andIN conducted this test.CEMconducted motility tests, obtained genome sequence data and conducted statistical analyses on these data.CEMalso constructed all phylogenetic trees.BMadapted the nested and modularity tests for this work and withCEMthey analyzed patterns of host range.CEM wrote the first draft of the manuscript and all authors contributed to the final version. All authors read and approved the final manuscript.
Ethics approval and consent to participate
This study did not involve any human subjects or data about their reactions. For work with plants and bacteria, all tests respected the local and national guidelines and legislations for handling and disposing bacteria and inoculated plant material and respected national policies for hygiene, security and traceability.
Consent for publication
Not applicable.
Competing interests
The authors declare that they have no competing interests.
Author details
1Plant Pathology Research Unit 407, PACA Research Center, INRA, Montfavet 84143, France.2INRA, UMR AGIR, CS52627, 31326 Castanet-Tolosan, France. 3Faculty of Biology, University of Belgrade, Studentski trg 16, Belgrade 11000, Serbia.
Received: 24 July 2018 Accepted: 10 October 2018
References
Aldecoa R, Marín I. Exploring the limits of community detection strategies in complex networks. Sci Rep. 2013;3:2216.
Almeida-Neto M, Guimarães P, Guimarães PR Jr, Loyola RD, Ulrich W. A consistent metric for nestedness analysis in ecological systems: reconciling concept and measurement. Oikos. 2008;117:1227–39.
Arnison PG, Bibb MJ, Bierbaum G, Bowers AA, Bugni TS, Bulaj G, et al. Ribosomally synthesized and post-translationally modified peptide natural products: overview and recommendations for a universal nomenclature. Nat Prod Rep. 2013;30:108–60.
Baltrus DA, Nishimura MT, Romanchuk A, Chang JH, Mukhtar MS, Cherkis K, et al. Dynamic evolution of pathogenicity revealed by sequencing and comparative genomics of 19Pseudomonas syringaeisolates. PLoS Pathog. 2011;7:e10e02132.
Bascompte J, Jordano P, Melián CJ, Olesen JM. The nested assembly of plant-animal mutualistic networks. Proc Natl Acad Sci U S A. 2003;100:9383–7. Berge O, Monteil CL, Bartoli C, Chandeysson C, Guilbaud C, Sands DC, et al. A
user’s guide to a data base of the diversity ofPseudomonas syringaeand its application to classifying strains in this phylogenetic complex. PLoS One. 2014;9(9):e10554e7.
Brandes U. A faster algorithm for betweenness centrality. J Math Sociol. 2001;25:163–77. Cheng FF, Ma AZ, Luo JX, Zhuang XL, Zhuang GQ. N-acylhomoserine
lactone-regulation of genes mediating motility and pathogenicity inPseudomonas syringaepathovartabaci11528. MicrobiologyOpen. 2017;6:e440.
Cintas NA, Koike ST, Bull CT. A new pathovar,Pseudomonas syringaepv.alisalensis pv. Nov., proposed for the causal agent of bacterial blight of broccoli and broccoli raab. Plant Dis. 2002;86:992–8.
Cunniffe NJ, Koskella BE, Metcalf CJ, Parnell S, Gottwald TR, Gilligan CA. Thirteen challenges in modelling plant diseases. Epidemics. 2015;10:6–10. Destéfano SAL, Rodrigues LMR, Beriam LOS, Patricio FRA, Thomaziello RA,
Rodrigues-Neto J. Bacterial leaf spot of coffee caused byPseudomonas syringaepv.tabaciin Brazil. Plant Pathol. 2010;59:1162–3.
Dordas C. Role of nutrients in controlling plant diseases in sustainable agriculture. A review. Agron Sustain Dev. 2008;28:33–46.
Gomila M, Busquets A, Mulet M, García-Valdés E, Lalucat J. Clarification of taxonomic status within thePseudomonas syringaespecies group based on a phylogenomic analysis. Front Microbiol. 2017;8:2422.
Hendson M, Hildebrand DC, Schroth MN. Relatedness ofPseudomonas syringae pv.tomato,Pseudomonas syringaepv.maculicola, andPseudomonas syringae pv.antirrhini. J Appl Bacteriol. 1992;73:455–64.
Hirano SS, Upper CD. Bacteria in the leaf ecosystem with emphasis on Pseudomonas syringae,a pathogen, ice nucleus, and epiphyte. Microbiol Mol Biol Rev. 2000;64:624–53.
Ichinose Y, Sawada T, Matsui H, Yamamoto M, Toyoda K, Noutoshi Y, et al. Motility-mediated regulation of virulence in Pseudomonas syringae. Physiol Mol Plant Pathol. 2016;95:50–4.
Ingle RA, Carstens M, Denby KJ. PAMP recognition and the plant-pathogen arms race. BioEssays. 2006;28:880–9.
Ishiyama Y, Yamagishi N, Ogiso H, Fujinaga M, Takikawa Y. Bacterial brown spot onAvena storigosaSchereb. Caused byPseudomonas syringaepv.alisalensis. J Gen Plant Pathol. 2013;79:155–7.
King EO, Ward MK, Raney DE. Two simple media for the demonstration of pyocyanin and fluorescein. J Lab Clin Med. 1954;44:301–7.
Koike ST, Alger EI, Ramos Sepulveda L, Bull CT. First report of bacterial leaf spot caused byPseudomonas syringaepv.tomatoon kale in California. Plant Dis. 2017;101:504.
Lamichhane JR, Messéan A, Morris CE. Insights into epidemiology and control of diseases of annual plants caused by thePseudomonas syringaespecies complex. J Gen Plant Pathol. 2015;81:331–50.
Lamichhane JR, Varvaro L, Parisi L, Audergon JM, Morris CE. Disease and frost damage of woody plants caused byPseudomonas syringe: seeing the forest for the trees. In: Spark DL, editor. Advances in agronomy, vol. 126. Cambridge: Elsevier: Academic Press; 2014. p. 235–95.
Lindeberg M, Cunnac S, Collmer A. The evolution ofPseudomonas syringaehost specificity and type III effector repertoires. Mol Plant Pathol. 2009;10:767–75. Madden LV, Van Den Bosch FA. Population-dynamics approach to assess the
threat of plant pathogens as biological weapons against annual crops: using a coupled differential-equation model, we show the conditions necessary for long-term persistence of a plant disease after a pathogenic microorganism is introduced into a susceptible annual crop. Bioscience. 2002;52:65–74. Malvick DK, Moore LW. Population dynamics and diversity ofPseudomonas
syringaeon maple and pear trees and associated grasses. Phytopathology. 1988;78:1366–70.
Martin-Sanz A, de la Vega MP, Murillo J, Caminero C. Strains ofPseudomonas syringaepv.syringaefrom pea are phylogenetically and pathogenically diverse. Phytopathology. 2013;103:673–81.
Medema MH, Kottmann R, Yilmaz P, Cummings M, Biggins JB, Blin K, et al. Minimum information about a biosynthetic gene cluster. Nat Chem Biol. 2015;11:625–31. Monteil CL, Bardin M, Morris CE. Features of air masses associated with the
deposition ofPseudomonas syringaeandBotrytis cinereaby rain and snowfall. ISME J. 2014;8:2290–304.
Monteil CL, Lafolie F, Laurent J, Clement JC, Simler R, Travi Y, et al. Soil water flow is a source of the plant pathogenPseudomonas syringaein subalpine headwaters. Environ Microbiol. 2013;16:2038–52.
Monteil CL, Yahara K, Studholme DJ, Mageiros L, Méric G, Swingle B, et al. Population genomic insights into emergence, crop-adaptation and dissemination ofPseudomonas syringaepathogens. Microb Genom. 2016; 2(10):e000089.
Morris CE, Barny MA, Berge O, Kinkel LL, Lacroix C. Frontiers for research on the ecology of plant-pathogenic bacteria: fundamentals for sustainability. Mol Plant Pathol. 2017;18:308–19.
Morris CE, Glaux C, Latour X, Gardan L, Samson R, Pitrat M. The relationship of host range, physiology, and genotype to virulence on cantaloupe in Pseudomonas syringaefrom cantaloupe blight epidemics in France. Phytopathology. 2000;90:636–46.
Morris CE, Monteil CL, Berge O. The life history ofPseudomonas syringae: linking agriculture to earth system processes. Annu Rev Phytopathol. 2013;51:85–104. Morris CE, Sands DC, Vanneste JL, Montarry J, Oakley B, Guilbaud C, et al.
Inferring the evolutionary history of the plant pathogenPseudomonas syringaefrom its biogeography in headwaters of rivers in North America, Europe and New Zealand. MBio. 2010;1(3):e00107–10.
Morris CE, Sands DC, Vinatzer BA, Glaux C, Guilbaud C, Buffière A, et al. The life history of the plant pathogenPseudomonas syringaeis linked to the water cycle. ISME J. 2008;2:321–34.
Mucyn TS, Yourstone S, Lind AL, Biswas S, Nishimura MT, Baltrus DA, et al. Variable suites of non-effector genes are co-regulated in the type III secretion virulence regulon across thePseudomonas syringaephylogeny. PLoS Pathog. 2014;10:e1003807. Newberry EA, Jardini TM, Rubio I, Roberts PD, Babu B, Koike ST, et al. Angular leaf
spot of cucurbits is associated with genetically diversePseudomonas syringae strains. Plant Dis. 2016;100:1397–404.
Newman MA, Sundelin T, Nielsen JT, Erbs G. MAMP (microbe-associated molecular pattern) triggered immunity in plants. Front Plant Sci. 2013;4:139. Newman MEJ. Finding community structure in networks using the eigenvectors
of matrices. Phys Rev E. 2006;74:036104.
Newman MEJ, Girvan M. Finding and evaluating community structure in networks. Phys Rev E. 2004;69:026113.
O'Brien HE, Thakur S, Gong Y, Fung P, Zhang J, Yuan L, et al. Extensive remodeling of thePseudomonas syringaepv.avellanaetype III secretome associated with two independent host shifts onto hazelnut. BMC Microbiol. 2012;12:141. Pfeilmeier S, Caly DL, Malone JG. Bacterial pathogenesis of plants: future
challenges from a microbial perspective. Mol Plant Pathol. 2016;17:1298–313. Polizzi G, Castello I, Parlavecchio G, Cirvilleri G. First report of bacterial blight of
Strelitzia augustacaused byPseudomonas syringaepv.lachrymans. Plant Dis. 2005;89:1010.
Pons P, Latapy M. Computing communities in large networks using random walks (long version). In: Yolum P, Güngör T, Gürgen F, Özturan C, editors. Computer and information sciences - ISCIS, vol. 2005. Heidelberg: Springer Berlin Heidelberg; 2005. p. 20.
Reichardt J, Bornholdt S. Statistical mechanics of community detection. Phys Rev E. 2006;74:016110.
Riffaud CMH, Morris CE. Detection ofPseudomonas syringaepv.aptatain irrigation water retention basins by immunofluorescence colony staining. Eur J Plant Pathol. 2002;108:539–45.
Rodríguez-Gironés MA, Santamaría L. A new algorithm to calculate the nestedness temperature of presence-absence matrices. J Biogeogr. 2006;33:924–35. Sarkar SF, Gordon JS, Martin GB, Guttman DS. Comparative genomics of
host-specific virulence inPseudomonas syringae. Genetics. 2006;174:1041–56. Sedighian N, Shams-Bakhsh M, Osdaghi E, Khodaygan P. Etiology and host range
of bacterial leaf blight and necrosis of squash and muskmelon in Iran. J Plant Pathol. 2014;96:507–14.
Stopelli E, Conen F, Guilbaud C, Zopfi J, Alewell C, Morris CE. Ice nucleators, bacterial cells andPseudomonas syringaein precipitation at Jungfraujoch. Biogeosciences. 2017;14:1189–96.
Traag V, Bruggeman J. Community detection in networks with positive and negative links. Phys Rev E. 2009;80:036115.
Velásquez AC, Castroverde CDM, He SH. Plant-pathogen warfare under changing climate conditions. Curr Biol. 2018;28:R619–34.
Venieraki A, Tsalgatidou PC, Georgakopoulos DG, Dimou M, Katinakis P. Swarming motility in plant-associated bacteria. Hell Plant Prot J. 2016;9:16–27. Versalovic J, Koeuth T, Lupski JR. Distribution of repetitive DNA, sequences in
eubacteria and application to fingerprinting of bacterial genomes. Nucleic Acids Res. 1991;19:6823–31.
Weitz JS, Poisot T, Meyer JR, Flores CO, Valverde S, Sullivan MB, et al. Phage-bacteria infection networks. Trends Microbiol. 2013;21:82–91.
Xin XF, Kvitko B, He SY.Pseudomonas syringae: what it takes to be a pathogen. Nat Rev Microbiol. 2018;16:316–28.