The Thirty-Third AAAI Conference on Artificial Intelligence (AAAI-19)
Revisiting Spatial-Temporal Similarity:
A Deep Learning Framework for Traffic Prediction
Huaxiu Yao,
*Xianfeng Tang,
*Hua Wei, Guanjie Zheng, Zhenhui Li
Pennsylvania State University
{huaxiuyao, xianfeng, hzw77, gjz5038, jessieli}@ist.psu.edu
Abstract
Traffic prediction has drawn increasing attention in AI re-search field due to the increasing availability of large-scale traffic data and its importance in the real world. For exam-ple, an accurate taxi demand prediction can assist taxi com-panies in pre-allocating taxis. The key challenge of traffic prediction lies in how to model the complex spatial depen-dencies and temporal dynamics. Although both factors have been considered in modeling, existing works make strong as-sumptions about spatial dependence and temporal dynamics, i.e., spatial dependence is stationary in time, and temporal dynamics is strictly periodical. However, in practice the spa-tial dependence could be dynamic (i.e., changing from time to time), and the temporal dynamics could have some per-turbation from one period to another period. In this paper, we make two important observations: (1) the spatial depen-dencies between locations are dynamic; and (2) the tempo-ral dependency follows daily and weekly pattern but it is not strictly periodic for its dynamic temporal shifting. To address these two issues, we propose a novel Spatial-Temporal Dy-namic Network (STDN), in which a flow gating mechanism is introduced to learn the dynamic similarity between loca-tions, and a periodically shifted attention mechanism is de-signed to handle long-term periodic temporal shifting. To the best of our knowledge, this is the first work that tackle both issues in a unified framework. Our experimental results on real-world traffic datasets verify the effectiveness of the pro-posed method.
Introduction
Traffic prediction - a spatial temporal prediction problem, has drawn increasing attention due to the growing traffic related datasets and for its impacts in real-world applica-tions.. In the meantime, an accurate traffic prediction model is essential to many real-world applications. For example, taxi demand prediction can help taxi companies pre-allocate taxis; traffic volume prediction can help transportation de-partment better manage and control the traffic to ease traffic congestion.
In a typical traffic prediction setting, given historical traf-fic data (e.g., traftraf-fic volume of a region or a road intersec-tion for each hour during the previous month), one needs to
*Equal contribution
Copyright © 2019, Association for the Advancement of Artificial Intelligence (www.aaai.org). All rights reserved.
predict the traffic for the next time slot. A number of stud-ies have investigated traffic prediction for decades. In time series community, autoregressive integrated moving aver-age (ARIMA) and Kalman filtering have been widely ap-plied to traffic prediction problems (Li et al. 2012; Moreira-Matias et al. 2013; Shekhar and Williams 2008; Lippi, Bertini, and Frasconi 2013). While these earlier methods study traffic time series for each individual location, sepa-rately, recent studies started taking into account spatial infor-mation (e.g., adding regularizations on model similarity for nearby locations) (Deng et al. 2016; Id´e and Sugiyama 2011; Zheng and Ni 2013) and external context information (e.g., adding features of venue information, weather condition, and local events) (Wu, Wang, and Li 2016; Pan, Demiryurek, and Shahabi 2012; Tong et al. 2017). However, these ap-proaches are still based on traditional time series models or machine learning models and do not well capture the com-plex non-linear spatial-temporal dependency.
Recently, deep learning has made achieved tremendous success in many challenging learning tasks (LeCun, Bengio, and Hinton 2015). The success has inspired several studies to apply deep learning techniques to traffic prediction prob-lem. For example, several studies (Zhang, Zheng, and Qi 2017; Zhang et al. 2016; Ma et al. 2017) have modeled city-wide traffic as a heatmap image and use convolutional neural network (CNN) to model the non-linear spatial dependency. To model non-linear temporal dependency, researchers pro-pose to use recurrent neural network (RNN)-based frame-work (Yu et al. 2017; Cui, Ke, and Wang 2016). Yao et al. further propose a method to jointly model both spatial and temporal dependencies by integrating CNN and long short-term memory (LSTM) (Yao et al. 2018).
studies.
Another limitation is that many existing studies ignore the shifting of long-term periodic dependency. Traffic data show a strong daily and weekly periodicity and the depen-dency based on such periodicity can be useful for prediction. However, one challenge is that the traffic data are not strictly periodic. For example, the peak hours on weekdays usually happen in the late afternoon, but could vary from 4:30pm to 6:00pm on different days. Though previous studies (Zhang, Zheng, and Qi 2017; Zhang et al. 2016) consider periodic-ity, they fail to consider the sequential dependency and the temporal shifting in the periodicity.
To address the aforementioned challenges, we pro-pose a novel deep learning architecture,Spatial-Temporal
DynamicNetwork (STDN) for traffic prediction. STDN is based on a spatial-temporal neural network, which handles spatial and temporal information via local CNN and LSTM, respectively. A flow-gated local CNN is proposed to han-dle spatial dependency by modeling the dynamic similarity among locations using traffic flow information. A periodi-cally shifted attention mechanism is proposed to learn the long-term periodic dependency. The proposed mechanism captures both long-term periodic information and temporal shifting in traffic sequence via attention mechanism. Fur-thermore, our method uses LSTM to handle the sequential dependency in a hierarchical way.
We evaluate the proposed method on large-scale real-world public datasets including taxi data of New York City (NYC) and bike-sharing data of NYC. The comprehensive comparisons with the state-of-the-art methods demonstrate the effectiveness of our proposed method. Our contributions are summarized below:
• We propose a flow gating mechanism to explicitly model dynamic spatial similarity. The gate controls information propagation among nearby locations.
• We propose a periodically shifted attention mechanism by taking long-term periodic information and temporal shift-ing simultaneously.
• We conduct experiments on several real-world traffic datasets. The results show that our model is consistently better than other state-of-the-art methods.
Related Work
Data-driven traffic prediction problems have received wide attention for decades. Essentially, the aim of traffic predic-tion is to predict a traffic-related value for a locapredic-tion at a timestamp based on historical data. In this section, we dis-cuss the related work on traffic prediction problems.
In time series community, autoregressive integrated mov-ing average (ARIMA), Kalman filtermov-ing and their vari-ants have been widely used in traffic prediction prob-lem (Shekhar and Williams 2008; Li et al. 2012; Moreira-Matias et al. 2013; Lippi, Bertini, and Frasconi 2013). Re-cent studies further explore the utilities of external con-text data, such as venue types, weather conditions, and event information (Pan, Demiryurek, and Shahabi 2012; Wu, Wang, and Li 2016; Rong, Cheng, and Wang 2017). In
addition, spatial information has also been explicitly mod-eled in recent studies (Deng et al. 2016; Tong et al. 2017; Id´e and Sugiyama 2011; Zheng and Ni 2013).However, all of these methods fail to model the complex nonlinear rela-tions of the space and time.
Deep learning models provide a new promising way to capture non-linear spatiotemporal relations, which have achieved great success in computer vision and natural lan-guage processing (LeCun, Bengio, and Hinton 2015). In traffic prediction, a series of studies have been proposed based on deep learning techniques. The first line of studies stacked several fully connected layers to fuse context data from multiple sources for predicting traffic demand (Wei et al. 2016), taxi supply-demand gap (Wang et al. 2017).These methods used extensive features, but do not model the spatial and temporal interactions explicitly.
The second line of studies applied convolutional struc-ture to capstruc-ture spatial correlation for traffic flow predic-tion (Zhang, Zheng, and Qi 2017; Zhang et al. 2016). The third line of studies used recurrent-neural-network-based model for modeling sequential dependency (Yu et al. 2017; Cui, Ke, and Wang 2016).However, while these studies ex-plicitly model temporal sequential dependency or spatial de-pendency, none of them consider both aspects simultane-ously.
Recently, several studies use convolutional LSTM (Shi et al. 2015) to handle spatial and temporal dependency for taxi demand prediction (Ke et al. ; Zhou et al. 2018). Yao et al. further proposed a multi-view spatial-temporal network for demand prediction, which learns the spatial-temporal de-pendency simultaneously by integrating LSTM, local-CNN and semantic network embedding (Yao et al. 2018). Based on road network, several studies extended traditional CNN and RNN structure to graph-based CNN and RNN for traf-fic prediction, such as graph convolutional GRU (Li et al. 2018), graph attention (Zhang et al. 2018).In these studies, the similarity between regions is based on static distance or road structure. They also overlook the long-term periodic influence and temporal shifting in time series prediction.
In summary, our proposed model explicitly handle dy-namic spatial similarity and temporal periodic similarity jointly via flow gating mechanism and periodically shifted attention mechanism, respectively.
Notations and Problem Formulation
We split the whole city to an a×b grid map with n re-gions in total (n =a×b), and use{1,2, . . . , n}to denote them. We split the whole time period (e.g., one month) into
mequal-length continuous time intervals. The moving trip of any individual, which is an essential part of the entire city-wide traffic, always departs from a region, and arrives at the destination one after a while. We define the start/end traffic volume for a region as the number of trips departing/arriving from/in the region during a fixed time interval. Formally,ys
i,t
and ye
i,t stand for the start/end traffic volume for regioni
tand ending in regionjin time intervalτis denoted asfi,tj,τ. Obviously, the traffic flow reflects region-wise connectivity, as well as the propagation of individuals. The illustration of traffic volume and flow are given in Figure 1(c).
Problem (Traffic Volume Prediction)Given the data
un-til time intervalt, the traffic volume prediction problem aims to predict the start and end traffic volume at time interval
t+ 1.
Spatial-Temporal Dynamic Network
In this section, we describe the details for our proposed
Spatial-Temporal Dynamic Network (STDN). Figure 1 shows the architecture of our proposed method.
Local Spatial-Temporal Network
In order to capture spatial and temporal sequential depen-dency, combining local CNN and LSTM has shown the state-of-the-art performance in taxi demand prediction (Yao et al. 2018). Here, we also use local CNN and LSTM to deal with spatial and short-term temporal dependency. In order to mutually reinforce the prediction of two types of traffic volumes (i.e., start and end volumes), we integrate and pre-dict them together. This part of our proposed model is called Local Spatial-Temporal Network (LSTN).
Local spatial dependency Convolutional neural network
(CNN) is used to capture the spatial interactions. Suggested in (Yao et al. 2018), treating the entire city as an image and simply applying CNN may not achieve the best perfor-mance. Including regions with weak correlations to predict a target region actually hurts the performance. Thus, we use the local CNN to model the spatial dependency.
For each time intervalt, we treat the target regioniand its surrounding neighbors as aS×Simage with two channels
Yi,t ∈ RS×S×2. One channel contains start volume infor-mation, another one is end volume information. The target region is in the center of the image. The local CNN takes
Yi,t as input Y
(0)
i,t, and the formulation of each
convolu-tional layerkis:
Yi,t(k)= ReLU(W(k)∗Yi,t(k−1)+b(k)), (1) whereW(k)andb(k)are learned parameters. After stacking
K convolutional layers, a fully connected layer following a flatten layer is used to infer the spatial representation of regioniasyi,t.
Short-term Temporal Dependency We use Long
Short-Term Memory (LSTM) network to capture the temporal se-quential dependency, which is proposed to address the ex-ploding and vanishing gradient issue of traditional Recurrent Neural Network (RNN). In this paper, we use the original version of LSTM (Hochreiter and Schmidhuber 1997) and formulate it as:
hi,t= LSTM([yi,t;ei,t],hi,t−1), (2)
wherehi,t is the output representation of regioni at time
intervalt.ei,tmeans external features (e.g., weather, event)
and can be incorporated with yi,t if applicable. Thus, the
hi,tcontains both spatial and short-term temporal
informa-tion.
Spatial Dynamic Similarity: Flow Gating
Mechanism
As we described before, local CNN is used to capture the spatial dependency. CNN handles the local structure simi-larity by local connection and weight sharing. In local CNN, the local spatial dependency relies on the similarity of his-torical traffic volume. However, the spatial dependency of volume is stationary, which can not fully reflect the relation between the target region and its neighbors. A more direct way to represent interactions between regions is traffic flow. If there are more flows existing between two regions, the re-lation between them is stronger (i.e., they are more similar). Traffic flow can be used to explicitly control the volume in-formation propagation between regions. Therefore, we de-sign a Flow Gating Mechanism (FGM), which explicitly capture dynamic spatial dependency in the hierarchy.
Similar to local CNN, we construct the local spatial flow image to protect the spatial dependency of flow. The traf-fic flow related to a certain region in a time interval falls into two categories, i.e., inflow departing from other lo-cation ending in the region during the time interval, and outflow starting from this region toward somewhere else. Two flow matrices for the region in this time interval can be constructed accordingly, where each element denotes in-flow/outflow from/to other corresponding region. An exam-ple of outflow matrix is given in Figure 1(c).
Given a specific regioni, we retrieve related traffic flow from pastltime intervals (i.e., time intervalt−l+ 1tot). The acquired flow matrices are further stacked and denoted byFi,t ∈RS×S×2l, whereS×Ssuggests the surrounding neighbor region size, and2lis the number of flow matrices (two matrices for each time interval). Because the stacked flow matrices include all past flow interaction related to re-gioni,
we use CNN to model the spatial flow interactions be-tween regions, which takesFi,tas inputF
(0)
i,t. For each layer
k, the formulation is
Fi,t(k)= ReLU(W(fk)∗Fi,t(k−1)+b(fk)), (3)
whereW(fk)andb(fk)are learned parameters.
At each layer, we use flow information to explicitly cap-ture dynamic similarity between regions by constricting the spatial information via a flow gate. Specifically, the output of each layer is the spatial representationYi,kt modulated by
the flow gate. Formally, we revise the Eq. (1) as:
Y(i,tk)= ReLU(W(k)∗Y(i,tk−1)+b(k))⊗σ(Fi,kt −1), (4) where⊗is the element-wise product between tensors.
AfterKgated convolutional layers, we use a flatten layer followed by a fully connected layer to get the flow gated spatial representation asyi,t. We replace the spatial
repre-sentationyi,tdefined in Eq. (2) byˆyi,t.
Temporal Dynamic Similarity: Periodically Shifted
Attention Mechanism
𝒉𝑖,𝑡
2,1 𝒉
𝑖,𝑡 2,|𝑄|
𝒉𝑖,𝑡1 𝒉𝑖,𝑡2 𝒉𝑖,𝑡 +
|𝑃|
𝒉𝑖,𝑡 2,1
a b
𝒉𝑖,𝑡 1,1 𝒉
𝑖,𝑡 1,2 𝒉
𝑖,𝑡 1,|𝑄|
Attention
Day 𝒕 − 𝑷 + 𝟏 Day 𝒕 − 𝑷 + 𝟐 Day 𝒕 − 𝟏 Day 𝒕
LSTM LSTM
𝒉𝑖,𝑡 |𝑃|,1
𝒉𝑖,𝑡|𝑃|,|𝑄| 𝒉𝑖,𝑡|𝑃|,2
LSTM
𝒉𝑖,1 𝒉𝑖,2 𝒉𝑖,𝑡
LSTM
3x3 Conv 3x3 Conv
σ × FC +
𝑦𝑖,𝑡+1𝑠 𝑦𝑖,𝑡+1𝑒
FC
c d
Output Volume
Flow
External Features
Figure 1: The architecture of STDN. (a) Periodically shifted attention mechanism captures the long-term periodic dependency and temporal shifting. For each day, we also use LSTM to capture the sequential information. (b) The short-term temporal dependency is captured by one LSTM. (c) The flow gating mechanism tracks the dynamic spatial similarity representation by controlling the spatial information propagation; FC means fully connected layers and Conv means several convolutional layers. (d) A unified multi-task prediction component predicts two types of traffic volumes simultaneously.
9:30 9:30 13:00
11:00 9:30 8:30 9:30
(a)
9:30 8:30 10:30 9:30 11:00
(b)
Figure 2: The temporal shifting of periodicity. (a) Temporal shifting between different days. (b) Temporal shifting be-tween different weeks. Note that, each time in these figures represents a time interval (e.g., 9:30am means 9:00-9:30am).
for prediction. However, it overlooks the long-term depen-dency (e.g., periodicity), which is an important property of spatial-temporal prediction problem (Zonoozi et al. 2018; Feng et al. 2018). In this section, we take long-term periodic information into consideration.
Training LSTM to handle long-term information is a non-trivial task, since the increasing length enlarges the risk of gradient vanishing, thus significantly weaken the effects of periodicity. To address this issue, relative time intervals of the predicting target (e.g., same time of yesterday, and the day before yesterday) should be explicitly modeled. How-ever, purely incorporating relative time intervals is insuf-ficient ignores temporal shifting of periodicity, i.e., traffic data is not strictly periodic. For example, the peak hours on weekdays are usually in the afternoon, but could vary from 4:30pm to 6:00pm. Temporal shifting of periodic in-formation is ubiquitous in traffic sequence because of
ac-cident or traffic congestion. An example of temporal shift-ing between different days and weeks is shown in Figure 2a and 2b, respectively. These two time series are start volume of the region containing Javits Center, calculated from New York Taxi Trips (nyc 2017b). Clearly, the traffic series are periodic but the peaks of those series (i.e., marked by the red circle) exist in different time of the day. Besides, com-paring these two figures, the periodicity is not strict daily or weekly. Thus, we design aPeriodicallyShiftedAttention
Mechanism (PSAM) to tackle the limitations. The detailed approach is described as follows.
We focus on addressing the shifting in daily periodicity. As shown in Figure 1(a), relative time intervals from pre-viousP days are included for handling the periodic depen-dency. For each day, in order to tackle the temporal shifting problem, we further selectQtime intervals from each day inQ. For example, if the predicted time is 9:00-9:30pm, we select 1 hour before and after the predicted time (i.e., 8:00-10:30pm and |Q| = 5). These time intervalsq ∈ Q are used to tackle the potential temporal shifting. Additionally, we use LSTM to protect the sequential information for each dayp∈P, which is formulated as:
hp,qi,t = LSTM([yp,qi,t;ei,tp,q],hp,qi,t−1), (5)
wherehp,qi,t is the representation of timeqin previous dayp
for the predicted timetin regioni.
We adopt an attention mechanism to capture the temporal shifting and get the weighted representation of each previous day. Formally, the representation of each previous dayshpi,t
intervalq, which is defined as:
hpi,t=X
q∈Q
αp,qi,thp,qi,t, (6)
where weightαp,qi,t measures the importance of the time in-tervalq in day p ∈ P. The importance value αp,qi,t is de-rived by comparing the learned spatial-temporal represen-tation from short-term memory (i.e., Eq. (2)) with previous hidden statehp,qi,t. Formally, the weightαp,qi,t is defined as
αp,qi,t = exp(score(h
p,q i,t,hi,t))
P
q∈Qexp(score(h
p,q i,t ,hi,t))
. (7)
In this work, similar to (Luong, Pham, and Manning 2015), the score function is regarded as content-based function de-fined as:
score(hpi,,tq,hi,t) =vTtanh(WHh
p,q
i,t +WXhi,t+bX), (8) whereWH,WX,bX,vare learned parameters,vTdenotes the transpose ofv. For each previous dayp, we get the pe-riodic representationhpi,t. Then, we use another LSTM to preserve the sequential information by using these periodic representations as input, i.e.,
ˆ
hi,tp = LSTM(hpi,t,hˆpi,t−1). (9)
We regard the output of the last time intervalhˆPi,tas the rep-resentation of temporal dynamic similarity (i.e., long-term periodic information).
Joint Training
We concatenate the short-term representationhi,tand
long-term representationhˆP
i,tashci,t, which preserve both
short-term and long-short-term dependencies for predicting region and time. Then we feedhc
i,tto a fully connected layer and get the
final prediction value of start and end traffic volume for each regioni, which is denoted asyi
s,t+1andyie,t+1, respectively.
The final prediction function is defined as:
[yi,ts +1, yi,te +1] = tanh(Wf ahci,t+bf a), (10)
whereWf aandbf a are learned parameters. The output of
our model is (-1,1) since we normalize the value of start and end volume. We later denormalize the prediction to get the actual demand values.
In this work, we predict start volume and end traffic vol-ume simultaneously, the loss function is defined as:
L=
n
X
i=1
λ(ysi,t+1−yˆi,ts +1)2+ (1−λ)(yei,t+1−yˆi,te +1)2,
(11) whereλis a parameter to balance the influence of start and end. The actual value of start and end volume in regioniat timet+ 1are denoted as:yˆs
i,t+1,yˆei,t+1.
Experiment
Experiment Settings
Datasets We evaluate our proposed method on two
large-scale public real-world datasets from New York City (NYC). Each dataset contains trip records, as detailed follows.
• NYC-Taxi:NYC-Taxi dataset contains22,349,490 taxi
trip records of NYC (nyc 2017b) in 2015, from 01/01/2015 to 03/01/2015. In the experiment, we use data from 01/01/2015 to 02/10/2015 (40 days) as training data, and the remained 20 days as testing data.
• NYC-Bike:The bike trajectories are collected from NYC
Citi Bike system (nyc 2017a) in 2016, from 07/01/2016 to 08/29/2016. The dataset contains 2,605,648 trip records. The previous 40 days (i.e., from 07/01/2016 to 08/09/2016) are used as training data, and the rest 20 days as testing data.
Preprocessing We split the whole city as 10×20 regions.
The size of each region is about1km×1km. The length of each time interval is set as 30 minutes. We use Min-Max normalization to convert traffic volume and flow to [0,1] scale. After prediction, we denormalize the prediction value and use it for evaluation. We use a sliding window on both training and testing data for sample generation. When test-ing our model, we filter the samples with volume values less than 10, which a common practice used in industry and academy (Yao et al. 2018). Because in the real-world appli-cations, cares with low traffic are of little interest. We select 80% of the training data to learn the models, and the remain-ing 20% for validation.
Evaluation Metric & Baselines In our experiment, two
commonly metrics are used for evaluation: (1) Mean Av-erage Percentage Error (MAPE) (2) Rooted Mean Square Error (RMSE). We compare STDN with widely used time series regression models, including (1) Historical av-erage (HA) (2) Autoregressive integrated moving aver-age (ARIMA); The following traditional regression meth-ods are included: (3) Ridge Regression (Ridge); (4) Lin-UOTD (Tong et al. 2017); (5) XGBoost (Chen and Guestrin 2016). In addition, neural-network-based methods are also considered: (6) MultiLayer Perceptron (MLP); (7) Con-volutional LSTM (ConvLSTM) (Shi et al. 2015); (8) DeepSD (Wang et al. 2017); (9) Deep Spatio-Temporal Residual Networks (ST-ResNet) (Zhang, Zheng, and Qi 2017); (10) Deep Multi-View Spatial-Temporal Network (DMVST-Net) (Yao et al. 2018).
Hyperparameter Settings We set the hyperparameters
based on the performance on validation set. For spatial in-formation, we set all convolution kernel sizes to3×3with 64 filters. The size of each neighborhood considered was set as7×7. We setK= 3(number of layers),l = 2(the time span of considered flow). For temporal information, we set the length of short-term LSTM as 7 (i.e., previous 3.5 hours),
Results
Performance Comparison Table 1 show the performance
of our proposed method as compared to all other competing methods in NYC-Taxi and NYC-Bike datasets, respectively. We run each baseline 10 times and report the mean and standard deviation of each baseline. Besides, we also con-duct student t-test. Our proposed STDN significantly out-performs all competing baselines by achieving the lowest RMSE and MAPE on both datasets.
Specifically, the traditional time-series prediction meth-ods (HA and ARIMA) do not perform well, because they only rely on historical records of predicting value and overlook spatial and other context features. For regression-based methods (Ridge, LinUOTD, XGBoost), they further consider spatial correlations as features or regularizations. As a result, they achieve better performances compared with other conventional time-series approaches. However, they fail to capture the complex non-linear temporal de-pendencies and the dynamic spatial relationships. There-fore, our proposed method significantly outperforms those regression-based methods.
For neural-network-based methods, STDN outperforms MLP and DeepSD. The potential reason is that MLP and DeepSD do not explicitly model spatial dependency and temporal sequential dependency. Also, our model outper-forms ST-ResNet, because ST-ResNet uses CNN to capture spatial information, but overlooks the temporal sequential dependency. ConvLSTM extends fully connected LSTM by integrating convolutional operation to LSTM units for cap-turing both spatial and temporal information. DMVST-Net considers spatial-temporal information by local CNN and LSTM. However, these two models overlook the dynamic spatial similarity and periodic temporal shifting. The bet-ter performance of our proposed model demonstrates the effectiveness of flow gating mechanism and periodically shifted attention mechanism to capture the dynamic spatial-temporal similarity.
Effectiveness of Flow Gating Mechanism In this section,
we study the effectiveness of flow gating mechanism. We first list some variants of using traffic flow information as follows:
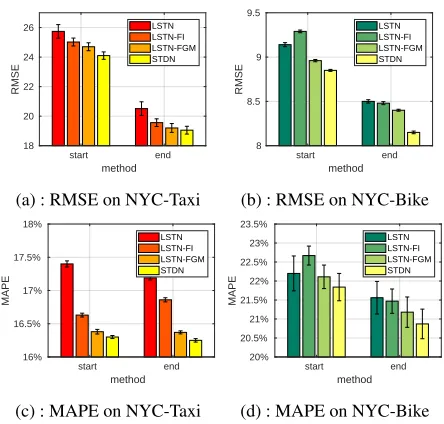
• LSTN: As described in Section , only short-term temporal dependency, and local spatial dependency are considered.
• LSTN-FI: LSTN-FI use traffic flow information as
fea-tures. We simply concatenate flow information Fi,t
de-fined in Eq. (3) and spatial representationYi,t. Then we
feed it in to LSTM as spatial features instead of using a flow gating mechanism.
• LSTN-FGM: FGLSTN further utilize flow gating
mech-anism to represent the spatial dynamic similarity between local neighborhoods. The variant does not use periodically shifted attention mechanism.
The results of different variants in Taxi an NYC-Bike are shown in Figure 3a, 3c and Figure 3b, 3d, respec-tively. LSTN-FGM and STDN outperform LSTN, because LSTN overlooks the dynamic spatial similarity between re-gions (e.g., traffic flow). In order to model dynamic spatial
start end method 18
20 22 24 26
RMSE
LSTN LSTN-FI LSTN-FGM STDN
(a) : RMSE on NYC-Taxi
start end method 8
8.5 9 9.5
RMSE
LSTN LSTN-FI LSTN-FGM STDN
(b) : RMSE on NYC-Bike
start end method 16%
16.5% 17% 17.5% 18%
MAPE
LSTN LSTN-FI LSTN-FGM STDN
(c) : MAPE on NYC-Taxi
start end method 20%
20.5% 21% 21.5% 22% 22.5% 23% 23.5%
MAPE
LSTN LSTN-FI LSTN-FGM STDN
(d) : MAPE on NYC-Bike
Figure 3: Evaluation of flow gating mechanism (FGM) and its variants.
similarity, a straightforward approach would be using local flow as another type of spatial representation, i.e., the vari-ants LSTN-FI. However, compared to LSTN-FGM, which uses flow gating mechanism, LSTN-FI performs worse. One potential reason is that only using traffic flow as features can not incorporate the structure of spatial dynamic similarity. The results reveal the effectiveness of flow gating mech-anism to explicitly capture the dynamic spatial similarity. Furthermore, the comparison to STDN demonstrates the im-portance of tackle temporal shifted periodic information.
Effectiveness of Periodically Shifted Attention Mecha-nism The intuition of periodically shifted attention mech-anism is the long-term periodic information and temporal shifting. In this section, we analyze the effectiveness of pe-riodically shifted attention mechanism and several variants are listed as follows:
• LSTN-L: We extend LSTN by taking long-term
sequen-tial information into consideration. The long-term infor-mation (i.e., the inforinfor-mation of relative predicted time in previous 3 days) are concatenated with short-term infor-mation (i.e., the inforinfor-mation of previous 7 time intervals) and use one LSTM network as prediction component.
• LSTN-SL: LSTN-SL removes the periodically shifted
at-tention mechanism in STDN. LSTN-SL consists of two LSTM network. One is used to capture short-term depen-dency, and another one uses relative time in previous 3 days information to capture long-term information. Note that we set|Q|= 1(only relative predicted time in previ-ous 3 days are considered) and LSTN-SL does not include flow gating mechanism.
• LSTN-PSAM: We add the periodically shifted attention
Table 1: Comparison with Different Baselines
Dataset Method Start End
RMSE MAPE RMSE MAPE
NYC-Taxi
HA 43.82 23.18% 33.83 21.14%
ARIMA 36.53 22.21% 27.25 20.91%
LR 28.51 19.94% 24.38 20.07%
MLP 26.67±0.56 18.43±0.62% 22.08±0.50 18.31±0.83%
XGBoost 26.07 19.35% 21.72 18.70%
LinUOTD 28.48 19.91% 24.39 20.03%
ConvLSTM 28.13±0.25 20.50±0.10% 23.67±0.20 20.70±0.20%
DeepSD 26.35±0.53 18.12±0.38% 21.95±0.35 18.15±0.62%
ST-ResNet 26.23±0.33 21.13±0.63% 21.63±0.25 21.09±0.51%
DMVST-Net 25.74±0.26 17.38±0.46% 20.51±0.46 17.14±0.32%
STDN 24.10±0.25*** 16.30±0.23%*** 19.05±0.31*** 16.25±0.26%***
NYC-Bike
HA 12.49 27.82% 11.93 27.06%
ARIMA 11.53 26.35% 11.25 25.79%
LR 10.92 25.29% 10.33 24.58%
MLP 9.83±0.19 23.12±0.47% 9.12±0.24 22.40±0.40%
XGBoost 9.57 23.52% 8.94 22.54%
LinUOTD 11.04 25.22% 10.44 24.44%
ConvLSTM 10.40±0.17 25.10±0.45% 9.22±0.19 23.20±0.47%
DeepSD 9.69 23.62% 9.08 22.36%
ST-ResNet 9.80±0.12 25.06±0.36% 8.85±0.13 22.98±0.53%
DMVST-Net 9.14±0.13 22.20±0.33% 8.50±0.19 21.56±0.49%
STDN 8.85±0.11*** 21.84±0.36%** 8.15±0.15*** 20.87±0.39%***
*** (**) means the result is significant according to Student’s T-test at level 0.01 (0.05) compared to DMVST-Net
start end method 18
20 22 24 26
RMSE
LSTN LSTN-L LSTN-SL LSTN-PSAM STDN
(a) : RMSE on NYC-Taxi
start end method 8
8.5 9 9.5
RMSE
LSTN LSTN-L LSTN-SL LSTN-PSAM STDN
(b) : RMSE on NYC-Bike
start end method 15.5%
16% 16.5% 17% 17.5% 18% 18.5%
MAPE
LSTN LSTN-L LSTN-SL LSTN-PSAM STDN
(c) : MAPE on NYC-Taxi
start end method 20%
20.5% 21% 21.5% 22% 22.5% 23%
MAPE
LSTN LSTN-L LSTN-SL LSTN-PSAM STDN
(d) : MAPE on NYC-Bike
Figure 4: Evaluation of periodically shifted attention mech-anism (PSAM) and its variants.
Figures 4a, 4c and Figures 4b, 4d show the comparison results in NYC-Taxi and NYC-Bike, respectively. We also show LSTN and STDN (our proposed model) for compar-ison. The results for LSTN and LSTN-L are similar. One potential reason is that when the long term information is
concatenated before short term information in LSTM, only the short term information can be remembered. The other reason is the uneven time gap between long term informa-tion and short term informainforma-tion might be harmful for learn-ing the periodic sequence. In one LSTM network, sequences with different sample rate may not achieve good perfor-mance. LSTN-SL further split the long-term and short-term information and use two LSTM networks to handle these dependencies. We can see that LSTN-SL performs better than LSTN-L, which shows the effectiveness of consider-ing long-term and short-term information separately. Fur-thermore, the improvement from PSAM to LSTN-SL shows the influence of temporal shifting. Using the pro-posed periodically shifted attention mechanism can capture the temporal shifting and improve the performance. Finally, the better performance of STDN than LSTN-PSAM further shows the effectiveness of flow gating mechanism.
Conclusion and Discussion
important for policy makers. Data and code can be found in https://github.com/tangxianfeng/STDN.
Acknowledgments
The work was supported in part by NSF awards #1544455, #1652525, #1618448, and #1639150. The views and con-clusions contained in this paper are those of the authors and should not be interpreted as representing any funding agen-cies.
References
Chen, T., and Guestrin, C. 2016. Xgboost: A scalable tree boosting system. InKDD, 785–794. ACM.
Cui, Z.; Ke, R.; and Wang, Y. 2016. Deep stacked bidirectional and unidirectional lstm recurrent neural network for network-wide traffic speed prediction. InACM SIGKDD Workshop on Urban Computing.
Deng, D.; Shahabi, C.; Demiryurek, U.; Zhu, L.; Yu, R.; and Liu, Y. 2016. Latent space model for road networks to predict time-varying traffic.KDD.
Feng, J.; Li, Y.; Zhang, C.; Sun, F.; Meng, F.; Guo, A.; and Jin, D. 2018. Deepmove: Predicting human mobility with atten-tional recurrent networks. InProceedings of the 2018 World Wide Web Conference on World Wide Web, 1459–1468. Inter-national World Wide Web Conferences Steering Committee. Hochreiter, S., and Schmidhuber, J. 1997. Long short-term memory.Neural computation9(8):1735–1780.
Id´e, T., and Sugiyama, M. 2011. Trajectory regression on road networks. InAAAI Conference on Artificial Intelligence, 203– 208. AAAI Press.
Ke, J.; Zheng, H.; Yang, H.; and Chen, X. M. Short-term fore-casting of passenger demand under on-demand ride services: A spatio-temporal deep learning approach. Transportation Re-search Part C.
Kingma, D., and Ba, J. 2014. Adam: A method for stochastic optimization.arXiv preprint arXiv:1412.6980.
LeCun, Y.; Bengio, Y.; and Hinton, G. 2015. Deep learning.
Nature521(7553):436–444.
Li, X.; Pan, G.; Wu, Z.; Qi, G.; Li, S.; Zhang, D.; Zhang, W.; and Wang, Z. 2012. Prediction of urban human mobility using large-scale taxi traces and its applications. Frontiers of Com-puter Science6(1):111–121.
Li, Y.; Yu, R.; Shahabi, C.; and Liu, Y. 2018. Diffusion convolu-tional recurrent neural network: Data-driven traffic forecasting. InSixth International Conference on Learning Representations. Lippi, M.; Bertini, M.; and Frasconi, P. 2013. Short-term traf-fic flow forecasting: An experimental comparison of time-series analysis and supervised learning.IEEE TITS14(2):871–882. Luong, M.-T.; Pham, H.; and Manning, C. D. 2015. Effective approaches to attention-based neural machine translation.arXiv preprint arXiv:1508.04025.
Ma, X.; Dai, Z.; He, Z.; Ma, J.; Wang, Y.; and Wang, Y. 2017. Learning traffic as images: a deep convolutional neural network for large-scale transportation network speed prediction.Sensors
17(4):818.
Moreira-Matias, L.; Gama, J.; Ferreira, M.; Mendes-Moreira, J.; and Damas, L. 2013. Predicting taxi–passenger demand using streaming data.IEEE TITS14(3):1393–1402.
2017a. Nyc bike:. https://www.citibikenyc.com/system-data. 2017b. Nyc taxi:. http://www.nyc.gov/html/tlc/html/about/trip\
record\data.shtml.
Pan, B.; Demiryurek, U.; and Shahabi, C. 2012. Utilizing real-world transportation data for accurate traffic prediction. In
ICDM, 595–604. IEEE.
Rong, L.; Cheng, H.; and Wang, J. 2017. Taxi call prediction for online taxicab platforms. InAPWeb-WAIM, 214–224. Springer. Shekhar, S., and Williams, B. 2008. Adaptive seasonal time se-ries models for forecasting short-term traffic flow. Transporta-tion Research Record: Journal of the TransportaTransporta-tion Research Board(2024):116–125.
Shi, X.; Chen, Z.; Wang, H.; Yeung, D.-Y.; Wong, W.-k.; and Woo, W.-c. 2015. Convolutional lstm network: A machine learning approach for precipitation nowcasting. 802–810. Tong, Y.; Chen, Y.; Zhou, Z.; Chen, L.; Wang, J.; Yang, Q.; and Ye, J. 2017. The simpler the better: A unified approach to pre-dicting original taxi demands on large-scale online platforms. InKDD. ACM.
Wang, D.; Cao, W.; Li, J.; and Ye, J. 2017. Deepsd: Supply-demand prediction for online car-hailing services using deep neural networks. InICDE, 243–254. IEEE.
Wei, H.; Wang, Y.; Wo, T.; Liu, Y.; and Xu, J. 2016. Zest: a hybrid model on predicting passenger demand for chauffeured car service. In Proceedings of the 25th ACM International on Conference on Information and Knowledge Management, 2203–2208. ACM.
Wu, F.; Wang, H.; and Li, Z. 2016. Interpreting traffic dynamics using ubiquitous urban data. InSIGSPATIAL, 69. ACM. Yao, H.; Wu, F.; Ke, J.; Tang, X.; Jia, Y.; Lu, S.; Gong, P.; Ye, J.; and Li, Z. 2018. Deep multi-view spatial-temporal network for taxi demand prediction. AAAI Conference on Artificial In-telligence.
Yu, R.; Li, Y.; Demiryurek, U.; Shahabi, C.; and Liu, Y. 2017. Deep learning: A generic approach for extreme condition traffic forecasting. InProceedings of SIAM International Conference on Data Mining.
Zhang, J.; Zheng, Y.; Qi, D.; Li, R.; and Yi, X. 2016. Dnn-based prediction model for spatio-temporal data. InSIGSPATIAL, 92. ACM.
Zhang, J.; Shi, X.; Xie, J.; Ma, H.; King, I.; and Yeung, D.-Y. 2018. Gaan: Gated attention networks for learning on large and spatiotemporal graphs. arXiv preprint arXiv:1803.07294. Zhang, J.; Zheng, Y.; and Qi, D. 2017. Deep spatio-temporal residual networks for citywide crowd flows prediction. AAAI. Zheng, J., and Ni, L. M. 2013. Time-dependent trajectory re-gression on road networks via multi-task learning. In AAAI Conference on Artificial Intelligence, 1048–1055. AAAI Press. Zhou, X.; Shen, Y.; Zhu, Y.; and Huang, L. 2018. Predicting multi-step citywide passenger demands using attention-based neural networks. InProceedings of the Eleventh ACM Interna-tional Conference on Web Search and Data Mining, 736–744. ACM.