AUTOMATED CABLE CONTROL IRRIGATION SYSTEM
Robert V. Worstell
Agricultural Engineer
and
W. D. Kemper
Soil Scientist
and
D. C. Kincaid
Agricultural Engineer
USDA, Agricultural Research Service
Snake River Conservation Research Center
Kimberly, Idaho
Introduction
Rapidly rising energy costs have emphasized the need for applying
irriga-tion water with gravity methods whenever it can be effectively done with
good efficiency. Rising labor costs and the lack of skilled irrigators
has led many growers to move away from gravity systems when upgrading their
systems in recent years. Now the rising spiral of energy costs, together
with a smaller margin between production costs and crop market returns
is bringing renewed interest in applying up-to-date methods of gravity
irrigation. These methods reduce labor requirements and increase water
application efficiency to levels similar to sprinkler methods. One of the
newest of these methods has been developed and tested during the last year
and a half at the Snake River Conservation Research Center of the
Agricul-tural Research Service, USDA, near Kimberly, Idaho. This report will
review the development and testing of this method which is often called
"Cablegation."
Description
The method has been used principally for furrow and corrugate irrigated
crops, but one evaluation has shown that it can be modified to use on
graded borders as well.
The basic system, first installed in August 1980, is similar to a gated
pipe system in which the outlets are near the top of the pipe (Figure 1).
The inside diameter of the pipe is sized so that it can carry the
irri-gation flow for the field across the upper edge of the field when only
-
244-filled to about 85 to 90% of its cross sectional area. Thus, the size of the pipe depends on the flow required for the field and the slope across the upper edge of the field. The outlets near the top of the pipe are above the level of the water flowing freely in the pipe until flow is obstructed to reduce its normal velocity.
The water is delivered from the pipe to the field by placing a "plug" in the pipe. As the flow in the pipe approaches the plug, the velocity
decreases and the pressure head
increases until water is
delivered fromthe pipe to the
field. The pressure head is greatest near the plug wherethe velocity in the pipe approaches zero. Thus the maximum flow from the
pipe outlets occurs near the plug and the delivery rate decreases up slope from the plug as shown in the curve in Figure 2. The plug is fabricated from two plastic salad bowls that are clamped between round aluminum plates which are spaced about 10 inches apart by a 2-inch diameter aluminum tube, welded to the plates clamped to the bowls. The outside circumference of the bowls is trimmed so they just slip inside the pipe.
The plug's
position in the pipe is
controlled by a cable which is attachedto the center of the plug. Water pressure against the plug tends to force the plug down slope in the pipe and the cable resists this force. When the cable is reeled out at a controlled rate, the plug moves through the pipe across the upper edge of the field to automatically apply a complete irrigation. The reel's rate of rotation is controlled by a small 12-volt, DC, 1/35 hp motor which operates from an automobile battery, or other DC power supply (Figure 3). The speed of the motor is reduced through two
speed reducing units so the cable is
reeled out to control
the plug'stravel rate between approximately 8 and 24
feet per hour. A rheostat in
series with the motor is used to adjust the plug's rate of advance to achieve the desired duration of water supply to the furrows. Additional details of the cablegation system may be obtained from reference #1.
Testing by Computer Model
Early in the design phase of development, a computer model of cablegation
was developed. Full details of this model are presented in
reference #2.
This model is based on the physical and hydraulic relationships that are
involved when water flows in a partially
filled pipe line on a slope aswell as the
soil
intake function that prevails when water flows in afurrow. Evaluation of the performance of the 1980 installation showed that this model satisfactorily predicted the rates and duration of flow from the orifices.
The model has been used to compare the effects of several different
operat-ing conditions. It was first used to analyze the water applied at the starting and ending positions of the plug in the pipe. The plug must
— 245 —
'MIN/ 301.41UOIAACY1
113
ND U
0 tr)
N c
:t
0 t 0.)
.J
LL.
4
7:La 0
U
E
z
z to
W 12 0
CO
4-4.1 co CD
CO 0_ a. OW
aL
14--1 co
I-- CO
IL
D 13)
(w3) 't C%1 & CO cti
-
247-Figure 4 shows the general cutback nature of the supply and the effect of changing outlet size while holding the system's supply rate and the plug's
travel rate constant. Larger outlets deliver larger flows for shorter time periods so fewer outlets are flowing at any given time. In this way the system can be adjusted for different intake rates.
Figure 5 shows the effect of changing the plug travel rate while holding the outlet sizes and the system supply rate constant. The initial flow is the same, but the water remains in the rows for a longer time to apply more water at the slower travel rate.
Figure 6 shows the effect of using different total flow rates in a system
while the other parameters are held constant. At the lower flow rate,
the maximum discharge is somewhat lower but the duration of delivery to
the furrows is shortened even more noticeably. The middle curve represents an optimum condition. When the input flow is increased above the design level, the pipe fills to a higher level and the outlets tend to "dribble" water for an extended time which over-irrigates the upper ends of the rows. Variations in pipe slope aggravate this condition--especially on
pipelines with slopes less than 0.4%.
Figure 7 shows the results obtained from the computer model when three plugs were used in series. Part of the flow was passed through an orifice in the
center of the upper two plugs. The lower plug was of conventional design.
The computer model also has the capability of closely estimating the amount of infiltration into the corrugates across the field when rates of infil-tration versus time functions are available.
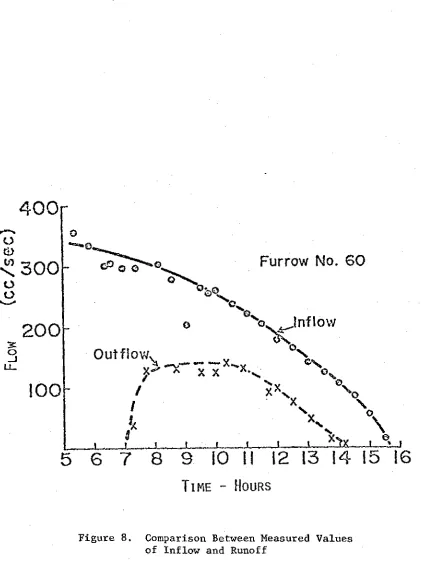
Figure 8 shows a comparison between the measured inflow and runoff rates on a furrow (reference #3). The area between the inflow and runoff curves
is proportional to the water infiltrated and the vertical distance between the two curves represents the soil intake rate for the total length of
furrow at any time after runoff starts. The computer model has been most
useful in bringing a quick understanding of the interaction of the param-eters of the system design and in making preliminary tests of new inno-vations.
Installations and Testing - 1981
Six field size installations were made and partially evaluated during the 1981 irrigation season. These included three in southcentral Idaho, one near Emmett, Idaho, one in the Uintah Basin of Utah, and one in the Grand
Valley of Colorado. The field sizes varied between 40 and 80 acres. The
crops grown were beans; beets, corn, grain, and alfalfa hay. The growers were generally well pleased with their systems and are presently planning
to install cablegation systems on other fields in the near future.
-
248-E
E
a)
LII I II1 I
0
OD (.0 C\J 0 OD (0 d' CV 0 CO (.0 4- Nto cm cki (N.1
cm CV
E
E
a)
w
0
('uguil) MOld 301d180
-— 250 -—
E
E
Et
U
a)
oa
CV q CO W 04 q CO (.0 cd-* C\I q C•I
('UM/1) M
q
1A 301A1H
q
($)
U)
a
0)
CV 0 CO (.0 czt (V 0 CO (0 %zit- (V
(\1 CM CV
▪n•=10
S
▪ am
— 251 —
-
252-Furrow No. 60
5 6 7 8 9 10 11 12 13 14 15 16
TIME - HOURS
-
253-The slope of the cabelgation pipe
lines has varied between 0.2 and 3.0 ft/100 ft on the first installations. The pipe line must be installed on a very constant slope to achieve the most uniform discharge from the out-lets. The constant slope can be increased or decreased at widely spaced points along the line, but the slope must be constant between these pointsof change. When the slope increases, the outlets
are made smaller,
andwhen it decreases, the outlets are made larger to give a uniform applica-tion. The precise grading requirements for laying the pipe has been the main time-consuming operation for installing the system. This may well become a laser controlled operation on commercial installations.
On steeply sloped systems, there is a greater build-up of low pressure in
the pipe. This requires reducing the outlet size and also requires the use of "socks" or tubes to catch the water jetting from the pipe and conduct it gently into the furrow to eliminate erosion.
One installation was troubled with breakage of the cable. This was a
system with a long cable and steep
pipe slopes. A new source for 500-lb
test cable was located, and the reel will be redesigned slightly to
accommodate the storage of this cable which is somewhat larger in diameter.
Evaluation of these systems will continue during the 1982 season to improve our knowledge of the application efficiency of each system, the mainten-ance requirements, and any further operational options that may need to be developed.
Cost of Systems
The
total cost of the systems installed to date
has
ranged between $130 to $150/acre. These costs have been for systems on medium textured soils with irrigation runs in the range of 1000 to 1300 feet long. Costs will be higher on soils with high intake rates since the runs must be reduced to achieve efficient applications. Design costs and profit requirements may further increase the per acre costs of commercially installed systems.Summary
A new automatic gravity irrigation technique has been developed in response
to rising energy costs and the lack of skilled irrigators. The concept is
basically simple, but requires design adjustments for specific sites and
careful installation to make a system most
effective
and efficient. Duringthe 1981 season, solutions were developed for nine common water management and control problems. Future research will be directed toward further
improvement of the application
efficiency of
the present system and towardmaking the concept even more adaptable.
References
-
254-supply pipes for automating furrow irrigation. Trans. ASAE.
(In press).
2.
Kincaid, D. C. and W. D. Kemper. 1981. Cablegation: II.
Simulation and design of the moving-plug gated pipe irrigation
system. Trans. ASAE. (In press).
3.
Goel, M. C., W. D. Kemper, Robert Worstell, and James Bondurant.
1981. Cablegation: III. Field assessment of performance.
p. 0 41 00 p. al ai 0 00 q cl) 0 0 •H /• 4-1 Cd q 4-1 r--I -0 r-I U C0 •n••1
4-$ ti-c Cd 0 O 0 • 4.1 CSI 130 .4 al s-i • ,o .0 0 • o a) q 1-1 0 • /4 cc 44 0 r-I I-I a) ti-t .4 0
00 0 co • 0 9.1 1-1
0. 14 CO 1-1
0 Ps EH 1-1
D r-1
4-1 •r•I
-.4 '0 al
3 0 4
O 00 0
0
Lel La 0 • r•••
a a) rf .0 0 ;-1 a. q 4.) 0 0 -H 4-1 p-i q Ca 4-3 0 0 0 co 1-1 cd 0 q .r1 • 4-1 w u • w tto NA
co Id as 0
3 0
ail 0o 4.) N 0 ar -0 Ef ci 0 cd -0 cd co 0 a) 00 •r4 fA 144 14 q 00 0 r1 0 • 00 '0 4-1 0
-•
1-/ 0) 0 4-1 0 r-1 0./ • 'cl O 0 P.1 14 al -0 14 O 4-1 01 CO id 1 04 /4 O 0.1 .0 k a .0 4J 0 co •ri as u1 I./ O 0 O co • s-i 4-) )4 0D 4 i--/ 3 O 0 v-t a) 41 O al 0 00 00 a) )-1 vi 1-4 .0 q 4.) 41 0 a) 0 sd as U 0 1.1 4-) CO 0 q al 0 00 a) A vl 0 1.1 U *0 0 cd ca 4-) 0 ad I-c •H q 14 csi (h.) 44 cs cd •-1 q t4-1 a) 0 0 0 0 R; 4.1 U .0 0 rf a. /4a
.0 ...A 000 F.0 QJ L, 0 0 4.) ro )-1 r-I •-i 44 0 00 0 a) p . C./ •ri 0 44 q 14 aJ
0 CO 00
I-c
q 34
U) au ro r-I p. as )4 cd 4-) 0
td •r/
ci O0 N 0 4-• 1 CI, In 01 • •ri )4 b'a E 1-1 0.) tH 0 a) Ps N cd •r-1 14 cd q
ad a) N • 003 O 0 1-1 0. 0 o tH O q 4.) 00 O to 3i el )4 4-)
0
.0 )4 a)
•
r-t O a. /4 0 q • 0 ,.4 -r/ x.) RS 0 N ea0 r.-1 04-1 .0 0 .r1 O )4 rI •H co a' al a) k 0 O 0 4 q C-) cc)
255
-pi 0 v4 •i-I N CO tO cd 4-1 to 00
0 to 0 al 3 0, 14 0 4-1 0 cd 41 q /4 P:1 •ri co
0
cu
-1 •
tw > o N-4 •r4 bD 4-1 co O 0 U • M r-i
0 to u bb o O 0 q 0 .0 co 0
a1 r
co P. a)
•
0q
a
al •H 14 0 al CO O co O 0.) v•f /4 Co 0. • CO r-I 0 0) 4-1 1:11 14 14 ' 4-1 tO 0 g' 461 -o 4.) 1-1 ro •p-1 41 0 U C.1 CO 0 co4-1 g
)4 N 0
k q
4-1 n3 q "0 O CD U •r4 q CO 41 a) a) as • -0 v4 rt0 > a) 0 > O R. co 4-) o • a) r-I O 0. 41 R. a
O 0 0 s-1 0 0 4-1 o
O 'P-1 .0 4-1
O 0 al 40 n-g a)
1-1 q 1.1
-1-1 to • '0 a) V O to Ts a) O a) 0
0 0
.0 0 0 t0o 4-1 0:1
00 44.) al
O 0
O 4 0
r-I 0 4
1 4-1 el 4-1
O 4 k 3 01 CD 4-1 at cd
40 O. -r! • rd
0.
0 q
•1-1 1a HO O 0 0 0./ P4 40 k
0.1 p. ..-1 p . '0 01 ro 1-4 0 tH 1.4 a; p. Ia 4-I U 14 4.4 U) 0 )44 0 Cd 1-4 4.) cd 0 00 q u. to •0 as V O 1-1 k • LIA 0 a
• o •r4 O 4-1 12.1 00 3 0 s-4 a) .0 •-1 0 • .0 U
0 1-4 1-i a) 0
•1-1 0 •1-( 0 q 4-1 O 0 0 01 ;-10 0 • .1-1 0 0
-V 00 • W
;•1 11 m 0 O 4-1 U • W
O $-1 k CO SU Rl 14 .0 4-) 4.)
0 • CL) 0 Fro .0 ta q
r--I al 4-1 .0
U
q 4-1
q •./ .0
a
0 Cd 4-1 0 .0 4I Hq q $-c 44-1 to 4-) g Of k a) O 14-4 14-1 14-t o -0 a) •1-4 1-1 • -1-4 0 GU '4-1 14 a) co 4.) 0 0 0 41 0 0 0 41 0.0 P-1 q Cd