FURROW IRRIGATION EROSION EFFECTS ON CROP PRODUCTION
D. L. Carter
Furrow erosion and sediment
deposition redistributes topsoil within fields.
Both of these processes aredirectly proportional to
the energy of thefurrow
irrigation stream. This stream must be large enough at the application pointto provide sufficient water for
infiltration along theentire
furrowlength
to meet the purposes of irrigation.
Where slopes exceed about 0.7% on manysilt l oam soils, the flow
velocity combined with the stream size at the upper ends of fields has sufficientenergy
to erode soil (Berg and Carter, 1980). As the furrow streamsize
decreases frominfiltration along the furrow, the
energy to erode andtransport evil also decreases. At some point along the
furrow the
stream energy reaches a levelwhere it no longer
erodes soil. Then, furtherdown slope, the
energy reaches a level where thestream will no
longer carry the accumulatedsediment
fromupstream erosion.
At
that point
sedimentation begins and continues downslope. The quantity of
eroded soil .actually leaving the field through the furrow depends upon
the sediment load in the furrow stream at the entrypoint into the
drain ditch at the lower end of the field and the duration of the flow at that point.Furrow irrigation erosion
and the resulting soil loss is generally greateston the upper portion of fields (Berg and Carter, 1980;
Carter and Berg, 1983;Hersh and Smith, 1967) where the furrow stream size
is largest and the energy to erode is greatest. Erosion is also often severe along portions of the furrow where the slope is greater than along other portions of the run length (Carter and Berg, 1983). Where furrow erosion occurs irrigation after irrigation, the topsoil isgradually
eroded away. Theimpact of
this topsoilloss on crop production is of concern. This paper
reports results from a study to quantify crop yield losses resulting from furrow irrigation erosion.SOILS OF THE STUDY AREA
The soils of the study area are Fortneuf silt loam (Durixerollic Calciorthid) and similar silt loams, with a lime and silica cemented hardpan (caliche) that begins 0.3 to 0.45 m below the surface and varies in thickness from 0.2 to 0.45 m. The topsoil is pale
brown (10YR 6/3)
silt loam with a silt content ranging from 62 to 67%. The hardpan is white (10YR 8/2) silt loam, strongly cemented, with a silt content ranging from 65 to 75%, and a CaCO, content ranging from 25 to 35%. The soil below the hardpan is light gra#(10YR 7/2) silt loam with a silt content generally greater than 70%, and this soil has little structure.
Areas where
the hardpan soil or
the soil below the hardpan has been brought to the surface by cultivation, or exposed by erosion and cultivation or land leveling, appear whitish in color in contrast to the pale brown topsoil. The upper ends of many fields in the study area are whitish because furrowirrigation erosion has reduced the topsoil depth sufficiently that plowing
has fractured
the white caliche layer and brought part of it to the surface.The author is: D. L. Carter, Supervisory Soil Scientist and
Research Leader,
Agricultural Research Service, USDA, Snake River Conservation Research Center, Kimberly, Idaho.Results of a survey we made of fields in the study area indicated that 70 to
75% of the fields exhibited
whitish upper ends. The average portion of whitish soil on14 farmer operated fields studied was 30%. Multiplying that
value by the 70% of the fields withwhitish areas gives a value of 21% of the
area as eroded sufficiently that topsoil has been reduced from the originalaverage of 0.38 m deep to a significantly shallower
depth through which plows have fractured and brought portions ofthe caliche layer
to the soil surface. We observed many fields where topsoil losshas exceeded 0.3 m immediately
below the head ditch. The area has been irrigated for 78 years, and rough estimates of the yearly erosion loss can be made from the depth of soil eroded away from the upper ends of fields.The soils of the study
area represent more than a million hectares ofirrigated land, and much more
nonirrigated land in Idaho. Large areas of
similar silt loam soils are present in Oregon and Washington and some other Western States. Not all of these similar soils have caliche layers.STUDY METHODS
Two approaches were applied during the 1982, 1983, and 1984
growing season to evaluate the impact of furrow irrigation erosion on crop production. One approach involved 17 farmer operated fields. All of these fields had been furrow irrigated for 75 to 78 years except one which had beenconverted to
sprinkler irrigation after approximately 65 years of furrow irrigation. Topsoil depth wasmeasured
using soil probes or augers along fourtransects
parallel
to the head ditoh. These transectswere located
by measuring the distance that the whitish soil extended downslope from the head ditch where a transition zone was clearly evident between thewhitish soil
and normal topsoil. This transitionzone represented where the plow depth was
the sameas the topsoil depth. The
first
transact wasone half the
distancebetween
the head ditch and the transition zone. The second was atthe
transitionzone, the third was about one-third the distance between the
transition zoneand the lower end of
the field, and the fourth wasapproximately 30 m from
the lower end of the field.Crop yields were measured along
these
sametransects for
relating crop yield to topsoil depth. Over two seasons, data were obtained from six wheat(Trit4oum aestivu L.), seven dry
bean(Phaseolus_aso.),
two alfalfa(Medicamo sativa L.), one sugarbeet (Zeta vulmaria
L.), and one Norgold Russet potato(Solanum tubergsum
L.) fields.o
800
60 o
0A
0
0
0
AO
a
0
x5,0.38m
9
•
25.95 +155.3Ix
r
. 0.60"
0
0
x>0.38m
9•
•
84,14 +12.04x
0
0
r • 0 17
0 Formers' Fields
0 1983 Plots
4
1984 Plots
TOPSOIL DEPTH - CROP YIELD RELATIONSHIPS
Reducing topsoil depth from the original 0.38
m decreased yields of all crops
studied. Wheat and sweet corn yields were decreased most and sugarbeet yields weredecreased the least. Alfalfa and barley yields followed similar
patterns with reduced topsoil depth, and the response of dry beans was cultivar dependent. Some bean cultivars were affected similar to sweet corn and wheat, while other cultivars were not significantlyaffected.
Relative yields of each crop at each topsoil depth were calculated based upon the maximum yield measured along
a transeet on farmers' fields or the maximum
yielding plot in the plot study. Yields alongother transects or on other
plots were expressed as percent of these
maximum yields. Linearregression
analyses were made on the yield data for topsoil depth up to and including the original 0.38 m, and a separateanalysis was made for
topsoil depths greater than 0.38 m. The purpose of this type of analysis was to obtain an estimate of yield loss per unit of topsoildepth loss from erosion and the
yield increase per unit of topsoil depth increase from deposition.The percent maximum
yield vs. topsoil depth relationship for wheat indicated that for each 0.01 m decrease in topsoildepth below the
original 0.38 m, wheat yield was decreased 1.55%(Fig. 1). Increasing topsoil
depth aboveoriginal
depth had no significant effect onwheat yield
based upon thislinear regression approach. The data in Fig. 1 include 1983 and 1984 plot
yields and yields
measured along transects in farmers' fields. Seasonaleffects were evident on the research plots.
Plotting the 1983 and 1984 data
separately gave slightly different slopes. These lines are not shown, butthe data points provide evidence of the slope differences.
20
0
0.1 0.2 0.3 0.4 0.5 0.6 0.7 0.8
TOPSOIL DEPTH, m
q
A
0 0
x50.38m C‘' 31.24 + 135-69x
r
n
0.63 •
x>0.38m Y = 95.16 -10.97x
0
r = -0.12
O 1983 Plots
q
1984 Plots
80
T. 70
60
x
'
2
4 50
• 40
30
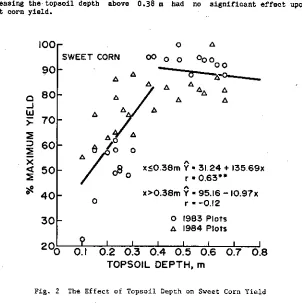
The response of sweet corn yields to changes in topsoil depth was similar to that for wheat (Fig. 2). Sweet corn data were taken from the plot study only. Sweet corn yields were lower in 1984 than in 1983, and there was some
evidence
of seasonal effect, as was
noted with wheat.
As with wheat,
increasing the topsoil depth above 0.38 m had no significant effect upon sweet corn yield.100
0
q
SWEET CORN
00 0 o 0
00
90
q
0 0
A
4
q
AA
q
20
0
0.1 0.2 0.3 0.4 0.5 0.6 0.7 0.8
TOPSOIL DEPTH, m
Fig. 2 The Effect of Topsoil Depth on Sweet Corn Yield
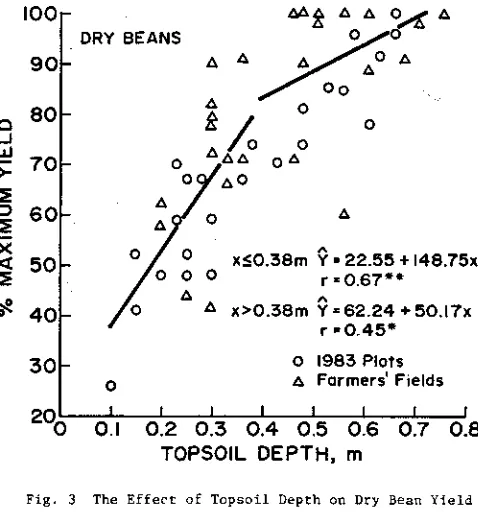
Many cultivars of dry beans are produced in
the study area. We grew RoyalRed kidney beans on the experimental plots in 1983, and they responded
similarly to sweet corn and wheat to changes in topsoil depth. In contrast,
the yield of red chili beans grown in 1984 was not significantly affected bytopsoil depth.
Results for the 1983 plot and farmer field data are shown in
Fig. 3. Several different
bean cultivars were grown onfarmers' fields,
and
therefore, considerable variability is evident in the results.
Dry bean
yields were significantly increased by increasing topsoildepth above 0.38 m.
The yield increase per unit increase
in
topsoil
depth was lessthan the yield
decrease per unit decrease in
topsoil depth. Bathrelationships were
statistically significant.
100
90
80
5: 70
2
D
2
60
x
ALFALFA —
x<0.38m
56.32 + 69.06x
r =
0.43 * *
A
x>0.38m
79.90 + 6.11x
r =
0.03
0.1 0.2 0.3 0.4 0.5 0.6 0.7 0.8
TOPSOIL DEPTH, m
2
4
50
44
40
30
20
0
x<0.38 m Y
=
58.10 + 66.54x
r 0 52**
x>0.38m 9 • 88.51+ 0.12x
r =0.26
80
70
60
50
40
30
20
0
100
DRY BEANS
90-
4 A
q
0
0
A
0
/0 0
0
.621.
0
A
x0.38m 9
n
22.55 +I48.75x
r = 0.67**
x>0.38m '7 = 62.24 +50.17x
r =0.45*
0 1983 Plots
0
4 Farmers' Fields
0.1 0.2
0.3 0.4 0.5 0.6 0.7 0.8
TOPSOIL DEPTH, m
Fig, 3 The Effect of Topsoil Depth on Dry Bean Yield
Fig. 4 The Effect of Topsoil Depth on Alfalfa and Barley Yields
4
0 0 0
0
o
q
0 o
o
0 o
x<0.38m
9 •
64.23 +
73.79x
r
• 0.74 •
x>0.38m 9
n
92.89
- 2.57x
r = -0.03
100r
SUGARBEETS 0
0
q
0
yr
0
O 1983
Plots
q
Farmers' Field
2 c,
1 11110 0.1 0.2 0.3 0.4 0.5 0.6 0.7 0.8
TOPSOIL DEPTH, m
90
80
Lei
70
2
60
<
2 50
40
30
The relationship for barley had less variability than for alfalfa. Neither
of these crops were affected as severely by loss of topsoil as were wheat,
sweet corn, and beans. Increasing topsoil depth did not significantly affect
yield of these two crops.
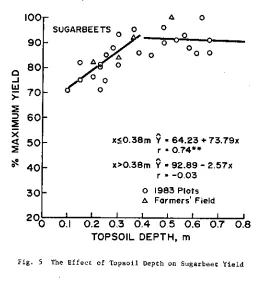
High yields of sugarbeets were measured on all 1983 plots and on the one
farmer field studied. The relationship between yield and topsoil depth was
significant, but the effect of topsoil loss is less
for
sugarbeets than for
the other orops studied (Fig. 5).
Fig.
5
The Effect of Topsoil Depth on Sugarbeet Yield
Potato yield and grade both decreased as topsoil depth decreased (Table 1).
Table 1. Potato yield and grade at different topsoil depth
ZMZZEGEM m i Z M
Topsoil Depth
Whitish
0.38
0.56
as:
a
*LSD (0.05) a 3.59 Mg/ha
Yield
Baker
% No. 1 Grade
>283g
113-283g
Total
No.2
Cull
45
Mg/ha
11
53
1/
25
51*
25
47
72
8
20
Only one farmer operated field was sampled, and the data
were evaluated by analyses of variance. Yieldalong three transacts
are
shown. Total yield
continued toincrease up to a topsoil depth of 0.56 m indicating that topsoil
depth increases from sediment deposition benefitted potato yields. The percent No. 1grade
was greater where the topsoil was 0.38 a deep or deeper than on the whitish soil area.Curvilinear regression analyses were completed for all of the crops except potatoes for the 1983
and 1984
data. Significantrelationships were obtained
for all crops when using the equation y = a +
b In x, where y is yield and x is topsoil depth. Yields for all depths wereincluded in the same analyses
instead of separating yields for R2 of 0.38 m and less and those greater than 0.38 a. The equations and R' values are presented (Table 2) but the relationships are not illustrated. Allrelationships were statistically
significant. These relationships tended to indicate agreater yield increase
with increasing topsoil depth than was actually the case. The scatter of data points was greater along the upper portions of the curves. Therefore, we concluded that the linear relationships give a better representation of the true effects of topsoil depth increases on crop yield. Additional curvilinear regression analyses will be made using different equations and additional data from the next season. Ultimately, a curvilinearrelationship
over the entire topsoil depth range would bemost usable for
making predictions,Table 2. Curvilinear regression equations
and correlation coefficients relating crop yield to topsoil depthCrop
2..SSZ
for 1982
and 1983
data. All relationships significant at the 0.001 probability level.Equation
were
Ft2
Wheat Y -57.17 + 37.23 In X .518
Sweet Corn Y 2 -65.66 + 39.26 In X .799
Dry Beans Y = -46.98 33.68 In X .685
Barley Y - 2.90 + 23.59 In .765
Alfalfa = 7.9 ► + 19.28 In X .389
Sugarbeets 45.25 + 11.68 In I .529
DISCUSSION
Results of our investigations clearly show that topsoil loss from furrow irrigation erosion decreases
crop yields in
the study area. Today,significantly
lower yields of most crops are being harvested on at least 20% of the farmed area. There is also evidence that yields of some crops may begreater where deposition of
soil eroded from upslope portions of the furrow has increased topsoil depth. However, yield increases per unit of topsoil depth increase are small wherethey occur, whereas yield
decreases per unit of topsoil depth decrease are larger and are additive to rather high percentages in yield reduction as erosion removes more topsoil year after year.plant nutrient deficiencies and water deficits by assuring adequate levels of both for growing crops. At present, we do not know how to restore production on these areas where it has been reduced. Perhaps returning topsoil from deposition areas to eroded areas will restore yield potential, but this needs to be verified. Even if this approach restored yield potential, the cost may
be prohibitive. Furthermore,
there are many fields in the study area wheremuch of the eroded soil
has been carried off the field intodrainage streams.
This lost topsoil cannot be returned.The fields in the study area have been furrow irrigated only
75 to 78 years, and erosion hasseriously reduced yield on more than 20% of the
area. Farmers in the areaare confronted
with a serious problem in the future. It is difficult to predict how rapidly the yield reduced area will expand, but it is importantthat every practice available
be applied to limit additional erosion.Results of these investigations apply to over a million hectares of irrigated land in Idaho, and likely apply to large areas of similar soils in several other western states. Additional research is needed to determine if similar
relationships
between yield and topsoil depth exist on soils without caliche layers. We are planning research of this kind for future growing seasons. Also needed is research on possible methods to restoreproductivity of eroded
areas. We are investigating the feasibility of using earth-moving equipment to move topsoil from deposition areas to eroded areas to determine ifsuch.a
practice willrestore the
productivity of the eroded areas.The economic impact of furrow irrigation erosion
is serious. More than 20%
of the land in our study area has a yield reduction from about 10% to as much as 70%. If we assume an average yield reduction of 40% over the eroded area, we find that the productivity of the entire area has been reduced nearly 10%by the erosion
that has occurred over the past 75 to 80 years, compared to the potential production had there been no erosion. A 10% decrease in gross income without any decrease in expenses can have aserious impact on
farmers' operations.Furthermore,
untilwe find a method to restore
that productivity, and without erosion control, the reduced income notonly occurs
every year, but it becomes greater as erosion reduces yield on more land and further decreases yield on already eroded areas. These estimates are conservative, because thereare
areas where the topsoil depth has been reduced by erosion, but not yet sufficiently to expose the white calichelayer. These areas also
have reduced yields, and were not included in our surveys.All available
erosion
controltechnology for furrow
irrigated land should beapplied to
reduce further erosion and topsoil loss. This is important fromthe economic standpoint of
presentoperators and to maintain productivity of
the land for futuregenerations.
SUMMARY
Furrow erosion and sediment deposition redistributes topsoil within irrigated fields. Where slopes exceed about 0.7% on many silt loam soils, the upper ends of fields have been severely eroded. Studies conducted on Portneuf silt loam and similar soils with a white, caliche and silica cemented layer originally beginning at a depth of about 0.38 m, showed that erosion has been sufficient to expose the white, caliche layer on 70 to 75% of the fields over about 78 irrigation seasons. The area now visually exhibiting whitish color as a result of
erosion and plowing to expose or bring to
the surface, white,
caliche, represents more than 21% of the farmed area.
Significant linear relationships between crop yield and topsoil depth were
aeveloped for
wheat, barley, sweet corn, dry beans, alfalfa, and sugar beets,
and
a significant yield reduction
was measured for potatoes. Wheat, dry
beans,
and sweet
corn yields were reduced most, alfalfa and barley yields
were reduced somewhat less, and sugar beet yields were least affected by topsoil loss from erosion.
Results
showed that furrow irrigation erosion has significantly reduced
cropyields on
more than
20%
of the cultivated land in
the study area. Theseresults indicate that crop production has been reduced about 10% by erosion