Issues
ISSN: 2146-4138
available at http: www.econjournals.com
International Journal of Economics and Financial Issues, 2017, 7(3), 82-87.
Measuring Earnings Quality Over Time
Yohan An*
Department of Finance & Accounting, Tongmyong University, Republic of Korea. *Email: [email protected]
ABSTRACT
The purpose of this paper is to analyze earnings quality over the twelve years. We measure earnings quality as two types of dimensions: (1) Decision usefulness and (2) stewardship (or accountability) based on the conceptual framework of the International Financial Reporting Standards. This paper
investigates earnings quality of listed firms on the Korean stock exchange using a sample of 9584 firm-year observations over the period 1995-2006.
Earnings quality as decision usefulness is measured as persistence and value-relevance, while earnings quality as stewardship (or accountability is
measured as conservatism and accruals quality. This study finds earnings quality of Korean firms is relatively lower than that of developed countries across three earnings quality dimensions except for conservatism. Thus, it is likely that Korean firms engage in earnings management in the presence
of economic incentives, thereby reducing earnings quality.
Keywords: Earnings Quality, Decision Usefulness, Stewardship
JEL Classifications: G30, M4
1. INTRODUCTION
The purpose of this paper is to measure earnings quality of listed on
the Korean stock exchange (KSE) using a sample of 9584 firm-year observations from 1995 to 2006. As a proxy of financial reporting
quality, earnings quality is measured as two types of approaches: Decision usefulness and stewardship (or accountability) based on the conceptual framework of the International Financial
Reporting Standards (IFRS). From the standpoint of as a proxy
of financial reporting quality, earnings quality is associated
with the relevance of the financial information and measured as
earnings persistence and value-relevance, while earnings quality in the view of stewardship (or accountability) is related with
reliability of financial information and measured as conservatism and accruals quality. Earnings quality is the most primary proxy of financial statements and the most comprehensive measure for financial reporting quality (Lev 1989), but not exclusively defined (Balsam et al., 2003).
This study is expect to have several contributes. First, this study
provides good coverage of recognized earnings quality indicators
by examining various measures of earnings quality. Second, the
measure of earnings quality over time is important for regulators
because analysis of financial statements is meaningful indicator
for economic efficiency of country. Thus, this study provides
implication for regulator of accounting standard setting. Finally, a time-series analysis of earnings quality plays an important role
to various stakeholders since earnings quality means the firm’s accounting performance and is useful measure for assessing firm value (Dechow and Schrand, 2004).
This paper begins with this introduction section, and then section 2 discusses previous literatures on earnings quality. Section 3 discusses the methodology used in the paper. In section 4, we
reports empirical results. Finally section 5 provides conclusions
for the paper.
2. LITERATURE REVIEW
The definition of earnings quality is various by researchers. Entwistle and Phillips (2003) suggest that earnings quality should be correspond with the core purpose of financial reporting providing relevance and reliability to financial statement users. Dechow (1994) insists that earnings are very important for a
large variety of stakeholders because of providing information
of firm performance. Investors and managers use earnings as
one of the main guides to identify and evaluate investment
use earnings to extract value-relevant information from pattern of earnings (Francis et al., 2004). Earnings quality is also
used for contracting purposes by current and future investors
(Schipper and Vincent, 2003). Dechow and Dichev (2002)
suggest that earnings are one of the most important measures
to assess firm’s future cash flows. To summarize, financial
statements can be regarded as being high quality when reported
earnings accurately reflect underlying economic events and conditions as well as enable financial statements users to make
better decisions. In addition, high earnings quality can be
achieved if earnings reflect firm’s transparency and provide users with useful accounting information to evaluate the firm’s
performance.
In the view of decision usefulness, the purpose of financial
statements should provide useful information to users in making economic decision, causing difference to their decisions. Decision usefulness of perspective is related to
persistence and value-relevance (Schipper and Vincent, 2003; Jonas and Blanchet, 2000). Highly persistent earnings mean more permanent and less transitory so that financial statement
users recognize them as high earnings quality. Francis and
Schipper (1996) and Hung (2001) define the value-relevance of accounting information as the ability of financial statements to summarize information that affects firm value as well as the captures of the relevance of earnings (Barth et al., 2001; Schipper and Vincent, 2003). Thus, persistence and value-relevance can be good proxy of earnings quality reflecting the
concept of decision usefulness.
The standpoint of stewardship (or accountability) emphasizes financial information transparency, the faithfulness and
objectivity. Rezaee (2002) and Ball et al. (2000; 2003) propose that financial information should be fully and fairly disclosed and should not mislead or confuse financial statement users. In summary, the role of financial reporting under the view of
stewardship (or accountability) is to monitor management by mitigating information asymmetry between manager and stakeholders.
Earnings quality based on the stewardship (or accountability) can be measured by conservatism and accruals quality. Determinant
criteria of financial reporting quality are defined as a degree of
aggressiveness or conservatism of accounting principles (The
SEC Recommendation No.8). Conservatism captures financial
statement transparency since conservatism constrains managerial opportunistic behavior and offsets managerial biases with its
financial information asymmetry (Ball et al., 2000; 2003; Watts 2003a). Accruals quality is a good proxy of earnings quality (Schipper and Vincent, 2003) since accruals quality represents the faithfulness of financial reporting. Faithfulness of financial reporting is defined as that “to be reliable, information must
represent faithfully the transactions and other events it either
purports to represent or could reasonably be expected to
represent.” (The IASB Framework, paragraph 33). Consequently,
conservatism and accruals quality can be proxy to measure
of earnings quality under the concept of stewardship (or accountability).
3. MATERIALS AND METHODS
3.1. Sample
The sample in study consists of listed firms on the KSE. We collect data from OSIRIS database for the years 1995-2006. All financial institutions (e.g. commercial banks, insurance firms, security brokerage firms etc.) are excluded due to inconsistency of financial statement format. The final sample is a total of 9584 firm-years observations.
3.2. Measure of Earnings Quality
As discussed in literature review section, earnings quality is classified into two categories: (1) Decision usefulness and (2) stewardship (or accountability). In the view of decision usefulness, earnings quality is measured as persistence and value-relevance, while earnings quality under the stewardship (or accountability) is measured as conservatism and accruals quality.
3.2.1. Persistence
Persistence means how much of current earnings will persist into the future and continue from period to period. Following
Boonlert-U-Thai et al. (2006) and Ali et al. (2007), persistence is measured as the slope-coefficient following equation:
Earnings
Total Asset
Earnings
TotalAsset
i,t 1
i,t 1 i,t
i t,
−
− −
= +α β1
1 1
+εi t, (1)
Where for firm i and year t, Earningsi,t is net income before
extraordinary items in current year; Earningsi,t-1 is earnings before
extraordinary items in previous year; εi,t is the residuals.
Value of β1 close to one indicates highly persistence earnings,
while value of β1 close to zero reflects highly transitory earnings. Financial information users recognize highly persistent earnings as sustainable, less transitory, and more stable (Richardson
et al., 2003). Therefore, large (small) values of the slope-coefficient (β1) correspond to more (less) persistence.
3.2.2. Value relevance
Following, Collins et al.’s (1997) and Ali and Hwang (2000), we measure value-relevance as the explanatory power of earnings and book value of equity for stock returns. Hence, following equation
is employed to measure value-relevance.
Pi,t=α0+β1BVi,t+β2EPSi,t+εi,t (2)
Where for firm i and year t, Pi,t is the stock price at the end of year;
BVi,t is the book value of stock at the end of year; EPSi,t is the
earnings per share at the end of year; εi,t is the residuals.
The value-relevance is the explanatory power of regression (R2) from Equation (2). Large (small) R2 corresponds to more (less)
value-relevant earnings.
3.2.3. Conservatism
the association between accruals and cash flows modifying Basu (1997). We measure conservatism using Ball and Shivakumar’s (2005) model. ACC TotalAssets NOCF TotalAssets OCF i t i t i t i t i , , , , − − = + + 1 0 1 1 2
α β β ,,
, , , , * t i t i t i t i t TotalAssets NOCF TotalAssets OCF TotalA − − + 1 3 1 β
sssetsi t,−1+εi t,
(3)
Where for firm i and year t, and ACCi,t is accruals; NOCFi,t is a dummy variable, which takes 1 if OCFi,t is negative, otherwise 0; OCF is operating cash flows; εi,t is the residuals.
The degree of conservatism is the value of the incremental
coefficient (β3) from Equation (3). The larger (smaller) value of
the incremental coefficient (β3) is, the more (less) conservative earnings is.
3.2.4. Accruals quality
Dechow and Dichev (2002) and Mikhail et al.(2003) argue that earnings will be more representative of future cash flows when
accruals contain lower estimation error. We employ the following
Francis et al. (2005) model to measure accruals quality.
TCA TotalAssets OCF TotalAssets OCF i t i t i t i t i , , , , − − − = + + 1 1 1 1 2
α β β ,,
, , , , t i t i t i t i t TotalAssets OCF TotalAssets REV To − + − + + 1 3 1 1 4
β β ∆
ttalAssets PPE TotalAssets i t i t i t i t , , , , − − + + 1 5 1
β ε (4)
Where, TCA is firm i’s total current accruals in current year; OCF is operating cash flow; ∆REV is change in operating revenue; PPE is firm i’s property, plant and equipment.
Following Srinidhi and Gul (2007), our measure of accruals quality is the absolute value of estimated residuals (|εi,t|) from
Equation (4). Higher accruals quality is considered when accruals quickly convert into cash (Dechow and Dichev, 2002). Thus, in Equation (4), the residuals (εi,t) captures large uncertainty of accruals (the degree of accruals quality). Thus, the large (small)
values of the absolute value of the firm-level residuals (|εi,t|) is, the poorer (better) accrual quality is.
4. RESULTS AND DISCUSSION
4.1. Descriptive Statistics
Descriptive statistics of our earnings quality proxies is presented
in Table 1. For persistence, the mean (median) value of current
earnings is 0.057 (0.038), while the mean (median) value of previous earnings is 0.052 (0.039), respectively. This result can be explained as that the association between current and previous earnings in Korean firms is stable but low. Descriptive statistics
of the variables used to test value-relevance are represented in Panel B of Table 2. The mean value of stock price, book values
of stock and earnings per share (EPS) for the Korean firms have
positive values. All positive values of three variables suggest that
the most Korean firms are financially stable. For conservatism,
the mean value of total accruals are negative (−0.058) in Panel C
of Table 3. Since total accruals are calculated from net income, negative mean value of total accruals can be estimated as low net
income of Korean firms, resulting from low management outcome.
Panel D of Table 1 presents descriptive statistics of variables used in accruals quality. As similar to conservatism variables, the mean value of current accruals, previous, current and future operating
cash flows is positive. In Panel D of Table 1, the degree of accruals
quality (the absolute value of residuals) is 0.067 (mean) and 0.112
(median), respectively. Comparing with benchmark country,
accruals quality of Korean firms is relatively lower than U.S. firms. According to Dechow and Dichev (2002), accruals quality of U.S. firms is mean (median) values of 0.028 (0.020) as well as Francis et al. (2004) inform mean (median) values of 0.026 (0.019).
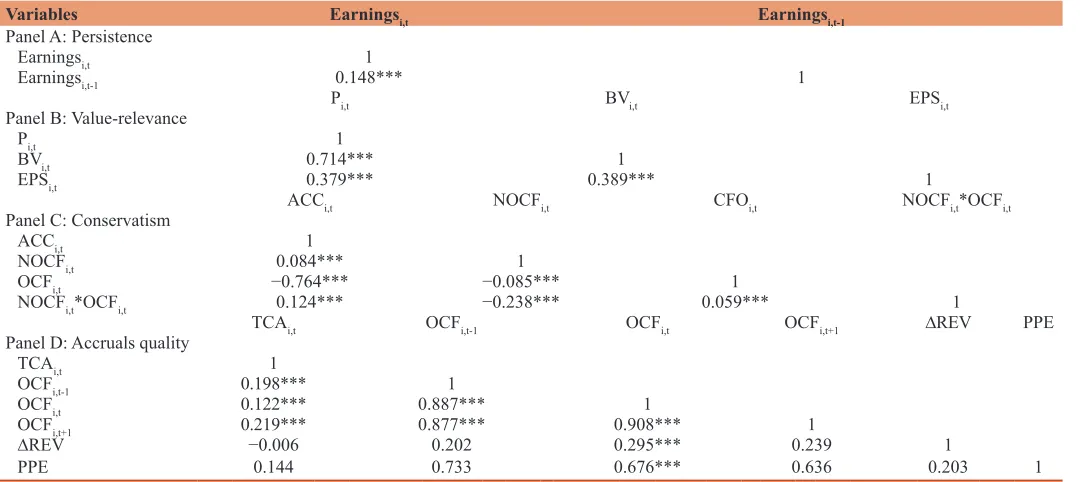
4.2. Correlation
The correlation between current and previous earnings is 0.148 at 0.01 levels shown in the Panel A of Table 1 so that no high
correlation exists. In Panel B of Table 2, book value and EPS
have highly correlated to stock price as expected. This result implies that stock price of Korean firms is significantly reflected
to book values and EPS. In the Panel C of Table 2, total accruals
and operating cash flow are negatively correlated (−0.764) similar to previous study (Dechow 1994; Ball and Shivakumar, 2005). The interaction term with negative operating cash flow dummy variable and operating cash flow shows positive correlation with total accruals (0.124). Panel D of Table 4 provides the correlation among variables used in accruals quality. Similar to previous
researches, previous, current and future operating cash flow are
highly correlated, but not highly correlated with current accruals.
4.3. Empirical Results
Panel A of Table 3 provides the result of persistence for firm-years during the period 1995-2006. Persistence, measured as the slope-coefficient (β1) from Equation (1) is 0.061 which is statistically significant at 0.01 levels. This result is highly close to zero which proposes that earnings of Korean firms are much less persistent and highly transitory. Hence, earnings quality as decision usefulness is significant low, thereby do not provide useful financial information
to stakeholders.
The degree of value-relevance for firm-years from 1995 to 2006
from Equation (2) is presented to Panel B of Table 3. The degree
of value-relevance is measured as the explanatory power of
regression (R2) from Equation (2) following Collins et al. (1997).
As shown in Panel C, the association between book values and EPS
are 0.534 and 0.502 and both are statically significant with stock price (P < 0.01), respectively. The degree of value-relevance (R2) is 52% which means that book values and EPS of Korean firms have jointly 52% explanatory power for Korean firms’ stock price during the period 1995- 2006. Comparing with U.S. firms’ However, the
firms is relatively low because Collins et al. (1997) report 75% of
the value-relevance (R2) during the period 1983-1993. Similar to persistence, the value-relevance of Korean firms is not high, thus
earnings quality as decision usefulness is low.
In Panel C of Table 3, empirical result of the degree of conservatism from Equation (3) is represented. Corresponding
with previous studies, the coefficient of current operating cash flow (β2) is significantly negative at 0.01 levels (−0.422). The degree of conservatism (β3), the interaction term with negative operating
cash flows dummy and current operating cash flow is positively significant (2.430) at 0.01 levels. The large (smaller) value of the incremental coefficient is, the more (less) conservatism is. The degree of conservatism (β3) of Korean firms is 2.430. Compare with U.K firms, the Korean firms’ conservatism is relatively
high. The degree of conservatism (β3) of U.K firms is 0.34 for 10 years (1990-2000) reported by Ball and Shivakumar (2005). Higher degree of conservatism might be impacted by strong legal
punishment caused by revised regulation for accounting fraud
from Korean government similar to the Sarbanes-Oxley Act 2002
(the SOX). Strong legal punishment and legal obligations from government or courts tend to reduce overstatement of earnings,
thereby reinforcing conservatism (Watts, 2003a; 2003b). In addition, Lobo and Zhou (2006) find that conservatism increases
after the SOX because of strong legal punishments and penalties
on firm’s top manager such as CEOs and CFOs. Thus, reinforced
regulation from Korean government plays an important factor to reduce over-estimated earnings, thereby increasing conservatism. The result of conservatism in this study accords with other similar studies.
Table 1: Descriptive statistics of four earnings quality proxies
Variables Mean Median Max Min SD
Panel A: Persistence
Earningsi,t 0.057 0.038 20.086 −5.451 0.561
Earningsi,t-1 0.052 0.039 61.256 −28.554 1.366
Panel B: Value-relevance
Pi,t 20872.37 5690.000 1223000 42.0000 72361.42
BVi,t 33473.35 15677.51 1302344 −840062.0 90503.62
EPSi,t 2325.783 795.0000 550012.0 −226179.0 17174.30
Panel C: Conservatism
ACCi,t −0.058 −0.054 10.412 −8.386 0.462
NOCFi,t 0.226 0.000 1.000 0.000 0.418
OCFi,t 0.112 0.092 19.505 −1.328 0.836
NOCFi,t*OCFi,t −6.08E-12 0.000 0.000 −1.75E-09 4.63E-11
Panel D: Accruals quality
TCAi,t 0.004 0.008 5.289 −4.395 0.249
OCFi,t-1 0.096 0.081 14.804 −2.242 0.601
OCFi,t 0.112 0.092 19.505 −1.328 0.836
OCFi,t+1 0.099 0.082 15.712 −2.319 0.622
∆REV 0.036 0.063 14.050 −27.880 0.865
|εi,t| 0.067 0.012 4.570 1.31E-05 0.247
SD: Standard deviation
Table 2: Pearson correlation of four earnings quality proxies
Variables Earningsi,t Earningsi,t-1
Panel A: Persistence
Earningsi,t 1
Earningsi,t-1 0.148*** 1
Pi,t BVi,t EPSi,t
Panel B: Value-relevance
Pi,t 1
BVi,t 0.714*** 1
EPSi,t 0.379*** 0.389*** 1
ACCi,t NOCFi,t CFOi,t NOCFi,t*OCFi,t
Panel C: Conservatism
ACCi,t 1
NOCFi,t 0.084*** 1
OCFi,t −0.764*** −0.085*** 1
NOCFi,t*OCFi,t 0.124*** −0.238*** 0.059*** 1
TCAi,t OCFi,t-1 OCFi,t OCFi,t+1 ∆REV PPE
Panel D: Accruals quality
TCAi,t 1
OCFi,t-1 0.198*** 1
OCFi,t 0.122*** 0.887*** 1
OCFi,t+1 0.219*** 0.877*** 0.908*** 1
∆REV −0.006 0.202 0.295*** 0.239 1
PPE 0.144 0.733 0.676*** 0.636 0.203 1
Panel D of Table 3 shows the result of accruals quality from
Equation (4). The coefficients of previous operating cash flow (β1)
and future operating cash flow and (β3) are positively significant at 0.01 levels, whereas the coefficient of operating current cash flow (β2) is significantly negative at 0.01 levels, consistent with previous research (Srinidhi and Gul 2007; Arthur et al., 2015). Moreover, the coefficient of future operating cash flows (β3) is
higher than that of previous operating cash flows (β1). It means
that future operating cash flow in Korean firms is more related to current accruals, compared to previous operating cash flow. However, changes in operating revenue (∆REV) and property, plant and equipment are statistically insignificant.
5. CONCLUSION
In this study, we examines earnings quality over time using a sample 9,584 firm-year observations listed on the KSE over twelve year periods (1995-2006). This study use earnings quality into two
dimensions: Decision usefulness, measured as persistence and value-relevance and stewardship (or accountability), measured as conservatism and accruals quality following the conceptual framework of the IFRS.
This study finds that earnings quality of Korean firms is relatively lower than that of benchmark countries except for conservatism. High degree of conservatism results from reinforced legal
punishments or penalties from government to reduce opportunistic
behaviors of firm’s management. However, overall earnings
quality is still low. The result of this study implies that Korean
firms engage in earnings management in the presence of economic
incentives, thereby reducing earnings quality. Practically, our
findings provide important implication for regulator of accounting
standard setting because analysis of financial statements is
meaningful indicator for economic efficiency of country.
We expect several contributions for accounting regulator and investors by providing empirical time-series analysis of financial
statements. Thus, this comprehensive investigation of earnings
quality provides more detailed insights into the role financial
reporting quality.
REFERENCES
Ali, A., Chen, T.Y., Radhakrishnan, S. (2007), Corporate disclosures by family firms. Journal of Accounting and Economics, 44(1), 238-286. Ali, A., Hwang, L.S. (2000), Country-specific factors related to financial
reporting and the value relevance of accounting data. Journal of Accounting Research, 38, 1-21.
Arthur, N., Tang, Q., Lin, Z.S. (2015), Corporate accruals quality during the 2008-2010 global financial crisis. Journal of International Accounting, Auditing and Taxation, 25, 1-15.
Ball, R., Kothari, S.P., Robin, A. (2000), The effect of international
institutional factors on properties of accounting earnings. Journal
of Accounting and Economics, 29(1), 1-51.
Ball, R., Robin, A., Wu, J.S. (2003), Incentives versus standards:
Properties of accounting income in four East Asian countries. Journal
of Accounting and Economics, 36(1), 235-270.
Ball, R., Shivakumar, L. (2005), Earnings quality in UK private firms:
Comparative loss recognition timeliness. Journal of Accounting and
Economics, 39(1), 83-128.
Balsam, S., Krishnan, J., Yang, J.S. (2003), Auditor industry specialization
and earnings quality. Auditing: A Journal of Practice and Theory,
22(2), 71-97.
Barth, M.E., Beaver, W.H., Landsman, W.R. (2001), The relevance of the value relevance literature for financial accounting standard setting: Another view. Journal of Accounting and Economics, 31(1), 77-104. Basu, S. (1997), The conservatism principle and the asymmetric timeliness
of earnings. Journal of Accounting and Economics, 24(1), 3-37.
Bushman, R., Smith, A. (2003), Transparency, financial accounting
information and corporate governance. Economic Policy Review,
9, 65-87.
Table 3: Empirical results of measuring earnings quality
Independent variables Predicted sign Coefficient t-statistics Adj R2 (F-statistics)
Panel A: Persistence
Equation (1) Dependent variable=Earningsi,t
Constant ? 0.054 5.328*** 0.023 (68.531***)
Earningsi,t-1 ± 0.061 8.279***
Panel B: Value-relevance
Equation (2) Dependent variable=Pi,t
Constant ? 1865.913 1.928 0.522 (1661.763***)
BVi,t ± 0.534 49.069***
EPSi,t ± 0.502 8.744***
Panel C: Conservatism
Equation (3) Dependent variable=ACCi,t
Constant ? −0.015 −2.523** 0.616 (1610.962***)
NOCFi,t ? 0.068 5.323***
OCFi,t - −0.422 −67.869***
NOCFi,t*OCFi,t + 2.430 15.856***
Panel D: Accruals quality
Equation (4) Dependent variable=TCAi,t
Constant ? −0.004 −0.715 0.092 (52.556***)
OCFi,t-1 + 0.110 4.489***
OCFi,t - −0.279 −10.829***
OCFi,t+1 + 0.235 10.652***
∆REV + 0.004 0.833
PPE - −0.005 −1.485
Boonlert-U-Thai, K., Meek, G.K., Nabar, S. (2006), Earnings attributes
and investor-protection: International evidence. The International
Journal of Accounting, 41(4), 327-357.
Collins, D.W., Maydew, E.L., Weiss, I.S. (1997), Changes in the
value-relevance of earnings and book values over the past forty years.
Journal of Accounting and Economics, 24(1), 39-67.
Dechow, P.M. (1994), Accounting earnings and cash flows as measures of firm performance: The role of accounting accruals. Journal of
Accounting and Economics, 18(1), 3-42.
Dechow, P.M., Dichev, I.D. (2002), The quality of accruals and earnings:
The role of accrual estimation errors. The Accounting Review,
77(S-1), 35-59.
Dechow, P.M., Schrand, C.M. (2004), Earnings Quality. Charlottesville,
Virginia: The Research Foundation of CFA Institute.
Entwistle, G.M., Phillips, F. (2003), Relevance, reliability, and the
earnings quality debate. Issues in Accounting Education, 18(1),
79-92.
Francis, J., LaFond, R., Olsson, P.M., Schipper, K. (2004), Costs of equity and earnings attributes. The Accounting Review, 79(4), 967-1010. Francis, J., LaFond, R., Olsson, P., Schipper, K. (2005), The market
pricing of accruals quality. Journal of Accounting and Economics,
39(2), 295-327.
Francis, J., Schipper, K. (1999), Have financial statements lost their relevance? Journal of Accounting Research, 37(2), 319-352. Hung, M. (2000), Accounting standards and value relevance of financial
statements: An international analysis. Journal of Accounting and
Economics, 30(3), 401-420.
International Accounting Standards Board. (2007), International Financial Reporting Standards. London: IASB Press.
Jonas, G.J., Blanchet, J. (2000), Assessing quality of financial reporting. Accounting Horizons, 14(3), 353-363.
Lev, B. (1989), On the usefulness of earnings and earnings research: Lessons and directions from two decades of empirical research. Journal of Accounting Research, 27, 153-192.
Lobo, G.J., Zhou, J. (2006), Did conservatism in financial reporting increase after the Sarbanes-Oxley act? Initial evidence. Accounting Horizons, 20(1), 57-73.
Mikhail, M.B., Walther, B.R., Willis, R.H. (2003), Reactions to dividend
changes conditional on earnings quality. Journal of Accounting,
Auditing and Finance, 18(1), 121-152.
Rezaee, Z. (2002), Financial Statement Fraud: Prevention and Detection.
New York: John Wiley & Sons, Inc.
Richardson, S.A., Sloan, R.G., Soliman, M.T., Tuna, A. (2001),
Information in Accruals about the Quality of Earnings. Working
Paper. Ann Arbor: The University of Michigan.
Schipper, K., Vincent, L. (2003), Earnings quality. Accounting Horizons, 17, 97-110.
Srinidhi, B., Gul, F. (2007), The differential effects of auditors’ non
audit and audit fees on accrual quality. Contemporary Accounting
Research, 24, 595-629.
Watts, R.L. (2003a), Conservatism in accounting part I: Explanations and implications. Accounting Horizons, 17(3), 207-221.