Issues
ISSN: 2146-4138
available at http: www.econjournals.com
International Journal of Economics and Financial Issues, 2019, 9(3), 105-115.
Capital Structure and the Profitability-Liquidity Trade-off
Osaretin Kayode Omoregie
1*, Sodik Adejonwo Olofin
2, Fredrick Ikpesu
31Lagos Business School, Pan-Atlantic University, Lagos, Nigeria, 2Obafemi Awolowo University, Ile-Ife, Nigeria, 3Pan-Atlantic
University, Lagos, Nigeria. *Email: komoregie@lbs.edu.ng
Received: 25 January 2019 Accepted: 05 April 2019 DOI: https://doi.org/10.32479/ijefi.7758
ABSTRACT
Theoretical guidance suggests a trade-off between profitability and liquidity in effect of capital structure decisions. This study investigates the link between capital structure and profitability-liquidity trade-off using descriptive and Panel-VAR analysis for 18 listed manufacturing companies in Nigeria. Findings from this study show no evidences of profitability-liquidity trade-off as function of capital structure. However, this study found that profitability and liquidity responds similarly to capital structure. Relative to equity share, debt ratios have negative effect on profitability and liquidity. Relative to asset, debt has positive effect on profitability and liquidity. Evidences further suggest that the way profitability and liquidity respond to
capital structure is reliant on the business cycle position of the economy. Finance managers are advised to keep abreast the economic trend in the
decision to adopt debt financing.
Keywords: Capital Structure, Profitability-Liquidity Trade-off, Panel-VAR
JEL Classifications: G00, G32, M21
1. INTRODUCTION
Financing and capital structure decision is critical to startup and going-concern of a business (Abor, 2005; Anthony and Odunayo, 2015). The choice of an appropriate mix of alternative capital sources and their tenures are key in achieving firm survival (Akhtar et al. 2016; Haque et al. 2014; Foyeke et al. 2016; Siddik et al. 2017). Myer (1984) classified the sources of finance to include the internal and external sources. The internal source is generated from retained earnings with no antecedent cost while the external source is generated from debt and equity with associated cost (Frank and Goyal, 2003; Akinyomi and Olagunju, 2013). Retained earnings however do not appear too significant for investment outlay (Anderson and Carverhill, 2010; Uremadu and Efobi, 2012), thus, leaving capital structure decision to debt and equity. Capital structure refers to how firm investment is financed using either equity or debt or proportionate mix of both (Sarlija and Harc, 2012; Ghasemi and Ab-Razak, 2016; 2017; Vy and Nguyet,
2017; Olusuyi and Felix, 2017; Burksaitiene and Draugele, 2018). Capital structure appears to be the most investigated topic in finance in the literature, especially the debt-equity trade-off which is fundamental to firm’s financial and overall performance (Udomsirikul et al. 2010; Bandyopadhyay and Barua, 2016; Siddik et al. 2017; Welch, 2017). As businesses are continuously exposed to different risk situations, the implication of capital structure is inherent in the liquidity and profitability targets and outcomes and default risk exposure of the firm. Past experience has shown that inappropriate debt-equity mix can lead to excruciating financial burdens and eventual distress of firms (Rajan and Zingales, 1995; Uremadu, 2012; Dahiru et al. 2016).
Studies have shown also that the cost of debt finance is lower compared to equity financing, and has attendant higher profitability and share price improvement effects (Modigliani and Miller, 1963; Anderson and Carverhill 2010; Ardalan 2016). Rajan and Zingales (1995) documented that firms using sub-optimal capital structure (excessive debt or equity in the mix of capital) have the tendency
to suffer from a variety of financial ailments, which could result in high taxes, high proportions of accounts payable, large cash-flow deficits and eventual default risk and possible bankruptcy. On the other hand, given the tax deductibility advantage of debt, increasing debt is profitable but at the risk of liquidity crisisand the increased risk and cost of bankruptcy. Liquidity however is favored with the reduction of debt but profitability is hampered. This is the so-called classic profit-liquidity trade-off in capital structure decision (Baskin, 1989; Anderson and Carverhill, 2010). Extant literature has focused on the determinants of capital structure (Lipson and Mortal, 2009; Anderson and Carverhill, 2010; Udomsirikul et al. 2010; Akinyomi and Olagunju, 2013; Anthony and Odunayo, 2015; Sharma and Paul, 2015; Ghasemi and Ab-Razak, 2016), and the impact of capital structure on profitability/ performance and possibly liquidity as a control variable (Rajan and Zingales, 1995; Uremadu, 2012; Ebimobowei et al. 2013; Olaniyi et al. 2015; Akhtar et al. 2016; Dahiru et al. 2016; Foyeke et al. 2016; Vy and Nguyet, 2017). Meanwhile, the trade-off between debt and equity component of capital structure does significantly impact on the trade-off between profitability and the risk of bankruptcy associated with liquidity (Rajan and Zingales, 1995; Anderson and Carverhill 2010; Burksaitiene and Draugele, 2018). The literature does appear silent about these trade-offs in terms of supporting or contradicting evidences. This apparent gaps in the literature has motivated this study. Moreover, the peculiar problem with businesses across the globe and particularly emerging markets like Nigeria where manufacturing firms often times have liquidity issues given that a large proportion of their liquid asset exists as inventory and receivables, makes a potential interesting sector to investigate. Hence, this study investigates the dynamic link between capital structure and profitability-liquidity trade-off in the Nigerian manufacturing sector. Evidence from this study will be useful for finance managers to better understand capital structure management.
The rest of the paper is organized as follows; sections two to six presents the theory and review of literature, data and methodology, empirical result, discussion, implication and recommendation, and conclusions respectively.
2. THEORY AND REVIEW OF LITERATURE
Capital structure as noted by Uremadu and Efobi (2012) and Siddik et al. (2017) is the combination of a company’s preferred choice of equity and debt capital and is mainly conceptualized as the mix of long-term debt and equity. A leading theory of capital structure is the Theory of Capital Structure Irrelevance by Modigliani and Miller (1958) who posited that the capital structure does not have any impact on firm value. They opined that differences in debt and equity components of the capital structure is just of nomenclature as they are just streams of cash-flows to run a business. Irrespective of the mix, all that is important is to have the required level of finance and that does not affect the firm performance.
Earlier before 1910 corporate tax was not an issues and following the need for re-evaluation of the assumptions of the irrelevancy theory, the Static Trade-off Theory by Modigliani and Miller
(1963) and Miller (1977) provided a basis for consideration of profitability and liquidity trade-off. They showed that there are optimal capital structures by trading off the benefits and cost of debt and equity with debt having the benefit of deductible taxes on interest which culminates to profitability and associated cost of liquidity crisis. Accordingly, an optimal capital structure is reached at the point where the present value of the cost of debt is being offset by the marginal value of benefit associated with acquiring such debt.
Furthermore, Myers (1984) and Myers and Majluf (1984) proposed the pecking order theory of capital structure, which suggests that debt and equity as external finance have cost implication, mainly information cost, and information cost of equity appears the most expensive. The theory posits that the use of retained earnings to finance operations comes with the minimum possible cost and managers would prefer to choose retained earning first before debt and equity. Jensen and Meckling (1976) proposed the agency cost theory, which suggests that the conflict of interest of managers and shareholders will yield agency cost and prompts managers to use debt more than equity. In order to cub managers’ excesses from pursuing a personal goal, the agency theory becomes handy.
Discussions on capital structure have appeared in a series of empirical works across the globe. As reflected in relevant and related financial ratios, theoretical findings have emphasized the positive influence of debt on profitability and expected deterioration of liquidity position (Modigliani and Miller, 1963; Jensen and Meckling, 1976; Myers, 1984, Myers and Majluf, 1984). However, other empirical evidence have shown mixed results (Abor, 2005; Sarlija and Harc, 2012; Olaniyi et al. 2015; Foyeke et al. 2016; Vo and Ellis, 2017).
Booth et al. (2001) concluded that the capital structure of companies affects their performance equally across the developed and developing economies. Contrary to theoretical guidance, they found that irrespective of the composition of the capital structure, the higher the profitability of the firm, the lower the debt ratio (i.e. profitable firms used less debt since they had sufficient retained earnings). Hennessy and Whited (2005) offered a similar opinion that firms with higher profitability have to make decisions based on internal-debt financing as they have some level of retained earnings. However, firms with lower profitability are often faced with debt-equity financing decision as their earning falls short of their investment plan, therefore the need for external funding is expedient and debt ratio tend to increase. By so doing, these studies rather confirmed the pecking order theory as against the trade-off theory.
Haque et al. (2014), capital structure and debt-equity ratio have a negative influence on the firm’s value as against the positive influence of debt relative to asset. Velnampy and Anojan (2014), as well as Dahiru et al. (2016) also presented findings that suggest a significant but inverse effect of capital structure on profitability and financial performance. Likewise, Foyeke et al. (2016) presented findings that suggest negative effect of various debt indicators on financial performance of listed manufacturing firms in Nigeria. Similarly, findings by Vo and Ellis (2017) revealed significant negative relationship between leverage and cumulative abnormal returns of the Vietnamese Ho Chi Minh City stock exchange during the period 2007–2013. Likewise, Vy and Nguyet (2017) on the relationship between capital structure and performance of non-financial firms in Vietnam indicated that all the debt ratios considered in the study have a negative relationship with firm performance. Olusuyi and Felix (2017) while investigating the effect of capital structure on financial performance of manufacturing firms in Nigeria within the period of 2008 and 2014 also revealed that debt-equity ratio had a statistically significant negative effect on ROA while insignificant to ROE. These negative findings downplay theoretical guidance on capital structure that emphasized increased profitability advantage of debt capital having the benefit of tax-deductibility. It also refutes the profitability-liquidity trade-off; given the negative effect of debt on profitability, liquidity could not have fared any better.
In congruence to theoretical guidance, Negasa (2016) argued by investigating the effect of capital structure on firms’ profitability in Ethiopian manufacturing sector, that there is significant positive relationship between firms’ profitability and debt-ratio. Using ROA, ROE and earning per share as proxy for financial performance of textile industry in Pakistan, Mujahid and Akhtar (2014) also showed that capital structure have a positive impact on financial performance. In a Pearson’s correlation coefficient and ordinary least squares regression model estimations on a pooled time series data, Akhtar et al. (2016), as well as Nigerian authors Akinyomi and Olagunju (2013), and Anthony and Odunayo (2015) also submitted that there is a positive relationship between leverage and profitability. That being the case, they suggest that increasing debt is profit oriented and there could be associated trade-off with profitability as the studies are silent about liquidity.
In addition, Udomsirikul et al. (2010) demonstrated that as leverage in the capital structure increase, liquid asset shrinks and higher liquidity is associated with lower leverage. Their result suggests that liquidity and leverage are inversely related, emphasizing the trade-off between profitability and liquidity. Likewise, Lipson and Mortal (2009) found that an inverse and mostly monotonic relationship between liquidity and leverage, suggesting firms with more liquid assets have lower leverage and are more likely to choose equity over debt. By implication increasing debt is associated with liquidity crisis though with potential to increase profitability. Difference in the structure of liquidity indicators influenced the findings of Ghasemi and Ab-Razak (2016). They found quick-ratio and leverage to be positively related, while current ratio still confirms established theoretically knowledge
of negative relationship. Research findings from Burksaitiene and Draugele (2018) showed that the more the equity component of the capital structure of a company, the lesser is the liquidity risk, while the more debt component of the capital structure, the higher is the risk, thereby, completely supporting the profit-liquidity trade-off assertion.
In summary, the extant literature has presented mixed findings on how capital structure influence profitability and liquidity as captured by a series indicators. Though theoretical explanations could be inferred from the reviewed studies, there is dearth of evidence on the trade-offs between profitability and liquidity as a function of capital structure. It is therefore expedient to understand capital structure decision and how it affects the profitability and liquidity trade-off. This study seeks to fill this gap especially by taking into consideration their behavior relative to business cycle and response of share price.
3. DATA AND METHODOLOGY
3.1. Data
Based on the availability of data, the study employed annual time series data which was sourced from the reported annual financial statement of 18 manufacturing firms listed in the NSE from the period 2005 to 2017. Each of the variables is captured using two indicators.
Following existing studies in the literature, capital structure is measured using total debt-equity ratio (TDE) and total debt-total asset ratio (TDTA). Liquidity is measured using quick ratio (QRA) and earnings before interest and tax (EBIT), to sales ratio (EBSL) while profitability is captured using Return on Equity (ROE) and profit before tax-sales ratio (PBTS) other variables of interest are economic growth (RGDPG), all share index (ALSI) of the NSE and Companies’ Share Price (SHPR).
3.2. Estimation Techniques
This study adopts both descriptive and econometric method of analysis to establish the dynamic relationship between capital structure, liquidity, and profitability. The descriptive analysis includes the use of graphs while the econometric analysis is used to establish some facts about the variables of interest. The econometric method employed to establish how the capital structure influences the trade-off between profitability and liquidity is the panel vector autoregressive (PVAR) framework.
3.2.1. PVAR model
Common issue with a panel analysis is the presence of heterogeneity across the cross-sections (Arellano and Bover, 1995). The PVAR framework analyzes the time and cross-sectional variation in a dataset and has the advantage of taking into consideration unobserved individual and time heterogeneity (Love and Zicchino, 2006). As with standard VAR models, all variables in the PVAR model is expressed as lag model of all the endogenous variable (Koutsomanoli-Filippaki and Mamatzakis, 2009). Accordingly, individual specific terms are introduced to account for such difference in parameters which differentiates the PVAR from the standard time series VAR. Therefore, the PVAR model is expressed generally as.
1 , 1, 2,..., , 1, 2,...,
t i it− it i N t T
Χ = + ΦΧ + = = (1)
Where Xit represents the vector of random endogenous variables, Φ represents an (n×n) matrix of coefficients, μi is a vector of individual effects and εit vector of white-noise error terms. Estimation of the PVAR model follows the system-based generalized method of moment estimator as suggested by Arellano and Bover (1995). Inferences are made based on the impulse response function (IRF) and variance decomposition (VDC) estimation of the PVAR. Estimation of the IRF and VDC requires some level of identification which is tackled by arranging the variables in an order of preference so as to make sure that the more exogenous variables impact on the more endogenous ones in a sequential order (Love and Zicchino, 2006).
4. DATA ANALYSIS AND DATA
ESTIMATION
4.1. Descriptive Analysis
Figure 1 presents the trend of the industrial average of each of the variables used to capture capital structure, profitability and liquidity alongside growth in companies’ share price, stock index growth and economic growth. Capital structure variables represented by TDE and TDTA as shown in the first two rows of the figure indicates that both variables (TDE and TDTA) move in a similar direction. However, profitability variables as presented in the third and fourth rows captured by PBTS and ROE seem to have moved in opposite at some time but inline most times within the study period. Nevertheless, liquidity variables as presented in the fifth and six row, captured by EBIT-EBSL and QRA appear to have moved in the same direction except for divergence in proportion. Other three rows present the trend of economic growth (RGDPG), industry share price growth (SHPR) and stock market index (ALSI) growth.
Relative to each other, capital structure variables move together with ROE and move together with PBTS most times and does not in other time as measures of profitability. On the other hand, there is an observable direct pattern between capital structure variables and liquidity variables. This is suggesting some level of direct response of profitability and liquidity to capital structure. As debt increases profitability increase as well as liquidity. The other dimension to this is that during the period of the global financial
crisis (GFC) (2007-2009), the economy of Nigeria responded with slower growth, TDE fell considerable all through until 2010. Meanwhile, TDTA increased in 2007 and followed similar trend as TDE until 2010. This suggests that at the advent of the GFC, the manufacturing firm in Nigeria responded by reducing their debt profile relative to equity and asset to adjust to the shocks created by the GFC. During that period, profitability variables increased from 2007 to 2008 but fell in 2009 while responding to slow growth. Liquidity variables, especially QRA declined considerably from 2007 to 2008 following the GFC and remained stables at considerably low value till 2010. Meanwhile, EBSL increased till 2008 but fell drastically afterward and remain stable at the low level until 2016. As observed in the last panel of Figure 1, though the share prices of the manufacturing companies fell, they outperformed the market as growth in share prices is higher than that of the stock market. The take away from this is that during the GFC as translated to sluggish economic performance, firms downsize their debt profile following the economic downturn, and profitability as well as liquidity responds in similar direction as that of capital structure.
Similarly, during the recent economic recession that was orchestrated by oil price slump in 2014, debt profile of manufacturing firms decreased considerably between 2014 and 2016. Similar to the GFC period, this was associated with declining profitability as PBTS and ROE decline from the top in 2013 to bottom low in 2015. Given that firms are yet to fully recover from the GFC, liquidity remains at a lower level. But then, during the period of 2010-2013 period of stable economic growth, it is observable that increasing debt is associated with increasing profitability and liquidity.
4.2. Panel Unit Root and Cointegration Tests
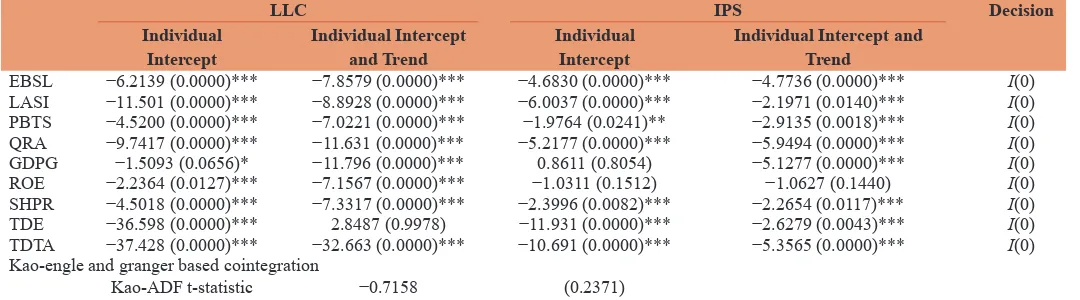
Table 1 presents the results of the LLC and IPS unit root tests alongside the Kao cointegration test results. Results from the LLC show that all the variables considered are stationary at levels except for TDE that is non-stationary with intercept and trend included. However, the IPS that account for such difference in intercept and trend suggest otherwise that TDE is stationary at levels. This is shown by the asterisk signs on the test values and P-values in parenthesis. The IPS also suggested that all the variables are stationary at levels except for ROE. This suggests some level of difference in the intercept and slope of each of the firms in terms of their ROE. Nevertheless, we can conclude stationary for the variables since they both conflict only on one variable and proceed to adopt the Kao residual-based cointegration test. Also, the Kao test shows that there is no cointegration among the variables as the P-value is far >0.05. As such, we cannot reject the null of no cointegration. Therefore we can proceed to adopt the PVAR to estimate the relationship between the variables of interest.
4.3. PVAR Estimation and Causality 4.3.1. Impulse response
A similar response is observed for PBTS. This suggests that relative to equity, increasing debt decline profitability and increasing debt relative asset leads to increasing profitability at least in the short-term. The figure further shows that EBSL
influences ROE negatively while QRA has a positive influence on ROE. On the other hand, PBTS responds negatively to liquidity variables. The implication of this is that liquidity affects profitability negatively. Furthermore, economic growth and ALSI
is revealed to influence ROE and PBTS negatively. In addition, firms share prices have been revealed to affect profitability positively as the response of ROE and PBTS to share price moves toward the positive direction.
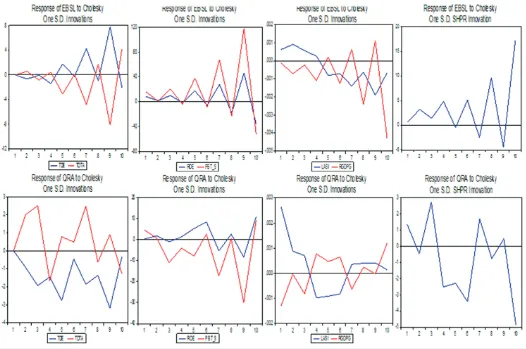
Figure 3 presents the response of EBITS and QRA as a measure of liquidity in the model. EBITS instantaneously responds negatively to TDE and positively to TDTA with respective reversal while QRA responds negatively to TDE and positively to TDTA. This suggests that in the short term,
increasing debt relative to equity will have a negative effect on liquidity but subsequently will improve the liquidity position. However, relative to assets, debt ratio is positively related to liquidity. EBSL responds positively to ROE and PBTS while QRA response is negative to PBTS and oscillatory with ROE. EBSL responds negatively to ALSI and economic growth while QRA initially responds negatively but reverses to a positive direction and oscillatory with economic growth. Also, EBSL responds positively to company share price and QRA response is oscillatory.
Figure 2: Impulse response of profitability variables (return on equity and Profit before tax/sales)
Table 1: Panel unit root and cointegration tests
LLC IPS Decision
Individual
Intercept Individual Intercept and Trend Individual Intercept Individual Intercept and Trend
EBSL −6.2139 (0.0000)*** −7.8579 (0.0000)*** −4.6830 (0.0000)*** −4.7736 (0.0000)*** I(0)
LASI −11.501 (0.0000)*** −8.8928 (0.0000)*** −6.0037 (0.0000)*** −2.1971 (0.0140)*** I(0)
PBTS −4.5200 (0.0000)*** −7.0221 (0.0000)*** −1.9764 (0.0241)** −2.9135 (0.0018)*** I(0) QRA −9.7417 (0.0000)*** −11.631 (0.0000)*** −5.2177 (0.0000)*** −5.9494 (0.0000)*** I(0) GDPG −1.5093 (0.0656)* −11.796 (0.0000)*** 0.8611 (0.8054) −5.1277 (0.0000)*** I(0) ROE −2.2364 (0.0127)*** −7.1567 (0.0000)*** −1.0311 (0.1512) −1.0627 (0.1440) I(0) SHPR −4.5018 (0.0000)*** −7.3317 (0.0000)*** −2.3996 (0.0082)*** −2.2654 (0.0117)*** I(0) TDE −36.598 (0.0000)*** 2.8487 (0.9978) −11.931 (0.0000)*** −2.6279 (0.0043)*** I(0) TDTA −37.428 (0.0000)*** −32.663 (0.0000)*** −10.691 (0.0000)*** −5.3565 (0.0000)*** I(0) Kao-engle and granger based cointegration
Kao-ADF t-statistic −0.7158 (0.2371)
Figure 4 presents the response of capital structure variables to variables in the model. It is revealed that responses of TDE to profitability, liquidity, ALSI, economic growth and company share price are quite oscillatory. Meanwhile, TDTA responds negatively to profitability; it responds negatively to liquidity in the short term but reverse, oscillatory with economic growth and share price, and positively to ALSI. In addition, Figure 5 presents the response of share price to variables in the model. It is revealed that share price responds positively to TDE but negatively to TDTA. Share price responds positively to profitability, negatively to liquidity and negatively to economic growth and ALSI.
4.3.2. VDC
The VDC is used to present the contributions of each variable in percentage to variations in the PVAR system. Appendix 1-4 present the VDC of each variable. It is revealed that PBTS contributes significantly to changes in ROE followed by company share price movement, TDTA, and EBTS in that order. But then, only ROE contributes significantly to changes in PBTS. Profitability variables are the major contributors to changes in liquidity variables; ROE and PBTS contributed over 90% of changes in EBSL and about 85% of changes in QRA. Also, profitability variables contribute immensely to change in the capital structure variables as ROE and PBTS together contribute over 90% of changes in TDE and over 86% of TDTA. VDC for share price also shows that profitability
variables are the most important variables that motivate changes in share price.
5. DISCUSSION, IMPLICATIONS AND
RECOMMENDATIONS
Conventional guidance on capital structure has emphasized the trade-off between profitability and liquidity as a function of capital structure decision. Evidences from this study depart from this guidance which is a fundamental divergence from theory. Descriptive analysis of the data has shown that variables used to capture profitability, liquidity and capital structure move together. That is, debt, liquidity and profitability ratios increase and decrease together, and most importantly profitability and liquidity respond similarly to capital structure. As such, direct relationship is established between capital structure-profitability and capital structure-liquidity. The descriptive analysis shows that the response of profitability and liquidity to capital structure is sequel to the business cycle position of the economy. In periods of economic boom, increasing debt is associated with increasing profitability and increasing/at least stable liquidity. Also, in an economic downturn, increasing debt is associated with a drop in profitability and depletion in the liquidity level. It is also important to note that during periods of growth, share price of manufacturing companies in Nigeria out-performed the entire market.
Inferences from the PVAR further emphasized that liquidity and profitability respond similarly to capital structure decision. It was revealed contrary to theoretical guidance of positive effect, debt relative to equity is negatively related to profitability and liquidity - increasing debt is detrimental to profitability and liquidity. This finding appeared similar to those of Ebimobowei et al. (2013), Twairesh (2014), Velnampy and Anojan (2014) and Dahiru et al. (2016) who emphasized negative effect of capital structure on profitability/
performance, and Lipson and Mortal (2009) and Udomsirikul et al. (2010) who found negative effect of leverage on liquidly. But studies such as Mujahid and Akhtar (2014), Negasa (2016) and Anthony and Odunayo (2015) reported contrary finding concerning profitability and Ghasemi and Ab-Razak (2016) concerning liquidity.
On the other hand, relative to asset, increasing debt has positive effect on profitability and liquidity which suggests as debt-asset
Figure 4: Impulse response of capital structure variables (total debt-equity ratio and total debt-total asset ratio)
ratio increases profitability and liquidity increases. This negates findings of literature mentioned earlier. It can be inferred that profitability influence liquidity positively and liquidity either make the position of profitability uncertain or affect negatively. It was further revealed that capital structure decision relative to profitability, liquidity and other variables is oscillatory. This reflects the haphazard nature of capital structure decision making. The implication of these findings is that the theoretical guidance of trade-off between profitability and liquidity in effect of capital structure changes is not supported by the Nigerian data. Rather, the differing implications of debt relative to the equity share of capital and that of asset dictate the direction for influence on profitability and liquidity, and both are affected in similar manner. Moreover, the condition of the economy as a whole in terms of boom and burst have serious implication on the movement of liquidity and profitability. In recession, liquidity and profitability are declining while in boom they are both increasing just as the capital structure too. Just like some studies that have reported similar result, this could be attributed to inefficient capital structure management and possible uninformed hedging strategies among managers that make the liquidity and profitability position move together.
For managerial decision, increasing debt concentration in capital structure is desirable for profitability, liquidity and share prices of manufacturing firms in Nigeria. However, the economic cycle should be observed. During economic boom, rising debt is associated with rising profitability and liquidity as well as share prices out-performing the market. Meanwhile, in recession, rising debt is associated with falling profitability and liquidity. This suggests that there is a pay-off for incurring debt in boom and manufacturing companies are punished for such move in periods of recession. Therefore, the finance manager should be abreast of the current economic trend in motivating the level of debt in the capital structure.
6. CONCLUSION
Capital structure decision is critical to the efficient running of a firm and has implication for profitability and liquidity. Theoretical guidance suggests a trade-off between profitability and liquidity in effect of capital structure decisions. This study is motivated by the dearth of empirical literature validating this notion. Descriptive analysis and PVAR model using the impulse response and VDC was used to establish the links. Evidences from this study refuted the profitability-liquidity trade-off as function of capital structure. However, this study found that profitability and liquidity responds similarly to capital structure. Relative to equity share of the capital structure, debt ratios have negative effect on profitability and liquidity. Relative to asset increasing debt has positive effect on profitability and liquidity.
Evidences further suggest that the way profitability and liquidity respond to capital structure is reliant on the business cycle of the economy. During economic boom, profitability and liquidity increase alongside increasing debt profile and otherwise during economic downturn. Finance managers are advised to keep abreast
the economic trend in the decision to adopt debt financing. This study however focuses on the manufacturing sector in Nigeria, given the differing financial policy challenges of different sectors, further research is required on other sectors. This is because generalization based on the manufacturing sector might be misleading for them.
REFERENCES
Abor, J. (2005), The effect of capital structure on profitability: An empirical analysis of listed firms in Ghana. The Journal of Risk Finance, 6(5), 438-445.
Abor, J. (2007), Debt policy and performance of SMEs: Evidence from Ghanaian and South African firms. The Journal of Risk Finance, 8(4), 364-379.
Akhtar, N., Bano, M., Bano, S., Zia, H.T., Jameel, N. (2016), Capital
structure impact on banking sector performance in Pakistan.
International Review of Management and Business Research, 5(2), 519-535.
Akinyomi, O.J., Olagunju, A. (2013), Determinants of capital structure
in Nigeria. International Journal of Innovation and Applied Studies,
3(4), 999-1005.
Anderson, R.W., Carverhill, A. (2011), Corporate liquidity and capital structure. The Review of Financial Studies, 25(3), 797-837. Anthony, A., Odunayo, O. (2015), Determinants of capital structure in
Nigerian quoted composite insurance companies. Global Journal of Management and Business Research, 15(10), 6-16.
Ardalan, K. (2017), Capital structure theory: Reconsidered. Research in International Business and Finance, 39, 696-710.
Arellano, M., Bover, O. (1995), Another look at the instrumental variable
estimation of error-components models. Journal of Econometrics,
68(1), 29-51.
Bandyopadhyay, A., Barua, N.M. (2016), Factors determining capital
structure and corporate performance in India: Studying the business
cycle effects. The Quarterly Review of Economics and Finance, 61, 160-172.
Baskin, J. (1989), An empirical investigation of the pecking order hypothesis. Financial Management, 18(1), 26-35.
Booth, L., Aivazian, V., Demirguc‐Kunt, A., Maksimovic, V. (2001),
Capital structures in developing countries. The Journal of Finance,
56(1), 87-130.
Burksaitiene, D., Draugele, L. (2018), Capital structure impact on liquidity
management. International Journal of Economics, Business and
Management Research, 2(1), 110-127.
Dahiru, I., Dogarawa, A.B., Haruna, M.A. (2016), Effect of capital structure on financial performance of listed manufacturing firms in Nigeria. Nigerian Journal of Management Technology and Development, 7(2), 87-97.
Ebimobowei, A., Okay, O.E., Binaebi, B. (2013), Capital structure and the operating performance of quoted firms in the Nigerian stock exchange. Research Journal of Finance and Accounting, 4(5), 6-22. Foyeke, O.I., Olusola, F.S., Aderemi, A.K. (2016), Financial structure and
the profitability of manufacturing companies in Nigeria. Journal of Accounting, Finance and Auditing Studies, 2(3), 56-63.
Frank, M.Z., Goyal, V.K. (2003), Testing the pecking order theory of capital structure. Journal of Financial Economics, 67(2), 217-248. Ghasemi, M., Razak, N.H.A. (2016), The impact of liquidity on the
capital structure: Evidence fromMalaysia. International Journal of Economics and Finance, 8(10), 130-139.
Hennessy, C.A., Whited, T.M. (2005), Debt dynamics. The Journal of Finance, 60(3), 1129-1165.
policy on value of the firm a study on some selected corporate manufacturing firms under Dhaka stock exchange. Ecoforum Journal, 3(2), 77-84.
Im, K.S., Pesaran, M.H., Shin, Y. (2003), Testing for unit roots in heterogeneous panels. Journal of Econometrics, 115(1), 53-74. Jensen, M.C., Meckling, W.H. (1976), Theory of the firm: Managerial
behavior, agency costsand ownership structure. Journal of Financial
Economics, 3(4), 305-360.
Kao, C., Chiang, M.H., Chen, B. (1999), International R and D spillovers:
An application of estimation and inference in panel cointegration.
Oxford Bulletin of Economics and Statistics, 61(S1), 691-709. Koutsomanoli-Filippaki, A., Mamatzakis, E. (2009), Performance and
merton-type default risk of listedbanks in the EU: A panel VAR approach. Journal of Banking and Finance, 33(11), 2050-2061. Levin, A., Lin, C.F., Chu, C.S.J. (2002), Unit root tests in panel data:
Asymptotic and finite-sample properties. Journal of Econometrics, 108(1), 1-24.
Lipson, M.L., Mortal, S. (2009), Liquidity and capital structure. Journal of Financial Markets, 12(4), 611-644.
Love, I., Zicchino, L. (2006), Financial development and dynamic investment behavior: Evidence from panel VAR. The Quarterly Review of Economics and Finance, 46(2), 190-210.
Miller, M.H. (1977), Debt and taxes. The Journal of Finance, 32(2), 261-275.
Modigliani, F., Miller, M.H. (1958), The cost of capital, corporation finance and the theory of investment. The American Economic Review, 48(3), 261-297.
Modigliani, F., Miller, M.H. (1963), Corporate income taxes and the cost of capital: A correction. The American Economic Review, 53(3),
433-443.
Mujahid, M., Akhtar, K. (2014), Impact of capital structure on firms financial performance and shareholders wealth: Textile sector of Pakistan. International Journal of Learning and Development, 4(2), 27-33.
Myers, S.C. (1977), Determinants of corporate borrowing. Journal of Financial Economics, 5(2), 147-175.
Myers, S.C. (1984), The capital structure puzzle. The Journal of Finance, 39(3), 574-592.
Myers, S.C., Majluf, N.S. (1984), Corporate financing and investment decisions when firms have information that investors do not have. Journal of Financial Economics, 13(2), 187-221.
Negasa, T. (2016), The Effect of Capital Structure on Firms’ Profitability (Evidenced from Ethiopian). Unpublished Master’s Thesis.
Olaniyi, T.A., Elelu, M.O., Abdulsalam, T.S. (2015), Impact of capital
structure on corporate performance: A pre and post crisis evaluation of selected companies in US. International Journal of Accounting
Research, 42(2441), 1-20.
Olusuyi, A.E., Felix, A.E. (2017), The effect of capital structure on the financial performance of manufacturing firms in Nigeria (2008-2014). Journal of Accounting and Financial Management, 3(3), 37-48.
Rajan, R.G., Zingales, L. (1995), What do we know about capital
structure? Some evidence from international data. The Journal of
Finance, 50(5), 1421-1460.
Sarlija, N., Harc, M. (2012), The impact of liquidity on the capital structure: A case study of Croatian firms. Business Systems Research
Journal: International Journal of the Society for Advancing Business
and Information Technology (BIT), 3(1), 30-36.
Siddik, M.N.A., Kabiraj, S., Joghee, S. (2017), Impacts of capital structure
on performance of banks in a developing economy: Evidence from
Bangladesh. International Journal of Financial Studies, 5(2), 1-18. Twairesh, A.E.M. (2014), The impact of capital structure on firm’s
performance evidence from Saudi Arabia. Journal of Applied Finance
and Banking, 4(2), 183-190.
Udomsirikul, P., Jumreornvong, S., Jiraporn, P. (2011), Liquidity and
capital structure: The case ofThailand. Journal of Multinational Financial Management, 21(2), 106-117.
Uremadu, S.O. (2012), Bank capital structure, liquidity and profitability
evidence from the Nigerian banking system. International Journal
of Academic Research in Accounting, Finance and Management Sciences, 2(1), 98-113.
Uremadu, S.O., Efobi, U.R. (2012), The impact of capital structure and liquidity on corporate returnsin Nigeria: Evidence from
manufacturing firms. International Journal of Academic Research in Accounting, Finance and Management Sciences, 2(3), 1-16. Velnampy, T., Anojan, V. (2014), Capital structure, liquidity position and
their impact on profitability: A study of listed telecommunication firms in Colombo stock exchange (CSE), Sri Lanka. Research Journal of Finance and Accounting, 5(9), 131-139.
Vo, X.V., Ellis, C. (2017), An empirical investigation of capital structure and firm value in Vietnam. Finance Research Letters, 22, 90-94. Vy, L.T.P., Nguyet, P.T.B. (2017), Capital structure and firm performance:
Empirical evidence from asmall transition country. Research in International Business and Finance, 42, 710-726.
Welch, I. (2017), Corporate Finance an Introduction. 5th ed. California:
APPENDIXES
Appendix 1: VDC for profitability
Period S.E. ROE PBTS LASI RGDPG SHPR EBSL QRA TDE TDTA
ROE
1 26.203 100 0 0 0 0 0 0 0 0
4 34.353 87.92 1.222 0 0 8.335 0.693 0.053 0.343 1.439
8 38.760 74.20 7.756 0 0 7.403 3.755 0.584 1.565 4.735
12 47.949 54.03 29.89 0 0 6.405 2.999 0.574 1.847 4.264
PBTS
1 18.544 25.24 74.76 0 0 0 0 0 0 0
4 30.601 21.74 73.87 0 0 2.964 0.576 0.695 0.092 0.064
8 95.018 17.17 79.07 0 0 1.725 0.484 0.894 0.277 0.382
12 315.15 17.10 79.77 0 0 1.527 0.181 0.723 0.303 0.389
PBTS: Profit before tax-sales ratio, EBIT: Earnings before interest and tax Earnings before to sales rat, QRA: Quick ratio, ROE: Return on equity, TDE: Total debt-equity ratio, TDTA: Total debt-total asset ratio, VDC: Variance decomposition
Appendix 2: VDC of liquidity variables
Period S.E. ROE PBTS LASI RGDPG SHPR EBSL QRA TDE TDTA
EBSL
1 18.538 20.43 77.56 0 0 0.147 1.866 0.000 0.000 0.000
4 30.655 18.77 74.38 0 0 3.857 1.941 0.655 0.261 0.133
8 96.174 17.27 78.55 0 0 1.750 0.686 0.881 0.266 0.399
12 319.99 17.16 79.74 0 0 1.510 0.196 0.697 0.301 0.395 QRA
1 18.719 0.026 6.351 0 0 0.531 0.534 92.558 0.000 0.000
4 23.902 1.055 27.47 0 0 2.773 5.680 59.565 1.178 2.277
8 34.879 11.58 42.76 0 0 2.974 8.189 31.180 1.638 1.674
12 76.761 14.82 72.33 0 0 1.621 1.893 7.807 0.864 0.670
PBTS: Profit before tax-sales ratio, EBIT: Earnings before interest and tax Earnings before to sales rat, QRA: Quick ratio, ROE: Return on equity, TDE: Total debt-equity ratio, TDTA: Total debt-total asset ratio, VDC: Variance decomposition
Appendix 3: VDC of capital structure variables
Period S.E. ROE PBTS LASI RGDPG SHPR EBSL QRA TDE TDTA
TDE
1 96.889 67.14 2.005 0 0 1.510 2.153 0.092 27.10 0.000
4 110.52 55.96 4.063 0 0 10.35 2.187 0.613 24.75 2.078
8 153.03 43.53 28.02 0 0 7.514 1.505 0.989 15.42 3.020
12 358.56 23.24 69.45 0 0 2.185 0.385 0.320 3.157 1.260
TDTA
1 6.626 5.039 0.095 0 0 3.706 2.251 0.173 7.733 81.00
4 10.419 3.487 12.32 0 0 9.417 1.822 1.194 3.597 68.16
8 17.076 13.65 44.37 0 0 5.129 1.292 0.638 1.397 33.53
12 36.420 11.42 75.57 0 0 1.469 0.680 0.876 0.610 9.372
PBTS: Profit before tax-sales ratio, EBIT: Earnings before interest and tax Earnings before to sales rat, QRA: Quick ratio, ROE: Return on equity, TDE: Total debt-equity ratio, TDTA: Total debt-total asset ratio, VDC: Variance decomposition
Appendix 4: VDC of share price (SHPR)
Period S.E. ROE PBTS LASI RGDPG SHPR EBSL QRA TDE TDTA
1 0.478 12.26 0.084 0 0 87.66 0.000 0.000 0.000 0.000
4 1.029 39.16 2.478 0 0 56.60 0.034 0.356 0.550 0.818
8 1.783 27.30 32.06 0 0 37.26 0.165 0.406 1.365 1.444
12 4.088 16.10 68.26 0 0 12.43 0.282 1.047 1.149 0.740