ISSN: 2146-4138 www.econjournals.com
The Impact of Overconfidence on Capital Structure in Turkey
Serpil Tomak
Vocational School of Social Sciences, Department of Management and Organization, Mersin University, Turkey. Email: [email protected]
ABSTRACT: The aim of this study is to investigate the relationship between the overconfidence and capital structure in Turkish manufacturing firms. In addition to management confidence, the impact of the fundamental factors on the market leverage is analyzed. The annual data of 115 manufacturing firms on the Istanbul Stock Exchange (ISE) for the period between 2002 and 2011 is used for the analysis by means of the ordinary least squares regression model. The results show that the relationship between confidence and leverage is ambiguous. There isn’t enough evidence for the idea of overconfident managers tends to use more debt level. However, this study provides some evidence for firm specific factors like size and profitability effects on leverage.
Keywords: Overconfidence; capital structure; leverage JEL Classifications: G32
1. Introduction
Many studies have been done on the factors of determining capital structure so far. Theories like trade-off theory, pecking order theory, agency costs theory has seen wide acceptance in practice. In this sense, the existing traditional financial theories of capital structure factors are based on the basic data-oriented like agency costs, asymmetric information and transaction costs (Oliver, 2005:2). Although companies have the same basic data, different financing preferences of firms are explained by behavioral theories. In the traditional finance theory, an individual is considered to be rational. In these studies, the effect of the decisionmaker's personality is neglected. However, behaviorists tend to emphasize the bounded rationality due to cognitive limitations.
Behavioral research focuses on the human psychology and sentiment due to irrationality of human beings. Many financial anomalies are attempted to be explained by behavioral approaches. Most of the empirical studies on financing decisions of Turkish firms are based on traditional finance theories. Most of the studies indicate that overconfidence bias plays an important role in managers’ finance and investment decisions. In this study, we investigate the effect of manager’s confidence level on capital structure decisions.
2. Theoretical Framework of Overconfidence
As an interdisciplinary concept, overconfidence is associated with calibration and probability judgement in psychology. Overconfidence can be defined as miscalibration (Skala, 2007:34). In this sense, the difference between accuracy rate and probability assigned for decision making problem is classified as overconfidence. In financial sense overconfidence is defined as overestimation for the certainity or interpretation of one’s own knowledge or private information (Skala, 2007:41).
In psychological research, overconfidence is associated with cognitive, psychological and motivational reasons. It is explained with heuristics and biases caused by faulty cognitive processing. There are three main types of heuristics that can cause overconfidence; representativeness heuristic, availability heuristic, adjustment and anchoring heuristic. Cognitive biases can be summarized as confirmation bias, better than average effect, self-serving bias, hard-easy effect, optimism bias and illusion of control. Due to cognitive limitation, Hirshleifer (2001) describes coercion of the people using heuristics as heuristic simplification.
The Impact of Overconfidence on Capital Structure in Turkey
presence of clear and rapid or a repetitive feedback, and in simple nature of the task. When making decision or time pressure, people use heuristics as the degree of uncertainty and complexity of task increases.
Psychological findings demonstrate that overconfidence bias leads people to underestimate risks and overestimate their ability to control events –illusion of control- and more confident about precision of their knowledge. In this situation, people take high risks which they do not want and diverge from the standart decision making theory. As a result they are exposed to high levels of losses. Overconfident managers are prone to overestimate their performance and knowledge, but underestimate financial distress costs.
In the literature, overconfidence and optimism bias are generally evaluated together. For analytical considerations, overconfidence and optimism bias are discussed together (Barros and Silveira, 2007; Ben-David et al, 2006) in some studies, but optimism bias is evaluated separately in some other studies (Oliver, 2005; Mefteh and Oliver, 2007). Optimism bias or over-optimism is defined as “the tendency of people to over-estimating the likelihood of positive events and under-estimating the likelihood of negative events.” Overconfidence bias is defined as “overestimating the accuracy of one’s estimates or forecasts.” (Barros and Silveira, 2007:4). If managers overestimate the probability of good corporate performance they are optimistic, inversely, they are pessimistic if they underestimate the probability of good corporate performance.
3. Literature Review
Studies on overconfidence find great interest in the literature for responsive power to overconfidence bias to some financial market puzzles that can not be explained by standart economic theory. There have been many analysis on the economic effects of overconfidence on financial markets and firms. Excessive trading volumes in financial markets (Daniel et al., 1998; Odean, 1998; Gervais and Odean, 2001), security misvaluation (Daniel et al., 1998), unproper mergers and acquisitions (Roll, 1986; Malmendier and Tate, 2006), imperfect capital structure decisions (high debt level) is explained by overconfidence bias. Studies using different methodology demonstrate that the factors like recent achievements and the positive past performance of the company, past experience, personality traits of individual lead to overconfidence (Hackbarth, 2009; Graham et al., 2008; Ben-David et al., 2007).
In Fairchild’s (2009) theoretical model, the effects of managerial overconfidence on financing decisions are discussed under two topics; managerial shirking and free cash flow. In the first case, due to managerial shirking managers display low levels of effort in running the business. An overconfident manager overestimates his ability, and underestimates the financial distress costs. Therefore, there is a positive relationship between overconfidence and debt level. In the second model, managers have desire to use free cash flow to invest a new project that may be value-reducing. Unlike the first case, overconfidence has an effect on lowering debt. Rational managers prefer borrowing for the knowledge that the new project is reducing, but overconfident managers perceive the new project as value-increasing, and they decrease the debt level for the new project.
Fairchild (2009) establishes an interrelation between overconfidence and life-cycle debt in accordance with Damodaran (2001) approach. Debt level is low in companies at the early start-up and growth stages for having the flexibility to benefit potential new projects. The theoretical model states that an overconfident manager may choose lower debt than a rational manager. In the latter stage, an overconfident manager may choose higher debt than a rational manager for the reason of the disciplining role of debt becomes important.
Hackbarth (2009) analyzed theoretically the effects of optimism and overconfidence biases on management investment and finance decisions. Hackbarth (2009) postulates that managerial biases may have a positive role due to the balancing effect. Due to employ more debt (leverage effect), biased managers will increase the level of underinvestment compared to rational managers. Conversely, compared to rational managers, biased managers invest -ceteris paribus- earlier than rational managers (timing effect). Due to timing effect outweighs the leverage effect, cognitive biases benefits exceed their costs.
with miscalibration. They suggest that Chief Financial Officers (CFOs) make miscalibration in many business decisions including financial decisions. They conclude that firms with overconfident CFOs invest more, pay out fewer dividends, use debt more aggressively, engage in market timing, provide more managerial forecasts, and tilt executive compensation towards performance.
Oliver (2005) demonstrates that firms have a high level of confidence, debt levels are also high for US firms in the period between 1978 and 2004. Barros and Silveira (2007) find strong evidence for overconfidence and optimism bias on the capital structure decisions of Brazilian non-financial firms listed in the Sao Paulo Stock Exchange (Bovespa) between 1998 and 2003. Mefteh and Oliver(2007) find a negative relationship between investor confidence and debt level, but positive relationship between management confidence and the level of borrowing. Besides, different from American practices Mefteh and Oliver (2007) suggest that investor confidence dominates management confidence –explained with the higher levels of blockholder control of firms in France or the weaker business environment- , thereby form a negative relation between industry sentiment with leverage.
Korkmaz and Çevik (2007) analyzed the investors’ behavior who trade in ISE. The study concludes that overconfident investors tend to increase trading activity after getting market return and they are more active in the bull markets. But, there is not enough evidence for the idea of overconfident investors trade risky assets after getting market return.
4. Methodology
4.1. Model Specification
There have been many studies on the relative importance of capital structure determinants so far in finance literature. Generally accepted as the core factors for the market leverage are as follows (Murray and Goyal, 2009):
- Industry median leverage: Firms in industries in which the median firm has high leverage tend to have high leverage.
- Tangibility: Firms that have more tangible assets tend to have higher leverage. - Profits: Firms that have more profits tend to have lower leverage.
- Firm size: Firms that are large (in terms of assets) tend to have higher leverage.
- Market-to-book assets ratio: Firms that have a high market-to-book ratio tend to have lower leverage.
- Expected inflation: When inflation is expected to be high, firms tend to have high leverage. These fundamental variables and confidence factor that influence leverage are used in this model spesification. An ordinary least squares regression model with robust t-statistics is employed as an indicative of standart errors for heteroscedasticity. We test this hypothesis by using confidence index, four firm-specific determinants and two macro economic variables into the regression equation as follows:
LEVERAGEi,t = a0 +a1CONFi,t-1+ a2MB i,t-1 +a3SIZE i,t-1+ a4TNG i,t-1+A5PRF i,t-1+ a6GDP i,t-1+a7INF i,t-1+εit
Rajan and Zingales (1995) present and analyze five different types of leverage measures. Classical measures of leverage as debt to total assets is used in this study. Leverage for firm i at time t, is defined as:
LEVERAGEi,t=(Long term debti,t+Short term debti,t)/Total Assetsi,t 4.2. Data and Variables
In the present study, there include 117 manufacturing firms listed on Istanbul Stock Exchange (ISE) classified into different sectors. The formula and abbreviations used for measurement of all the variables are presented in this section.
Management Confidence (CONF)
The main problem in measuring management confidence is determining the observable measurement data. Ben-David et al. (2006) adopt CFOs forecasts about stock market returns. Malmendier et al. (2007) use two types of measures in measuring management confidence; personal portfolio decisions of the CEO and perception of CEOs using portrayal in the business press. Oliver (2005) use University of Michigan Consumer Sentiment Index data as a measure of confidence.
The Impact of Overconfidence on Capital Structure in Turkey
Sentiment. In this study, Consumer Confidence Index shows the consumer sentiment based on a monthly telephone survey of households. The methodology used to calculate the index has been adopted from the Michigan University index of consumer sentiment. The survey results have been announced on a monthly basis since January 2002. That’s why analysis covers the period between 2002-2011. We proxy manager confidence by Consumer Confidence Index (CCI) as the average of the past 12 months CNBC-e Consumer Confidence Index values.
Market to Book (MB)
Market to book ratio is used as a measure of growth opportunities. Besides, previous studies document that it is also accepted as a measure of firm leverage. How growth rate affect the leverage explained by two different approaches; As the growth or enhancement in firm assets facilitates the borrowing capacity of the firms in the future, it will result in the increase in firm leverage. According to the second view [Myers (1977); Titman and Wessels (1988)], firms use less debt to avoid or reduce agency costs. Therefore, growth rate should have a negative relationship with debt. For this reason, it would be appropriate to define firm’s growth as the total assets minus book equity plus market equity over book total assets (Gurcharan, 2010:33):
MBi,t=( Total assetsi,t+Book equityi,t+Market equityi,t)/ Total assetsi,t Firm Size (SIZE)
It is expected to have positive correlation between size and leverage. Because, increase in firm size means lower transaction costs in borrowing, ability to access financial markets, lower information asymmetries. The natural logarithm of total sales is commonly used as a proxy of size (Oliver, 1995): SIZE i,t= Ln(Total Salesi,t)
Tangibility of Assets (TNG)
One of the determinants of leverage is the tangibility of assets. As the collateral value of assets, firms that have higher value of assets are expected to have higher leverage (Rajan and Zingales, 1995; Oliver, 1995). Following Hovakimian (2005) and Oliver (2005) tangibility of assets is defined as:
TNGi,t=Property plat and equipmenti,t/ Total Salesi,t Firm Profitability (PRF)
Due to internal finance facilities, more profitable firms are expected to hold less debt. Following Baker and Wurgler (2002) and Oliver (2005) tangibility of assets is defined as:
PRFi,t= (Earnings before interest, tax and depreciationi,t)/ Total Salesi,t Gross Domestic Product
One of two macro economic factors is the Gross Domestic Product. Annual real GDP growth rate is accounted in the regression equation.
Inflation Rate
As a macro economic factor, annual inflation rate is expected to impact leverage in the positive way. High inflation rate is likely to encourage more debt level in the firm.
5. Empirical Analysis 5.1.Descriptive Statistics
Table 1 presents the descriptive statistics on different variables in the model during the period of 2002 to 2012 for the Turkish manufacturing firms. The average value of management confidence over the sample period is approximately 100.6. The maximum of 121.89 occurred in the year 2004 and the minimum of 68.05 occurred in 2008. The median values for almost all the variables are close to mean values except for GDP and Inflation rates. The leverage ratios ranging from 0.006 to 1.43 with the highest standart deviation of 0.23. The skewness value of all variables skew to the right except for management confidence, indicating that the most of the variables are on the lower range. As for the kurtosis measure, almost all the variables do not have kurtosis value of normal distribution (value below three) except for tangibility values.
Table 1. Descriptive Statistics of Variables for Manufacturing Sector
LEVERAGE CONF MB SIZE TNG PRF GDP INF
Mean 0.43 100.6 1.41 18.89 0.39 0.07 0.19 11.67
Median 0.41 99.9 1.13 18.73 0.39 0.06 0.15 9.5
Maximum 1.43 121.89 23.19 24.45 0.003 0.40 0.44 29.7
Minimum 0.006 68.05 0.20 13.25 0.85 -0.33 0.03 6.4
Std.Dev. 0.23 14.04 1.27 1.58 0.17 0.09 0.11 6.82
Skewness 0.61 -0.79 8.22 0.43 0.05 0.13 0.98 1.82
Kurtosis 3.57 3.62 104.25 4.02 2.52 4.08 3.22 5.08
Observations 1150
Table 2. Correlation Coefficients for the Regression Variables
LEVERAGE CONF MB SIZE TNG PRF GDP INF
LEVERAGE 1.00
CONF -0.07
(0.02)
1.00
MB -0.06
(0.03)
0.09 (0.00)
1.00
SIZE 0.02
(0.50) -0.06 (0.03) -0.10 (0.00) 1.00
TNG -0.07
(0.01) 0.07 (0.01) 0.00 (0.89) -0.03 (0.37) 1.00
PRF -0.29
(0.00) 0.00 (0.91) 0.11 (0.00) 0.20 (0.00) -0.13 (0.00) 1.00
GDP 0.13
(0.00) 0.37 (0.00) -0.02 (0.40) -0.16 (0.00) 0.01 (0.84) 0.15 (0.00) 1.00
INF 0.17
(0.00) 0.04 (0.17) -0.05 (0.07) -0.16 (0.00) -0.02 (0.47) 0.17 (0.00) 0.92 (0.00) 1.00
* Correlation is significant at the 0.05 level (2-tailed). **The P-values are shown in parentheses.
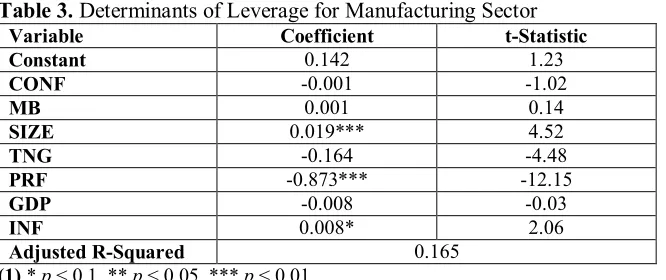
As shown in Table 3, there is a positive relationship between leverage with the macro economic factors (GDP and INF). But there is an inverse relationship between leverage withthe variables of Market to Book, tangibility and profitability. The results are statistically significant except for size.
Table 3. Determinants of Leverage for Manufacturing Sector
Variable Coefficient t-Statistic
Constant 0.142 1.23
CONF -0.001 -1.02
MB 0.001 0.14
SIZE 0.019*** 4.52
TNG -0.164 -4.48
PRF -0.873*** -12.15
GDP -0.008 -0.03
INF 0.008* 2.06
Adjusted R-Squared 0.165
(1) * p < 0.1, ** p < 0.05, *** p < 0.01
(2) Estimation was conducted with White’s heteroskedasticity.
5.2.Regression Analysis
The Impact of Overconfidence on Capital Structure in Turkey
leverage level or use of debt level increases in the firm. Besides, high level of inflation rates lead to incerase the uses of debt in the firm.
But the relationship with the variables like CONF, MB and GDP on leverage is not significant. There isn’t enough evidence for management confidence, market to book ratio and GDP impact on leverage.
5.3.Robustness Test
∆LEVERAGEi,t = a0 +a1CONFi,t-1+ a2MB i,t-1+a3SIZE i,t-1+ a4TNG i,t-1+a5PRF i,t-1+ a6GDP i,t-1+a7INF i,t-1+a8LEVERAGE i,t-1+εit
As the dependent variable ∆LEVERAGEi,t, is the change in leverage from t to t-1. Howakimian (2005) state that as the leverage is bounded between 0 and 1 firms with high leverage are prone to decline in leverage and inversely firms with low leverage are prone to increase in leverage. For this reason lagged leverage should be used for controlling this effect. Following this papers [Baker and Wurgler (2002); Howakimian (2005); Oliver (2005)] a lagged value of LEVERAGE is used in this study. Except from LEVERAGE i,t-1, all variables are the same as previously defined.
As shown in Table 4, robustness check results are consistent with those previously reported in Table 3. In both cases the coefficient of the size, profitability, and inflation rate remains significant. Lagged value of leverage appears to be negative and highly significant.
Table 4. Determinants of Changes in Leverage for Manufacturing Sector
Variable Coefficient t-Statistic
Constant 0.142 1.13
CONF -0.001 -0.96
MB 0.001 0.12
SIZE 0.019*** 4.72
TNG -0.164 -3.96
PRF -0.873*** -12.03
GDP -0.008 -0.03
INF 0.008* 1.95
LEVERAGEt-1 -0.887*** -26.19
Adjusted R-Squared 0.503
(1) * p < 0.1, ** p < 0.05, *** p < 0.01
(2) Estimation was conducted with White’s heteroskedasticity.
6. Conclusion
There have been many studies on the relative importance of capital structure determinants so far in Turkey. However, there are very few studies on overconfidence for Turkish market in financial literature. Little attention is given on the effect of management confidence to capital structure decisions. This paper is one of the first studies that analyzes the validity of management confidence on capital structure for the 115 Turkish manufacturing firms traded in ISE for the period of 2002 and 2011.
As we mentioned before, excessive trading volumes in financial markets, security misvaluation, unproper mergers and acquisitions, imperfect capital structure decisions is explained by overconfidence bias. Most of the previous studies document that overconfident managers tend to use high level of debt in capital structure decisions. However, in this study there is not clear and enough evidence for the idea of overconfident managers tend to use more debt level. Another words, the relationship between management confidence and leverage is ambiguous. In addition to this, firm size, tangibility of firms and GDP measure indicate insignificant impacts on leverage.
References
Baker, M., Wurgler, J. (2002). Market Timing and Capital Structure, Journal of Finance, 57(1), 1-32. Barros, L.A.B., Silveira, A.D.M. (2007). Overconfidence, Managerial Optimism and the Determinants
of Capital Structure, Working Paper, 1-33.
Ben-David, I., Graham, J.R., Harvey, C.R. (2006). Managerial Overconfidence and Corporate Policies, Working Paper, 1-49.
Damodaran, A. (2001). Corporate Finance: Theory and Practice, Second Edition, Wiley International Edition.
Fairchild, R. (2009). “Managerial Overconfidence, Moral Hazard Problems, and Excessive Life-cycle Debt Sensitivity, Investment Management and Financial Innovations, 6(3), 35-42.
Fischhoff, B., Lichtenstein, S., Slovic, P. (1977). Knowing with Certainty: The Appropriateness of Extreme Confidence, Journal of Experimental Psychology, 3(4), 552–564.
Frank, M.Z., Goyal V.K. (2009). Capital Structure Decisions: Which Factors are Reliably Important?, MPRA Paper No: 22525, 1-59.
Graham, J.R. Campbell, R.H., Puri, M. (2008). Managerial Attitudes and Corporate Actions, Working Paper, 1-40.
Gurcharan, S. (2010). A Review of Optimal Capital Structure Determinant of Selected ASEAN Countries, International Research Journal of Finance and Economics, 47, 30-41.
Hackbarth, D. (2009). Determinants of Corporate Borrowing: A Behavioral Perspective, Journal of Corporate Finance, 15, 389- 411.
Hirshleifer, D. (2001). Investor Psychology and Asset Pricing, Working Paper, 1-62.
Hovakimian, A. (2003). Are Observed Capital Structures Determined by Equity Market Timing?, Working Paper, 1-43.
Korkmaz, T., Çevik, E.İ. (2007). The validity of overconfidence hypothesis in behavioral finance
models: An application on ISE, İktisat, İşletme ve Finans, 22(261), 137-154.
Malmendier, U. , Tate, G., Yan, J. (2007). Corporate Financial Policies with Overconfident Managers, NBER Working Paper Series, 1-44.
Mefteh,S., Oliver B.R. (2007). Capital Structure Choice: The Influence of Confidence in France, Working Paper, 1-28.
Moore, D., Healy, P.J. (2007). The Trouble with Overconfidence, Working Paper, 1-75.
Murray, Z.F., Goyal V.K. (2009). Capital Structure Decisions: Which Factors Are Reliably Important? Financial Management, 1-37.
Oliver, B.R. (2005). The Impact of Management Confidence on Capital Structure, Working Paper, p.1-23.
Rajan, R.G., Zingales, L. (1995). What do We Know About Capital Structure? Some Evidence from International Data, Journal of Finance, 50(5), 1421-60.