Biogeosciences, 10, 3089–3108, 2013 www.biogeosciences.net/10/3089/2013/ doi:10.5194/bg-10-3089-2013
© Author(s) 2013. CC Attribution 3.0 License.
EGU Journal Logos (RGB)
Advances in
Geosciences
Open Access
Natural Hazards
and Earth System
Sciences
Open AccessAnnales
Geophysicae
Open AccessNonlinear Processes
in Geophysics
Open AccessAtmospheric
Chemistry
and Physics
Open AccessAtmospheric
Chemistry
and Physics
Open Access DiscussionsAtmospheric
Measurement
Techniques
Open AccessAtmospheric
Measurement
Techniques
Open Access DiscussionsBiogeosciences
Open Access Open Access
Biogeosciences
Discussions
Climate
of the Past
Open Access Open Access
Climate
of the Past
Discussions
Earth System
Dynamics
Open Access Open Access
Earth System
Dynamics
DiscussionsGeoscientific
Instrumentation
Methods and
Data Systems
Open Access
Geoscientific
Instrumentation
Methods and
Data Systems
Open Access DiscussionsGeoscientific
Model Development
Open Access Open Access
Geoscientific
Model Development
DiscussionsHydrology and
Earth System
Sciences
Open AccessHydrology and
Earth System
Sciences
Open Access DiscussionsOcean Science
Open Access Open Access
Ocean Science
DiscussionsSolid Earth
Open Access Open Access
Solid Earth
DiscussionsThe Cryosphere
Open Access Open Access
The Cryosphere
DiscussionsNatural Hazards
and Earth System
Sciences
Open Access
Discussions
Net primary productivity, allocation pattern and carbon use
efficiency in an apple orchard assessed by integrating eddy
covariance, biometric and continuous soil chamber measurements
D. Zanotelli1, L. Montagnani1,2, G. Manca3, and M. Tagliavini1
1Faculty of Science and Technology, Free University of Bolzano-Bozen, Bolzano, Italy 2Forest Services, Autonomous Province of Bolzano-Bozen, Bolzano, Italy
3Air and Climate Unit, Institute for Environment and Sustainability, Joint Research Centre of European Commission,
Ispra, Italy
Correspondence to: D. Zanotelli ([email protected])
Received: 11 September 2012 – Published in Biogeosciences Discuss.: 15 October 2012 Revised: 5 April 2013 – Accepted: 5 April 2013 – Published: 7 May 2013
Abstract. Carbon use efficiency (CUE), the ratio of net
primary production (NPP) over gross primary production (GPP), is a functional parameter that could possibly link the current increasingly accurate global GPP estimates with those of net ecosystem exchange, for which global predictors are still unavailable. Nevertheless, CUE estimates are actu-ally available for only a few ecosystem types, while informa-tion regarding agro-ecosystems is scarce, in spite of the sim-plified spatial structure of these ecosystems that facilitates studies on allocation patterns and temporal growth dynam-ics.
We combined three largely deployed methods, eddy co-variance, soil respiration and biometric measurements, to as-sess monthly values of CUE, NPP and allocation patterns in different plant organs in an apple orchard during a com-plete year (2010). We applied a measurement protocol opti-mized for quantifying monthly values of carbon fluxes in this ecosystem type, which allows for a cross check between es-timates obtained from different methods. We also attributed NPP components to standing biomass increments, detritus cycle feeding and lateral exports.
We found that in the apple orchard, both net ecosystem production and gross primary production on a yearly ba-sis, 380±30 g C m−2 and 1263±189 g C m−2respectively, were of a magnitude comparable to those of natural forests growing in similar climate conditions. The largest differences with respect to forests are in the allocation pattern and in the fate of produced biomass. The carbon sequestered from the
atmosphere was largely allocated to production of fruit: 49 % of annual NPP was taken away from the ecosystem through apple production. Organic material (leaves, fine root litter, pruned wood and early fruit falls) contributing to the detri-tus cycle was 46 % of the NPP. Only 5 % was attributable to standing biomass increment, while this NPP component is generally the largest in forests.
The CUE, with an annual average of 0.71±0.12, was higher than the previously suggested constant values of 0.47–0.50. Low nitrogen investment in fruit, the limited root apparatus, and the optimal growth temperature and nutri-tional condition observed at the site are suggested to be ex-planatory variables for the high CUE observed.
1 Introduction
Global greenhouse gases (GHGs) concentration in atmo-sphere has been growing since preindustrial times due to anthropogenic forcing, in particular fossil fuel combustion and land use change (Canadell et al., 2007; Le Qu`er`e et al., 2009), with carbon dioxide (CO2)being the prevalent
anthropogenic emissions and, on a global scale, it has been estimated that the terrestrial biosphere is able to take up about 30 % of anthropogenic CO2 emissions annually (Schulze,
2006; Canadell et al., 2007).
Several studies have been carried out to assess the capacity of ecosystems in different natural biomes to sequester C from the atmosphere, most of which related to FLUXNET synthe-sis activity (Baldocchi, 2008; http://www.fluxnet.ornl.gov/) and results have been recently reviewed in a global dataset (Luyssaert et al., 2007; Schulze et al., 2010).
While extensive knowledge on natural ecosystem is avail-able, the carbon sequestration potential of intensively man-aged ecosystems, particularly woody agro-ecosystems, have been poorly studied, although some crop classes may as-sume great importance especially at regional scale (Testi et al., 2008). Agricultural practices such as soil tillage, fertil-ization, irrigation, pruning and the reduced biodiversity oc-curring in agricultural systems may significantly alter their capacity to exchange C with the atmosphere (Smith, 2004; Osborne et al., 2010) and thus their potential to act as a sink of C as compared to natural ecosystems growing in similar environmental conditions.
Woody agro-ecosystems are among the least quantified and most uncertain elements in the terrestrial biogeochem-ical cycle. In the present study we hypothesize that the main ecosystem carbon fluxes of a woody agro-ecosystem are of the same magnitudes with respect to those of a natu-ral forested ecosystem of the same biome rank (temperate-humid deciduous forest), while the main differences between the two land use types take place in the allocation pattern of fixed C.
An effective way to compare the ability of different ecosystems to sequester CO2from the atmosphere is to
de-termine their carbon use efficiency (CUE). CUE is an intu-itive and easily comparable index to assess the capacity of an ecosystem to transfer C from the atmosphere to terrestrial biomass (De Lucia et al., 2007).
CUE is the ratio between net primary production (NPP) and gross primary production (GPP):
CUE=NPP
GPP. (1)
Values of NPP and GPP can be derived as follows:
NPP=GPP−Ra=NEP+Rh (2)
and
GPP=NPP+Ra=NEP+Reco, (3)
where NEP is the net ecosystem production and Reco is
the ecosystem respiration given by autotrophic respiration (Ra)+heterotrophic respiration (Rh).
Estimates of GPP, both derived from flux networks (Beer et al., 2010) and from satellite observations (Peng et al., 2013), are increasingly robust, while reliable climatic and
biological predictors of NEP are still unavailable at global scale. Increasing our knowledge on the magnitude and spa-tial distribution of CUE andRhcould allow a better linkage
of the GPP estimates with those of NPP and NEP.
We investigated an apple orchard (Malus domestica Borkh.) growing in the temperate-humid area of South Ty-rol, Italy, and compared it with data taken from literature of temperate-humid forests (Curtis et al., 2002; Luyssaert et al., 2007; DeLucia et al., 2007). The crop class consid-ered is globally relevant, being cultivated worldwide over 4.75 million hectares (FAOSTAT, 2010). We used CUE as a comparison index and we biometrically measured the NPP of the main ecosystem compartments to assess the C alloca-tion pattern in the year 2010. In order to test the robustness of the measurements of C fluxes involved in CUE determination (GPP, NPP and Ra), we adopted an experimental protocol
that allowed us to obtain a cross check between independent estimates of each flux.
Given the relevance of CUE estimates and the paucity of existing reliable values for different ecosystem types and cli-mates, we addressed as a main question in this study if cur-rent methodologies used to quantify C stocks and fluxes can be combined to robustly quantify the CUE in a woody agro-ecosystem chosen as an exemplary model.
2 Materials and methods
2.1 Site description
The study site is located in the intensively cultivated val-ley bottom of the Adige River, in the municipality of Cal-daro, South Tyrol, Italy (46◦210N, 11◦160E; 240 m a.s.l.). Apple trees (Malus domestica Borkh., variety Fuji grafted on dwarfing EMLA 9 rootstock) were planted in rows in the year 2000, following a regular frame of 3×1 m, where 1 m is the distance between plants along the row and 3 m is the dis-tance between tree rows. The average pruned tree height was 3.6 m. A 1.2 m wide strip of soil centered on the tree row was kept free of grass through periodic tillage. In the 1.8 m wide alleys between tree rows, grasses were free to grow and were cut 3 times during the year. Apple tree plantations with the same characteristics were present around the selected field for a minimum distance of 300 m in all directions.
Budburst occurred in the second half of March, trees max-imum LAI was 2.8 m2m−2in July and major leaf fall started
guidelines of organic farming. Organic fertilizers were ap-plied in a single rate in March 2010, providing 35.5 g C m−2
and 7.5 g N m−2. Fruit yield in the period 2009–2012 ranged
between 45.2 and 74.4 t ha−1.
2.2 Experimental setup
The site was selected based on the favorable conditions for eddy covariance (EC) measurement in terms of regular ter-rain and homogeneity of land surface cover. An 8 m tower was set up at the beginning of 2009. Instruments for EC mea-surements were installed at the top of this tower. Addition-ally, the tower was equipped with a series of meteorologi-cal instruments. Solar radiation components were measured by CNR1, Kipp & Zonen, Delft, Holland; air temperature and relative humidity by CS215, Campbell Scientific Incor-porated, Logan, Utah, United States (CSI hereafter); rain-fall by a professional rain gauge (RAIN-O-MATIC, Pron-amic, Silkeborg, Denmark), and soil water content by mul-tiple TDRs (CS616, CSI). All meteorological data were col-lected by a CR3000 (CSI) datalogger.
Close to the tower, 16 collars (20 cm diameter) for soil res-piration measurement were placed along a selected row at 35–55 cm from the trees, 8 on control plots and 8 on trench-ing plots. Soil trenchtrench-ing (50×50×60 cm) was carried out in summer 2009. Practical limitations for expanding the survey area to other treelines and grassed alleys were encountered since the measurement chambers would have been an obsta-cle to the farm machinery. This limitation was overcome by carrying out a parallel independent campaign for assessing the spatial variability of soil respiration in the field.
After a characterization of tree diameters that was con-ducted over the whole site, six groups of five plants each were selected in order to represent the probability density distribution of the observed tree diameter. Nets for litter col-lection were placed under selected trees and biometric mea-surements were carried out during the 2010 growing season to assess the total NPP and carbon allocation within the stud-ied ecosystem. Along with measurements and litter collec-tion, 9 branches (3 per plant level) were cut from randomly selected trees and brought to the laboratory for analysis at each sampling date. The collected material was used to deter-mine the mean dry weight of each organ (after drying in oven to a constant weight at 65◦C), the mean carbon and nitrogen content of each NPP component (FlashEATM1112 Elemen-tal Analyzer, Thermo Fisher Scientific, Germany) and the mean leaf surface (LI-3000+LI-3050 Portable Area Meters, Li-Cor Biosciences, Lincoln, Nebraska, USA, Li-Cor here-after).
2.3 Measurement techniques
2.3.1 Eddy covariance measurements
Net ecosystem exchange (NEE) of CO2has been measured
continuously by the eddy covariance technique since March 2009. Measurements and calculation were performed fol-lowing the Euroflux methodology as described by Aubinet et al. (2000) with a 3-D sonic anemometer (Gill R3-50, Gill Instruments, Lymington, UK) at a height of 8 m above-ground (4 m above the canopy) and a close path CO2/H2O
infrared gas analyzer (IRGA, LI-7000, Li-Cor). Air was sam-pled through a polyethylene tube (4 mm inner, 6 mm external diameter and a length of 12 m) at a distance of 0.3 m from the anemometer with a flux rate of 10 L min−1provided by an external pump (N838 KNDC, KNF Neuberger GmbH, Freiburg, Germany). Calibration was performed bi-weekly with reference gases: nitrogen and 380 ppm CO2flasks
(pro-duced by Messer, Grugliasco, Italy) were used to set the zero and the CO2span, respectively. Zero level of CO2and H2O
in the reference cell of the analyzer was assured by the use of chemicals (respectively Ascarite II for CO2 and
magne-sium perchlorate for water vapor), which were substituted bi-weekly. The software Eddysoft (Kolle and Rebmann, 2007; Mauder et al., 2008) was used to calculate eddy fluxes with the following criteria: no detrending, no high- or low-pass filtering corrections were used; a two-axis rotation of co-ordinates was applied each 30 min. The Eddysoft software uses the algorithm proposed by Eugster and Senn (1995) to correct for the underestimation of covariance signal due to damping of high-frequency fluctuation of CO2
concentra-tion. The high-frequency loss was estimated comparing the cospectra of the virtual heat flux, which we assume free of high-frequency damping, with the cospectra of the turbulent CO2flux. The software automatically calculated the lag time
for CO2 at each half hour to maximize the covariance
be-tween fluctuations in vertical wind velocity and gas molar fraction. In addition, the analysis of stationarity conditions for CO2turbulent flux and of the integral turbulent
charac-teristics (ITC) following Foken and Wichura (1996) was per-formed.
Gaps in data collection, which represented 7.2 % of the yearly half hours, and CO2flux values removed due to
of the LUT was moved 15 days ahead. For the daytime the bi-monthly moving LUT with a 15 days sliding window was compiled for 26 classes of air temperature and 26 classes of global radiation (Rg). Rg was also used to distinguish day from night (Rg>20 W m−2).
The partitioning of the observed NEE into GPP andReco
was achieved through nighttime LUT used for gap filling. Indeed, daytime Reco values for a bi-monthly period were
extrapolated from the nocturnal LUT according to air tem-perature and soil humidity for the specific daytime half-hour period.
As a form of control, gap filling was also performed by the marginal distribution sampling method, which accounts for temporal autocorrelation of fluxes, replacing missing data with the average value under similar meteorological con-ditions (Reichstein et al., 2005) and by the light response curve approach described by Lasslop et al. (2010), using the online standard tool (http://www.bgc-jena.mpg.de/bgc-mdi/ html/eddyproc/index.html). GPP and Reco calculation was
performed using the same tool.
2.3.2 Biometric measurements
Biometric measurements were conducted over six represen-tative plots following Law et al. (2008), which led us to set up a correct field plot design and consider all the relevant el-ements to be monitored. Six NPP components were consid-ered separately: leaves (NPPl); fruit (NPPf ); aboveground woody tissues (NPPwAG), which include trunks, branches
and shoots; belowground woody tissues (NPPwBG), which
include coarse roots and the belowground part of trunk; fine roots (NPPfr); understory production (NPPu). Each of these fluxes was assessed directly and independently. We did not consider root exudate production in this budget, which for apple trees growing in similar soil types can represent up to 30 % of fine root production (Scandellari et al., 2007), non-CO2 carbon emission and the volatile organic compounds
(VOC), whose contribution to total NPP is assumed to be negligible (Arneth et al., 2011; Malhi et al., 2009). Biologi-cal samples, leaf and fruit numbers, trunk circumference val-ues and root images were taken once a month. The following general equation was used to calculate the NPP between two consecutive sampling dates:
NPP=Lt+1+Sbt+1−Sbt, (4)
whereL is the litter collected from the nets and Sb is the standing biomass. Using this procedure, shrinkage effects in tree diameter may determine apparent reduction in wood biomass. Variations in C storage within tree organs along the vegetative season were not considered beside their relevance (Cannell and Dewar, 1994). WhenLwas negligible, Eq. (4) was simplified as follows:
NPP=Sbt+1−Sbt. (5)
Details on the sampling procedures for each NPP compo-nent are described below.
NPPl – one tree out of each plot for a total of 6 trees was selected. In April 2010 we divided the trees according to 3 height levels (low=0–120 cm, medium=120–240 cm, high=240–360 cm) to represent vertical variability within the trees (e.g., Rayment et al., 2002). We also numbered and tagged all the branches and we counted the number of leaves and flowers on each branch.
Three branches per tree level were then chosen, and from May till November the number of leaves and fruit of these 9 branches per tree were monitored, avoiding any sampling collection. We used the complete characterization carried out in April to determine a multiplicative factor, specific to each plant level, to upscale measured values to the whole tree. The derived total number of leaves per tree was multiplied by the mean dry weight of leaves of that period, and thus by leaf carbon concentration, to determine the total amount of C in the leaves.
The mean leaf area was determined by measuring the leaf surface of the sampled material by LI-3000+LI-3050 (Li-Cor). The leaf area index (LAI) of the trees was obtained by taking into account the mean leaf area, the total number of leaves and the soil surface (3 m2) occupied by each tree.
Leaf abscission was monitored by collecting the litter from nets placed under each selected plot on the same sampling date. NPPlwas thus calculated using Eq. (4).
NPPf – once a month, flowers (April) and fruit (from May till October) were counted on the selected branches. The to-tal number of fruit per plant was counted at harvest (October) and a multiplicative factor was used to extrapolate fruit num-ber reduction due to early drop from selected branches to the whole tree, thus obtaining an estimate of total number of fruit per tree throughout the season. In a similar way as for the leaves, in order to assess C allocation to fruit, the total number of fruit was multiplied by their mean dry weight at each sampling date and by the mean C content. Equation (4) was applied to assess NPPf.
NPPwAG – NPPwAG was assessed as the difference
be-tween values of AG woody standing biomass (woodAG)
cal-culated over time (Eq. 5). woodAG was modeled based on
measured tree circumferences at 10 cm above grafting points for each selected tree (n=30). The allometric equation used to determine it was
woodAG=axb, (6)
wherex is the diameter at 10 cm above the grafting point, a andb are parameters of the appropriate power equation (Table 1).
Table 1. Coefficients of the power allometric equation found for aboveground woody biomass (woodAG)and belowground woody biomass (woodBG). The “woodAG” equation is calculated using the “pruned aboveground woody biomass” equation (woodAG p) at the beginning of the season and the “not-pruned aboveground woody biomass” equation at the end of the season (woodAG np), thus accounting for the pruning material. Reported are parameters with their relative standard errors.
Woody organs n Intercept±se Exponent±se R2 pvalue
woodAG np 11 229.3158±1.3820 1.6115±0.1787 0.9105 <0.001 woodAG p 11 202.9379±1.3682 1.6115±0.1787 0.9105 <0.001
woodAG 2 0.0384±na 6.2470±na na na
woodBG 11 46.7026±1.9599 1.7694±0.3716 0.7391 0.0014
whether allometric equations are applied to pruned or un-pruned trees. To consider this effect, we built a first allo-metric equation with pruned trees (woodAG p)and a second
equation with unpruned trees (woodAG np; see respective
pa-rameters in Table 1). Based on our measurements, pruning material was quantified in 11.5 % of AG woody biomass. To calculate the woodAGat monthly time steps, a third
allomet-ric equation (see Table 1 for equation parameters) was deter-mined with an initial value (April) on the ordinate set by the equation for pruned trees and the final value (November) on the ordinate set by equation for unpruned trees.
NPPwBG – the belowground (BG) standing biomass
present within a radius of 15 cm around the tree stem, to a vertical depth of 1 m, was determined during the excava-tion of the trees used for NPPwAG, This value was integrated
in space by considering the coarse roots excavated through soil coring (see below). Coarse roots were considered if they measured>2 mm in diameter. Spatial interpolation was per-formed by ordinary kriging, assuming a maximum root depth of 1 m. A power allometric equation was established to re-late tree diameter and belowground woody organs (woodBG).
The following equation was used to model woodBG:
woodBG=cxd, (7)
wherexis the diameter at 10 cm above the grafting point and candd are the parameters of the best fitting power equation reported in Table 1. We assumed that all coarse root growth accounted for standing biomass increase, so not contribut-ing to detritus cycle. We therefore used Eq. (5) to determine NPPwBG.
NPPfr – in March 2010, an intensive soil sampling cam-paign was carried out in order to assess the mean root biomass and its distribution. One tree per plot was selected and 17 soil cores were taken at each of the six plots, along two parallel lines across tree rows at different distances (>15 cm) from the tree trunks. Each soil core was divided into 3 depth levels: 0–20, 20–40 and 40–60 cm. Each soil sample (n=306) was sieved to extract roots, separating them into coarse (diameter>2 mm) and fine (<2 mm) roots. Interpolation in space of fine root density values was per-formed as for coarse roots.
In summer 2009, several minirhizotrons were installed in the apple orchard, at distances of 15, 35, 55 and 150 cm from the tree. They consisted of transparent Plexiglas tubes (8 cm diameter, 1 m length) inserted into the soil on an angle of 45◦for approximately 90 cm, thus exploring a soil depth of 60 cm. Starting from 18 March 2010, root growth was moni-tored by collecting periodic images inside the minirhizotrons using a root scanner (CI-600 Root Scanner, CID-Inc, Camas, WA, USA). After a first screening of the collected images, 8 representative minirhizotrons were considered for the anal-ysis. To assess fine root NPP, their relative growth rate was calculated by image analysis (WinRHIZO software, Regent Instruments, Canada). Since it was difficult to ascertain if brown, old roots were still alive, tracks of the newly formed white roots were added to those already present in the elabo-rated images. In such a way, the amount of fine roots derived from image analysis represented a virtual Sb given by the sum of roots already present in March (t0)and those
pro-duced during that year. From the ratio between successive values of virtual standing biomass and the one determined at t0, we obtained the relative growth rate, which was
ap-plied to the value of initial fine root biomass assessed by soil coring. NPPfr was determined as the difference of Sb values assessed over time (Eq. 5). No distinction was made between the growth pattern of grass and tree roots.
To estimate the amount of fine root production feeding the detritus cycle, we assumed a constant ratio between the standing biomass of fine and coarse roots in the dormant sea-son and that the excess in fine root production was annually shed.
NPPu – NPP of the understory was assessed on the ba-sis of the biomass mowed in the grassed alley: close to the monitored trees, 6 control plots of 1.8 m2were selected and mowed on a monthly basis. Grass root growth, observed with minirhizotrons, was considered as an NPPfr component. The herbaceous biomass grown along the tree row in periods be-tween tillage events was assumed to be negligible.
2.3.3 Soil respiration measurements
An automatic multichambered CO2 soil flux measurement
its heterotrophic component (Rh) along the tree row. Four
chambers were kept on the same collars for the whole sea-son, while the other four were rotated over 12 different posi-tions on a weekly basis. Fluxes in each chamber were taken every half hour. Out of the 16 collars installed as described in Sect. 2.2, eight were on control plots (to assessRs) and eight
were on trenching plots (to assessRh). CO2 concentration
values were taken every second for a measurement period of 2 min and 35 s. The first 45 s were considered as a mixing period and excluded from the calculation of the soil CO2
ef-flux, which was obtained from the linear regression of the increasing CO2concentration within the chamber over 1 min
and 50 s.
Soil respiration measurements with the automated cham-bers were performed during the snow-free period. Until March, measurements were done at a single location to mea-sureRs. Overall, more than 26 000 data points for both Rs
andRhwere recorded, and gaps represented 46.2 % forRs
and the 57.1 % forRh of the annual half hours. As quality
control we used the correlation coefficient of the linear rela-tion between time and CO2concentration, discarding values
withR2below 0.95 – a more restrictive threshold than that 0.90 proposed by Savage et al. (2008). Gap filling was per-formed on data collected at each collar following the LUT method, with air temperature and soil humidity as indepen-dent variables. TotalRsandRhwere calculated by summing
the gap-filled time series.
A possible source of systematic error occurring with au-tomated system is linked with the limited spatial represen-tativeness of the point of Rs measurement (Savage et al.,
2008), imposed by the nature of the system and the logis-tics of the study site. In order to obtain reliable values ofRs, Rh, andRa BG(belowground autotrophic respiration,
calcu-lated as Rs–Rh), for the whole ecosystem, in June 2010 a
parallel soil respiration measurement campaign was carried out in order to (1) take into account the spatial variability of soil respiration in the treelines (the soil strips under the tree canopy, 1.2 m width) and to (2) estimate the soil respi-ration in the areas corresponding to the grassed alleys (1.8 m width). Six collars (10 cm diameter) were placed at differ-ent distances from the trees (5 in the treeline and 1 in the grassed alley) in each plot used for biometric measurements (36 collars in total) and 7 measurement cycles of Rs over
one week were performed for each collar by a second LI-8100 with a LI-LI-8100-102 survey chamber. The relations of Rswith air temperature observed in the collars located in the
treelines and in the grassed alleys during this campaign were used to upscale continuous measurements to the whole or-chard. The limited availability of a second analyzer for Rs
measurements did not allow us to repeat this parallel survey campaign in other periods of the season. We recommend this operation to be done in order to take properly into account the seasonal differences in the patterns of local and spatial values ofRs.
2.4 Raassessment
Autotrophic respiration was not measured directly but de-rived in three ways from measurements that rely on different methodologies. The first method follows the equation
Ra=GPP−NPP, (8)
where GPP is derived from EC and NPP is assessed biomet-rically.
The second method follows the equation
Ra=Reco−Rh, (9)
where the first right-hand term is EC derived and the latter is measured with the soil chamber system.
The third method to assess Ra is independent from EC
measurements. It is based on the estimate of the autotrophic component of the soil respiration (Ra BG=Rs−Rh)and on
the approach suggested by Reich et al. (2006), who observed a consistent near-isometric scaling of total and aboveground plant respiration (Ra AG)to total and aboveground plant N
content across different taxa, environments and experiments. We firstly calculated the amount of N present in the root biomass of the grassed alleys and in the root biomass of the treelines, then we scaled upRa BG to the whole ecosystem
according to the N distribution in plant organs. By this method,
Ra=k(Ra BG), (10)
where the coefficientkaccounts for the ratio between mea-sured total and belowground N content (Table 2). This up-scaling does not take into account the seasonal variability in above and below standing biomass and N concentration. Based on the studies of Ceccon et al. (2011) and Akburak et al. (2012), the increase of N content in roots late in the grow-ing season can partly compensate the parallel increment of N content in the AG biomass. Additional measurements of N and C content along the season would be required to shed light on the internal cycling of these elements and to reduce uncertainties in computation of this scaling factor.
2.5 NPP, GPP and CUE estimates
NPP was assessed biometrically (NPPbiom)by adding the
cu-mulated values of each NPP component considered in the biometric measurements and by summing the yearly NEP andRh(NPPflux), thus involving eddy covariance and the soil
respiration chamber system, respectively. The daily carbon uptake rate was calculated by dividing both the cumulated NPPbiomand NPPfluxat each sampling date by the number of
days between the current sampling date to the previous one. GPP was calculated following two methods. The first an-nual estimate of it (GPPEC)was obtained from flux
Table 2. Distribution of dry weight (DW), C and N stocks within the ecosystem at the beginning of the growing season (March 2010). woodAG includes trunks and standing branches of different age; woodBGrepresents coarse roots (Table 1). Fine roots were obtained by the intensive soil core sampling conducted in March 2010. Soil C and N content in the upper 60 cm of soil were 21.3±2.8 and 2.5±0.3 kg m−2, respectively.
Components DW C N
(March 2010) kg m−2 % kg m−2 % kg m−2 %
woodAG 1.85 72.3 0.84 72.4 0.014 65.7 woodBG 0.42 16.3 0.19 16.4 0.003 15.3 Fine roots 0.29 11.4 0.13 11.2 0.004 19
Total 2.56 100 1.16 100 0.021 100
the eddy covariance methodology by summing NPPbiomwith
theRaassessed using Eq. (10).
To assess the yearly value of CUE, we divided annual val-ues of NPPbiomand NPPfluxby both GPPECand GPPBS, thus
obtaining four CUE estimates. Out of these estimates, only the first one (NPPbiom/GPPEC)is truly independent, while
the other three are inherently autocorrelated (Vickers et al., 2009).
The seasonal trend of CUE was assessed in two ways (CUEbiom and CUEflux) – by dividing the NPPbiom and
NPPflux values at each sampling date by the respective
GPPECamount.
2.6 Statistical analysis and uncertainty estimate
Random and systematic errors affecting biometric, eddy co-variance and soil respiration measurements (Clark et al., 2001; Loescher et al., 2006; Savage et al., 2008) contribute to the uncertainty in the estimate of each flux component. The different spatial representativeness of the measurement techniques deployed is an additional source of uncertainty affecting the overall carbon cycle estimate. We evaluated the uncertainty in EC-based fluxes estimates by comparing re-sults from different gap-filling and partitioning methods. Un-certainties (expressed as standard error, se) on Rs andRh
were evaluated from the gap-filled data obtained from the different collars (n=8). These estimates were horizontally scaled based on the ratio betweenRs measurements of the
multichambered system and those from the spatial survey (n=210). Uncertainties in this ratio as well as in the ratio (k) used to scale upRa BGto totalRawere computed
follow-ing Eqs. (11) and (12).
Additive and multiplicative random errors in biometric es-timates were calculated by means of the error propagation theory (Taylor, 1982). When two means (XandY) with their standard errors of the mean (SEMx and SEMy)were added yielding the valueZ, the standard error ofZ (SEMz) was calculated as follows:
SEMz= q
(SEMx)2+(SEMy)2, (11)
Fig. 1. Eddy covariance measured and derived C fluxes (g C m−2d−1). Blue dots show NEE, with negative values indicat-ing days in which the ecosystem is actindicat-ing as a sink of C. Red trian-gles and green squares represent dailyRecoand GPP obtained from flux partitioning of NEE data via LUT method.
while ifX andY were multiplied, the resulting SEMz was calculated as follows:
SEMz=Z× s
SEM
x X
2 +
SEM
y
Y 2
. (12)
3 Results
3.1 The ecosystem carbon stocks and fluxes
Soil was found to be by far the highest carbon pool, contain-ing in the first 60 cm much more carbon than the standcontain-ing biomass (21.3 vs. 1.2 kg C m−2). Data relative to the stocks
of carbon and nitrogen within the ecosystem at the beginning of the growing season (March 2010) are reported in Table 2: the relative distribution of tree biomass dry weight, as well as C content, was 72 % aboveground and 28 % belowground, while N was 66 % aboveground and 34 % belowground.
3.1.1 Fluxes from eddy covariance
Table 3. Parameters of theQ10model fitted for the contemporary measurements of soil respiration obtained by the multiplexed sys-tem and the survey chamber syssys-tem.
Methodology Rb Q10
Continuous measurements 6.079±0.406 1.221±0.061 Survey chamber 4.668±0.498 1.226±0.097
−7.21 g C m−2d−1(25 June). On a yearly basis, GPP,Reco
and NEP (= −NEE) accounted for 1263±189, 883±160 and 380±30 g C m−2yr−1 respectively, according to the LUT method. Uncertainties were determined as standard er-ror obtained from comparison with other interpolation algo-rithms for gap filling and flux partitioning. Following Re-ichstein et al. (2005), GPP was 1074, Reco 723 and NEP
351 g C m−2yr−1. Following Lasslop et al. (2010), these val-ues were 945, 433 and 512 g C m−2yr−1, respectively.
3.1.2 Fluxes from soil respiration system
Measured soil respiration (Rs)and its heterotrophic
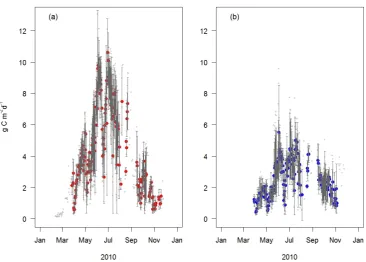
compo-nent (Rh)fluxes over the season are shown in Fig. 2.
Accord-ing to results from the spatial variability campaign, we found that continuous chamber measurements were taken in a spot where the CO2 efflux from the soil was above the average
since they were done in a treeline (Fig. 3) and in positions (Fig. 4a), close to the trees, having high emission. A two-samplettest was carried out to compareRsobtained from the
two measurement systems.Rswas significantly higher in the
multiplexed system (mean=8.21 µmol CO2m−2s−1) than
in survey chamber mode (mean=6.54 µmol CO2m−2s−1; t=9.996, p <0.001, degree of freedom=147). Observed temperature sensitivity was similar, but the basal respiration, Rb, was larger in the spot where continuous measurements were taken (Table 3). Assuming that the observed relation between continuous and survey measurements was constant along the year, we calculated a constant multiplicative factor of 0.797 to upscale continuous measurements to the treelines and a second multiplicative factor of 0.831 to estimate the Rs in the grassed alleys (Fig. 4a). Total Rs resulted as the
weighted average of these estimates.
By using the LUT method, upscaledRsandRhaccounted
for 801±95 and 614±97 g C m−2yr−1, respectively. To as-sess the robustness of these estimates, we also modeledRs
by theQ10 (van’t Hoff, 1884) and by the Lloyd and
Tay-lor (1994) models, and with both models the yearly amount ofRs andRhwere within the uncertainty levels mentioned
above.
3.1.3 Fluxes from biometric sampling
The monthly results of the biometric measurements of NPP are shown in Fig. 5 and in Table 4 with related uncertainties.
Leaf production, 106±5 g C m−2yr−1, represented 11 %
of NPP. Leaf growth occurred mostly between April and early June, when leaves represented 44 % of NPP. Reduced leaf growth was observed until September.
Fine root production showed three distinct peaks: the first one occurred before maximum leaf production, the second one just after it and a third one in October, after a reduced growth period in summer. On annual basis, NPPfr was 14 % of NPP. Assuming that the increase in fine roots follows the same growth pattern as coarse roots, C allocated to stand-ing fine roots is 6±1 g C m−2yr−1, while the remainder, 124±27 g C m−2yr−1, is supposed to be shed annually and to feed the detritus cycle.
The relative growth of woody organs was larger dur-ing sprdur-ing and early summer (21 % of total NPP) and decreased to 8 % from the end of August till the end of the vegetative season. On annual basis, NPPwAG was
173±53 g C m−2yr−1 (18 % of total NPP); the largest
part of this component was accounted for by pruned wood feeding the detritus cycle (147±45 g C m−2yr−1), while the increment in standing wood biomass was 26±8 g C m−2yr−1. Carbon allocated to belowground struc-tural organs accounted for only 1 % of total woody NPP (NPPwBG=13±3 g C m−2yr−1).
From June until the harvest, fruit represented the largest sink. Carbon allocation to this organ was more than 65 % of total NPP in July and August and more that 75 % of total NPP in September and October. On annual basis, carbon allocated to fruit was 495±35 g C m−2, equal to 52 % of total NPP.
Aboveground primary production of the understory (NPPu)was a significant component of total NPP, account-ing for 42±3 g C m−2, 5 % of total NPP, with a long growth
period (March–November) and a relatively constant growth rate throughout the season.
The total NPPbiom, obtained by the sum of the cumulated
values of each considered NPP component (Table 5), was 960±70 g C m−2yr−1. Summarizing the fate of NPP com-ponents, we obtained that 45±9 g C m−2yr−1represent an increase in standing biomass, 471±35 g C m−2yr−1are ex-ported and 444±53 g C m−2yr−1feed the detritus cycle.
3.2 Independent assessment of NPP,Ra, GPP and the
overall carbon cycle
Equations (2) and (3) show the relation among NPP,Raand
GPP and their importance for the determination of CUE. In this study the annual amount of each of these three C fluxes was obtained following at least two independent pathways.
The results of biomass accumulation of the ecosystem components considered at each sampling date are reported in Table 4, while Fig. 6 shows the daily carbon uptake rate of both NPPbiom and NPPflux. Daily NPPbiom showed
Fig. 2. Average daily soil respiration (g C m−2d−1)measured in control (a) and trenching plots (b) with the multiplexed system along the treeline. Data from each single collar are plotted with gray asterisks (∗). Dots represent dailyRs(a) andRh(b), when data from at least three chambers passed the quality test. Bars are standard deviation of the mean.
Table 4. Biomass production (g DW m−2±standard error) in the monitored tree organs between each sampling date.
Sampling date Leaves Fruit woodAG woodBG Fine roots Understory Total
20 Apr 2010∗ 32.7±1.7 0 26.9±59.1 −0.6±3.4 85.9±45.6 9.0±1.2 153.8±74.7 11 May 2010 108.2±5.5 29.4±4.6 75.8±31.1 9.6±4.0 22.7±52.7 4.3±0.1 250.1±61.7 23 Jun 2010 48.6±6.2 194.5±41.2 79.6±21.4 9.3±1.7 87.8±59.0 20.1±4.4 440.0±75.4 15 Jul 2010 22.8±4.2 273.5±54.9 75.1±68.1 1.9±3.2 17.9±65.5 17.3±1.5 408.5±109.4 20 Aug 2010 7.8±2.5 266.4±57.7 89.8±54.1 7.2±1.9 15.0±48.0 20.0±2.6 406.2±92.6 15 Sep 2010 12.4±3.4 294.3±61.4 30.4±30.4 1.1±1.1 10.8±51.6 24.3±3.8 373.3±85.9 14 Oct 2010 0 181.2±33.7 17.5±9.3 2.6±1.2 35.5±75.2 8.3±2.3 245.1±83.0
16 Nov 2010 0 0 −13.3±9.6 −1.8±1.1 16.3±78.1 0 16.3±78.1
Total 232±10 1239±88 382±117 29±7 292±62 103±6 2278±160
∗Data of the first sampling refer to biomass production from bud burst.
occurred from mid-June until mid-July for both NPPbiom
(7.80±2.18 g C m−2d−1)and NPP
flux(10.32 g C m−2d−1).
Although some discrepancies emerge when comparing the two curves (NPPflux-NPPbiom= −2.9 g C m−2d−1 in May, −1.5 g C m−2d−1in September,+1.3 C m−2d−1in Novem-ber), we found good agreement between these two indepen-dent methods of determining NPP, confirmed by the sur-prisingly close value of yearly NPPbiomand NPPfluxvalues,
which were 960±70 and 994±101 g C m−2yr−1, respec-tively.
As mentioned above,Rawas the only element of the C
cy-cle that was not measured directly. Each of the three equa-tions applied implies the integration of different
method-ologies and leads to sensible different estimates ofRa
(Ta-ble 6). Following Eq. (8),Ra was 303±202 g C m−2yr−1,
a value close to the result of Eq. (9), which leads to a Ra of 269±187 g C m−2yr−1. The third method, Eq. (10),
relying on soil chamber methodology and measurements on N content in the biomass, gives estimates significantly higher with respect to the previous two, with Ra being
545±195 g C m−2yr−1.
On a yearly basis, it was possible to estimate GPP independently from EC measurements. GPPBSwas obtained
by summing NPPbiom with Ra determined by Eq. (10),
[image:9.595.70.525.398.528.2]Table 5. Yearly NPP values of the ecosystem components measured biometrically (data are expressed in g DW m−2yr−1 and g C m−2yr−1±standard error of the mean).
NPP component DW (g m−2yr−1) DW (%) g C g DW−1 C (g m−2yr−1) C (%)
NPPl 232±10 10 0.458 106±5 11
NPPf 1239±88 55 0.400 495±35 52
NPPwAG 382±117 17 0.454 173±53 18
NPPwBG 29±7 1 0.453 13±3 1
NPPfr 292±62 13 0.444 130±28 14
NPPu 103±6 5 0.410 42±3 4
NPPtotal 2278±160 100 960±70 100
Fig. 3. Comparison ofRs data (µmol CO2m2s−1)obtained from the multiplexed system (a) with those obtained from the survey chamber (b). Crosses indicate the average value; blue bars indicate the standard error. All the measurements were taken along the tree-line in the same time period (24–30 June 2010), to account for the variability within the orchard treelines. Letters (A to F) represent the six plots of the survey campaign.
GPPBS was approximately 250 g C m−2yr−1 greater
(1505±207 g C m−2yr−1).
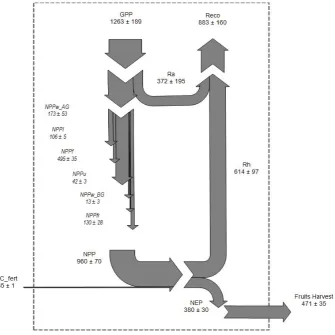
All the C fluxes measured within the ecosystem during 2010, and lateral import and export, are shown in Fig. 7. The Ra value reported in Fig. 7 (372±195 g C m−2yr−1)refers
to the average±se ofRaobtained by Eqs. (8), (9) and (10)
presented in Table 6.
3.3 CUE: seasonal trend and yearly value
The seasonal trend of CUEbiom and CUEflux is shown in
Fig. 8. Significant differences between the two estimates oc-curred at the beginning of the growing season and at its end, after harvest. When analyzed separately, CUEbiom showed
Table 6. Computed values ofRa (±se) obtained from the three methodologies discussed in Sect. 2.4 (Eqs. 8, 9 and 10). The co-efficientk obtained from the ratio between total and BG nitrogen content in the standing biomass was 2.92±0.27. The averageRa value (372±195 g C m−2yr−1) is reported in Fig. 7.
Model Methodology Ra(g C m−2yr−1)
[image:10.595.126.473.98.197.2]1 GPP–NPPbiom EC – biometric 303±202 2 Reco–Rh EC – soil chambers 269±187 3 k(Ra BG) Soil chambers 545±195
Table 7. The four approaches used to assess the CUE (±se) of the studied apple orchard. (average=0.71±0.12).
Model CUE
NPPbiom/GPPEC 0.76±0.13 NPPflux/GPPEC 0.79 ±0.14 NPPbiom/GPPBS 0.64±0.10 NPPflux/GPPBS 0.66±0.11
an irregular pattern with a decreasing trend throughout the season, while CUEflux showed its highest values during the
summer months. In both cases CUE was above 0.5 for the whole growing season. Based on results shown in the previ-ous sections, on a yearly basis we obtained four estimates of CUE and their respective standard errors (Table 7), giving an average value of 0.71±0.12.
4 Discussion
4.1 Magnitude of C fluxes
[image:10.595.311.546.286.341.2]Fig. 4. Soil respiration (a, µmol CO2m2s−1)and N content in root biomass (b, g N m−3soil) measured across the treeline and the grassed alley, where “zero” indicates the position of the apple tree. Measurements were performed in the six different plots used for the spatial survey. Bars represent standard error (se) of the mean.
Fig. 5. NPP (g C m−2)between each sampling date interval calcu-lated in the six considered ecosystem compartments. Bars’ width reflects the time (in days) that occurred between successive biomet-ric samplings.
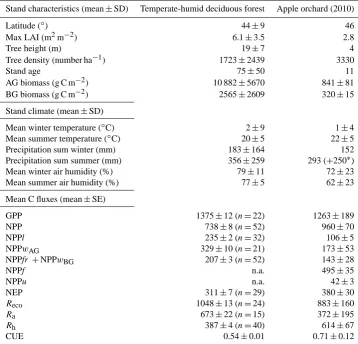
[image:11.595.51.285.304.508.2]Regarding the average ecosystem characteristics, it appears that apple trees are smaller in size (height, AG and BG biomass) with respect to trees growing in forests, and have a smaller LAI since they are kept structurally similar to young forest, although with a lower stem density (Luyssaert et al., 2008). Climate characteristics of the study site are very sim-ilar to the average observed in temperate-humid forests, with the exception of summer precipitation; in the apple orchard, water was additionally supplied by irrigation – a practice that eliminates major stress due to drought in the summer period. Based on our results, EC ecosystem carbon fluxes (GPP, NEP
Fig. 6. Annual pattern of NPP (g C m−2d−1). The dashed line represents daily NPP obtained from biometric measurements (NPPbiom) and the solid line represents the 15 days moving av-erage of NPP obtained by summing the daily fluxes of Rh and NEP (NPPflux). Bars represent standard error (se) of the mean daily NPPbiom.
andReco)obtained in the studied agro-ecosystem are
quan-titatively similar to a forested stand. We obtained slightly lower GPP andRecovalues and a larger NEP, but differences
were within 100 g C m−2yr−1.
The estimate ofRhwas obtained by measuringRs from
[image:11.595.310.543.307.514.2]Fig. 7. Sankey plot of the carbon cycle of the studied agro-ecosystem for the year 2010. Data are in g of C m2yr−1for each component of the C cycle. Arrows’ width reflects the flux size. GPP=gross primary production; Ra=autotrophic respiration; Reco=ecosystem respira-tion; Rh=heterotrophic respiration; NPP=net primary productivity; NPPwAG=aboveground wood NPP; NPPl=leaf NPP; NPPf=fruit NPP; NPPu=understory NPP; NPPwBG=belowground wood NPP; NPPfr=fine roots NPP; OCfert=organic carbon content of fertilizer; NEP=net ecosystem productivity; Fruit Harvest=fruit production exported from the ecosystem.
(Subke et al., 2006; Lambert et al., 2011). Among them, the most important is probably the fact that part of the measured C may come from decomposition of roots that are excised during the trenching process (Hanson at al., 2000). Following Fahey et al. (1988) and Bowden et al. (1993), we minimized the priming effect due to an excess of decomposable matter (Kuzyakov et al., 2000) starting the measurements approxi-mately 10 months after the trenching plots were set. Another problem could arise because of the higher soil water content of trenching with respect to the control sample due to the absence of root absorption. This may cause a change in the microbial community and in the rate of CO2emission
(D`ıaz-P`ınes et al., 2010) that we prevented starting from June 2010 by installing a plastic shelter approximately 1 m above the trenching plot. It has also been suggested that small trench-ing acts as a sink for CO2 from surrounding soil (Rachpal
et al., 2006), thus causing an overestimation ofRh. Despite
all limitations of the trenching approach and the assumptions that need to be made, the meta-analytical review published by Subke et al. (2006) reports general good agreement among
different methodologies in soil respiration partitioning, rein-forcing the reliability of our estimates.
The ratio Rh/Rs obtained in the present study (0.77) is
within the range of the studies carried out over temperate forests, as reviewed by Subke et al. (2006), and higher than the value (0.65) reported in an apple orchard by Panzacchi et al. (2012). Our averageRh(614±97 g C m−2yr−1)is also
higher when compared to the average Rh values reported
Table 8. Table of comparison between natural woody ecosystems of temperate-humid biomes (dataset of Luyssaert et al., 2007) and the studied apple orchard, a woody agro-ecosystem.
Stand characteristics (mean±SD) Temperate-humid deciduous forest Apple orchard (2010)
Latitude (◦) 44±9 46
Max LAI (m2m−2) 6.1±3.5 2.8
Tree height (m) 19±7 4
Tree density (number ha−1) 1723±2439 3330
Stand age 75±50 11
AG biomass (g C m−2) 10 882±5670 841±81
BG biomass (g C m−2) 2565±2609 320±15
Stand climate (mean±SD)
Mean winter temperature (◦C) 2±9 1±4
Mean summer temperature (◦C) 20±5 22±5
Precipitation sum winter (mm) 183±164 152
Precipitation sum summer (mm) 356±259 293 (+250∗)
Mean winter air humidity (%) 79±11 72±23
Mean summer air humidity (%) 77±5 62±23
Mean C fluxes (mean±SE)
GPP 1375±12 (n=22) 1263±189
NPP 738±8 (n=52) 960±70
NPPl 235±2 (n=32) 106±5
NPPwAG 329±10 (n=21) 173±53
NPPfr+NPPwBG 207±3 (n=52) 143±28
NPPf n.a. 495±35
NPPu n.a. 42±3
NEP 311±7 (n=29) 380±30
Reco 1048±13 (n=24) 883±160
Ra 673±22 (n=15) 372±195
Rh 387±4 (n=40) 614±67
CUE 0.54±0.01 0.71±0.12
∗Amount of water (mm) added by irrigation.
The protocol that was used to biometrically assess NPP accounts for four (out of six) hierarchical levels of the frame-work for NPP that was proposed by Luyssaert et al. (2007). We did not account for neither photosynthates released to symbionts or as root exudates, nor for non-CO2carbon
emis-sion (VOC, CO, CH4). Thus, apart from uncertainties in the
estimates of the other NPP components, the biometric value we found (960±70 g C m−2yr−1)is likely to be an underes-timation of the real NPP. There are few reliable esunderes-timations of the magnitude of the root exudates component and non-CO2
carbon emissions on total NPP in the literature (Grayston et al., 1997; Millard et al., 2007). These are often accounted as missing NPP due to the intrinsic difficulty of their direct as-sessment (Luyssaert et al., 2007) under field conditions. In the review of14C labeling studies on plant–soil interactions published by Farrar et al. (2003), it is suggested that exuda-tion may account for 5–10 % of net C assimilaexuda-tion, although Jones et al. (2004) revised this estimation to 2–4 % and other studies pointed out the dependency of the amount of root ex-udates on plant species, soil type, fertility and other climatic
variables (Cheng et al., 2007; Jones et al., 2009; Scandellari et al., 2007; Vicca et al., 2012). The NPP found in this study was about 200 g C m−2yr−1 higher with respect to natural forests of the same biome rank (Table 8). In a less produc-tive and less vigorous apple genotype, Panzacchi et al. (2012) have also found an average NPP value of 785 g C m−2yr−1. The presence of a large amount of fruit on an apple tree is known to enhance specific leaf photosynthesis as a conse-quence of their role as a sink, which allows for a more rapid download of photosynthates from the phloem with respect to apple trees not bearing fruit (Giuliani et al., 1997; Tartachnyk and Blanke, 2004).
4.2 Annual and seasonal C allocation pattern
Fig. 8. Seasonal trend of the carbon use efficiency. Triangles rep-resent CUE values obtained by dividing NPPbiom and GPPEC (CUEbiom); circles indicate CUE values obtained from the ratio be-tween NPPflux and GPPEC(CUEflux). Time period considered is the growing season 2010, from DOY 77 till DOY 291.
strongly oriented to fruit production. While deciduous forests of temperate-humid biomes allocate the fixed C primarily into leaves, wood and roots, with an incidence on total NPP of 30, 43 and 27 %, respectively (Table 8), these three NPP components in the studied orchard accounted for only 11, 18 and 15 % of total NPP, with fruit being by far the major NPP contributor (495±35 g C m−2yr−1, 52 % of total NPP).
When analyzing the seasonal trend of the C allocation pat-tern, it can be noticed that roughly 70 % of the leaves are set within 2 months after budburst, while aboveground woody organs show a constant growth until mid-August. Most root NPP is due to fine root production since apple trees are grafted on dwarfing rootstock and thus new coarse root pro-duction is rather limited. Results on fine root growth are con-sistent with findings published by Eissenstadt et al. (2006). The overall amount of fine root released to detritus cycle also agrees with findings of Wells and Eissenstadt (2001).
The apple orchard is also affected by significant lateral flows of C due to human activities which occur, with a different magnitude, in both inputs and outputs. As lat-eral C input, we must consider organic fertilization, a com-mon agricultural practice repeated every year for ensur-ing the reintegration of exported mineral nutrients, which accounted for about 35 g C m−2yr−1. The lateral C output flow is quantitatively much more important since it is rep-resented by the harvested apples that are taken away from the ecosystem for commercial purposes. In 2010 this com-ponent was quantified as 471±35 g C m−2yr−1 (74 t ha−1 fresh weight, corresponding to 95 % of NPPf ), while the
re-maining 5 % is accounted for by early drops and uncollected fruit (24±3 g C m−2yr−1)that enter the detritus cycle. The
estimated fruit production is slightly higher than the average yields observed in this area of intense apple production (ap-prox. 60 t ha−1).
The fate of the C contained in the abscised leaves of apple trees during their decomposition on the soil surface has been reported by Tagliavini et al. (2007), who showed that approx-imately 80 % of initial amounts are lost in the first 2 yr after leaf abscission. Ventura et al. (2009) reported that the decom-position of peach leaf litter is complete after 3 yr and about 10 % of initial amounts of leaf C are likely to be transformed into more stable C forms in the soil.
Our findings are consistent with other studies on apple trees of different growing conditions and varieties (Palmer, 1988; Minchin et al., 1997; Faqi et al., 2008), while a simi-lar incidence of fruit production on total NPP was also found in other agro-ecosystems, such as a coconut palm plantation (Navarro et al., 2008), peach (Chalmers and van den Ende, 1975), orange (Liguori et al., 2009) and kiwifruit orchards (Rossi et al., 2007). For comparison with other croplands see Ciais et al. (2010).
The fate of allocated carbon is partially different from forests, with a fraction of C exported from the ecosystem through apple production representing nearly half of total net primary production. About 46 % of annual NPP feeds the de-tritus cycle, and this is similar to natural forests if tree mor-tality is not considered (e.g., Tan et al., 2011), giving ample potential for the soil of the fruit tree ecosystem to act as a net carbon sink. The amount of NPP that increases the standing biomass, contributing to ecosystem C storage function (5 % of total NPP), is conversely much lower than in forests.
4.3 Independent assessment of NPP,Raand GPP
The methodological approach employed in the present study gave the opportunity to assess C fluxes involved in CUE de-termination through independent pathways. This allowed a cross check of the estimated fluxes, thus obtaining an impor-tant feedback on the robustness of the estimation.
NPP was assessed by using only biometric measurements of different ecosystem components (NPPbiom)and through
the sum of CO2fluxes obtained by EC (NEP) and soil
cham-ber (Rh)methodology (NPPflux). The seasonal trends, as well
as the yearly cumulated values, are very close to each other, supporting the reliability of the employed methodological approach.
Since no direct measurements of Ra were carried out, a
multiple approach was applied to assess it. As shown in Ta-ble 6,Ra was estimated by (i) coupling EC with biometric
measurements (GPP–NPP), (ii) coupling EC with soil cham-ber measurements (Reco–Rh)and (iii) coupling soil
registered in the present study, which is due to the relatively higher amount of C fluxes obtained via soil chambers with respect to the EC-derivedReco.
Mismatches between respiratory fluxes measured with dif-ferent approaches are frequently reported in the literature (Ryan et al., 1997; Lavigne et al., 1997; Law et al., 1999). They are possibly due to selective systematic errors that eas-ily occur at night by using the eddy covariance technique (Baldocchi, 2003; Aubinet, 2008), and also to random er-rors (Richardson et al., 2006), which may lead to uncertain-ties in the yearly NEE estimate, as well as the derivedReco
and GPP. Additional reasons for observed inconsistencies be-tween different measurement systems include chamber mea-surement accuracy, the mismatch of flux footprint, the under-representativeness of the point chosen for the measurements and the modeling of the missing data (Janssens et al., 2003)
We tried several methodologies for the gap-filling and flux partitioning procedure of our dataset, ranging from marginal distribution sampling (Reichstein et al., 2005) to light re-sponse curve (Lasslop et al., 2010), and to LUT (Moffat et al., 2007; Rossini et al., 2010 and present study), and we used the results from methodologies different from EC to assess the uncertainty in C flux estimates. Since the yearly amount of Rs measured by our multiplexed system was consistent
with other published data (Blanke et al., 1995; Koerber et al., 2009; Ceccon et al., 2011) and we are quite confident about the results derived from biometric measurements (NPPbiom),
LUT was the methodology which gave the most reliable es-timate of EC-derived GPP andReco. We chose it as the
ref-erence method, using the estimates from other methods to assess flux uncertainty.
The third method to assess Ra allowed us to obtain a
second estimate of yearly GPP (GPPBS) completely
inde-pendent of eddy covariance measurements. This yielded higher figures with respect to GPPEC by approximately
250 g C m−2yr−1, suggesting an underestimation of C fluxes with EC.
4.4 Annual and seasonal CUE
The hypothesis that CUE is constant among forests (Gifford, 1994, 2003; Dewar et al., 1998; Ryan et al., 1997), with a possible appropriate universal value of 0.47 (Waring et al., 1998), was rejected by De Lucia et al. (2007), who reported a systematic large variation of CUE among forest types (from 0.23 to 0.83) over a wide range of published data. Amthor (2000) suggested a theoretical possible interval of CUE be-tween 0.2 and 0.65, confirmed also by experimental results on herbaceous species by van Iersel (2003), with crops gen-erally having a higher value with respect to “natural” vegeta-tion (Amthor, 1989). More recently, Van Oijen et al. (2010) proposed a theoretical approach, based on the law of mass conservation, to analyze the quantitative relationships be-tween photosynthesis, respiration, growth and carbon stor-age in vegetation, suggesting a narrowly constrained
respi-ration to photosynthesis ratio. Vicca et al. (2012) observed a significant spread in CUE values among different ecosys-tems, suggesting the nutritional status, and the consequent re-duced allocation of photosynthates to symbionts, as the main driver for the variation found. The high CUE value found in this agro-ecosystem (0.71±0.09) can be explained by a rel-atively low level of plant respiration (Ra), by a lower amount
of photosynthates allocated to the non-biomass component of NPP, or both.
A possible explanation for a relatively lowRa level may
be found in both structural characteristics of the orchard and climatic conditions of the site. Regarding the first aspect, de-spite the fact that our understanding of plantRa is still
in-complete and poorly parameterized in current models (Piao et al., 2010), several studies (Ryan et al., 1997; Arneth et al., 1998; Law et al., 1999) highlighted the importance of the biomass composition in determining the totalRa, with
foliage respiration having the greatest incidence on totalRa
when considered over unit of biomass. In our apple orchard, leaves represent only 11 % of total NPP with respect to the average value of 30 % for deciduous forests (n=32) calcu-lated from the database of Luyssaert et al. (2007). Crops, on the contrary, allocate most of the C in storage organs such as seeds and tubers, which have a relatively small growth respi-ration and a generally low maintenance respirespi-ration (Amthor, 2000). In our case, 52 % of NPP was represented by fruit. Apple fruit have a specific cost for synthesis and main-tenance of approximately 1.15 g glucose g−1, significantly lower of that of apple leaves (1.44 g glucose g−1)and wood (1.30–1.33 g glucose g−1) (Walton et al., 1999) and a specific dark respiration that rapidly declines as growth by cell expan-sion begins (Jones, 1981; Bepete and Lakso, 1997). More-over, the yearly pruning of apple trees favors the exposition of apple leaves to direct light, thus enhancing their potential photosynthetic capacity. Our findings confirm the hypothesis that apple trees have relatively low autotrophic respiration rates compared to many other plants due to the low construc-tion costs of fruit (Lakso et al., 1999). The fact that apple trees grafted on dwarfing rootstocks, like in our study or-chard, have a relatively small tree framework and root system likely contributes to explaining the high value of CUE. Addi-tionally, the low nitrogen content of apple fruit (0.29 %) as-sociated with their elevated incidence on total plant biomass (33±7 %) are in line with Reich et al. (2006; see also Ryan et al., 1996), who observed an almost linear correlation be-tween total plant nitrogen and total plant respiration.
Climatic conditions may also contribute to explaining the high CUE observed: following findings of Piao et al. (2010) over a wide range of ecosystems, and the related debate (En-quist, 2011; Chen et al., 2011), it emerges a possible role of the mean annual temperature (MAT) in controlling theRato
of water availability prevent CUE drop due to drought (Met-calfe et al., 2011; Panzacchi et al., 2012).
The ratio between biomass production and GPP observed in the studied orchard is well above the regression line found in Vicca et al. (2012) even for the most fertile forest ecosys-tems. This suggests that multiple factors enhancing CUE have to be considered, including climate and plant physiolog-ical traits as well as management activities such as irrigation, fertilization and pruning.
This study helped assess the seasonal trend of CUE, us-ing both NPPbiomand NPPfluxover the same GPPECvalues.
According to Campioli et al. (2011), it is important to spec-ify that the variability of GPP estimates over a short period, depending on the selected partitioning method, may have a great effect on the CUE value, thus making it difficult to speculate on the absolute values observed along the season in each estimate, which in our case was occasionally above the unit. As shown in Fig. 8, the greatest discrepancy be-tween the two curves of CUEbiom and CUEflux occurs in
spring, particularly in the first two months after budburst, where NPPbiomestimate was greater than NPPfluxand in the
autumn, when the opposite was observed. Although the vari-ation of carbon reserves along the year in mobile forms such as starch was not measured, we interpreted these results as a clear sign of remobilization (Mauler et al., 2004; Millard et al., 2007), with apple trees using stored carbohydrates in the first two months after budburst and likely reallocating C to storage organs after harvest. Although a spring peak of CUE followed by a quick decline after May was observed by Campioli et al. (2011) in a temperate beech forest, in our case the NPP : GPP ratio was high also throughout the sum-mer, mainly due to the continued biomass accumulation in fruit. This suggests a lower accumulation of nonstructural soluble carbohydrates with respect to what is occurring in forests (Hoch et al., 2003).
5 Conclusions
This study demonstrates that the main ecosystem carbon fluxes of an 11 yr old apple orchard have a comparable mag-nitude with respect to deciduous forests growing in similar climate conditions. The major differences were a higher NPP in the apple orchard and a different allocation pattern of fixed C, with fruit representing approximately half of total yearly NPP. CUE, obtained from four methods, was 0.71±0.12, in-dicating an elevated capacity of the orchard to allocate pho-tosynthates to biomass production. The high amount of fruit biomass may be a possible explanatory reason for the high CUE found in the present study because of both the reported low respiratory costs for producing the simple sugars present in fruit and their low nitrogen content. The environmental conditions present in the orchards, obtained by pruning and supplying water and nutrients to the soil, represent another explanation for the high CUE, possibly limiting the transfer
of photosynthates to non-biomass components of NPP, such as root exudates.
Given the high amount of carbon allocated to apple fruit, mostly exported from the ecosystem every year, and the lim-ited amount of C that increases the standing biomass of apple trees, the role of the apple orchard to act as a sink of carbon to the atmosphere largely depends on the persistence of the fraction of C that annually feeds the detritus cycle.
This work suggests that in global biogeochemical model-ing, it has to be considered that the CUE of agro-ecosystems can be higher than that of forests growing in a similar cli-mate. Further research is needed to establish whether the high CUE observed is a common feature of agricultural systems.
Acknowledgements. This project was carried out with financial sup-port from Autonomous Province Bolzano-Bozen project “Assessing the potential for CO2sequestration by apple orchards in South Ty-rol” and from the Minister of University Prin 2008 project prot. 2008LX3AYP 001 “Carbon fluxes in the apple orchard”.
The authors wish to thank for their assistance and valuable support Christian Ceccon, Francesca Scandellari, Tanja Mimmo and Maddalena Bolognesi (Free University of Bolzano-Bozen) George Wellington Bastos de Melo (Embrapa Uva e Vinho, Brasil), Paulo Cassol (Santa Catarina State University, Brasil), Martin Thalheimer (Research Centre for Agriculture and Forestry, Laimburg, BZ) and Robert Sinn (owner of the experimental site). We wish to thank also the three anonymous reviewers for their thorough, constructive comments.
Edited by: P. Stoy
References
Akburak, S., Oral, H. V., Ozdemir, E., and Makineci, E.: Tem-poral variation of biomass, carbon and nitrogen of roots un-der different tree species, Scand. J. Forest Res., 28, 8–16, doi::10.1080/02827581.2012.679680, 2012.
Amthor, J. S.: Respiration and crop productivity, New York, Springer Verlag, 1989.
Amthor, J. S.: The Mc Cree-de Wit-Penning de Vries-Thornley res-piration paradigms: 30 Years Later, Ann. Bot.-London, 86, 1–20, 2000.
Arneth, A., Kelliher, F. M., McSeveny, T. M., and Byers, J. M.: Net ecosystem productivity, net primary productivity and ecosystem carbon sequestration in a Pinus radiata plantation subject to soil water deficit, Tree Physiol., 18, 785–793, 1998.
Arneth, A., Schurgers, G., Lathiere, J., Duhl, T., Beerling, D. J., Hewitt, C. N., Martin, M., and Guenther, A.: Global ter-restrial isoprene emission models: sensitivity to variability in climate and vegetation, Atmos. Chem. Phys., 11, 8037–8052, doi:10.5194/acp-11-8037-2011, 2011.
Aubinet, M.: Eddy covariance CO2flux measurements in nocturnal conditions: an analysis of the problem. Ecol. Appl., 18, 1368– 1378, 2008.