Annales Geophysicae (2002) 20: 275–280 cEuropean Geophysical Society 2002
Annales
Geophysicae
Letter to the Editor
A statistical study of the location and motion of the HF radar cusp
T. K. Yeoman, P. G. Hanlon, and K. A. McWilliams
Department of Physics and Astronomy, University of Leicester, University Road, Leicester, LE1 7RH, UK Received: 14 June 2001 – Revised: 1 October 2001 – Accepted: 2 October 2001
Abstract. The large-scale and continuous monitoring of the
ionospheric cusp region offered by HF radars has been ex-ploited in order to examine the statistical location and motion of the equatorward edge of the HF radar cusp as a function of the upstream IMF BZ component. Although a
consid-erable scatter is seen, both parameters have a clear influence from the north-south component of the IMF. Excellent agree-ment is achieved with previous observations from low alti-tude spacecraft data. The HF radar cusp region is seen to mi-grate equatorward at a rate of 0.02◦min−1nT−1under IMF
BZ south conditions, but remains static for IMFBZ north.
The motion of the cusp implies an addition of magnetic flux of∼2×10⁴Wb s−1nT−1under IMFB
Z south conditions,
equivalent to a reconnection voltage of 20 kV nT−1, which is consistent with previous estimates from case studies on both the dayside and nightside regions.
Key words. Ionosphere (auroral ionosphere) –
Magneto-spheric physics (magnetosphere-ionosphere interaction; so-lar wind magnetosphere interactions)
1 Introduction
Reconnection on the dayside magnetopause is the domi-nant mechanism by which energy and momentum are trans-ferred into the magnetosphere. Observations of both the magnetopause in situ and its ionospheric footprint have re-vealed these regions to be highly dynamic, and these dy-namics represent an active area of magnetospheric research. Under southward interplanetary magnetic field (IMF) con-ditions, the transfer of magnetic flux from the IMF to the magnetosphere was initially interpreted as a steady-state pro-cess, although considerable evidence now exists for a time-dependent mechanism, where flux transfer occurs in the form of discrete episodes, termed Flux Transfer Events (FTEs) (see Smith et al., 1992; Milan et al., 2000; McWilliams et al., Correspondence to: T. K. Yeoman
(tim.yeoman@ion.le.ac.uk)
2001 and references therein). As new open flux is added to the dayside polar cap magnetosphere via such bursts of mag-netic reconnection, the polar cap will adjust to a new equi-librium, with the polar cap boundary moving equatorward. HF coherent radars have provided a wealth of observations which have been associated with FTE activity and are an es-tablished tool for the study of such magnetopause processes via the monitoring of the large-scale electric fields which are imposed onto the dayside auroral zone ionosphere. The radars typically observe high velocity, anti-sunward tran-sient flow in the cusp ionosphere. Such signatures were first assumed to be the response to transient magnetopause re-connection by Pinnock et al. (1993; 1995). HF radar data have since then demonstrated that the anti-sunward bursts of flow are associated with individual FTEs at the magne-topause (Neudegg et al., 1999). A more statistical examina-tion was performed by Neudegg et al. (2000), who related the characteristic signatures of FTEs at the magnetopause, as observed by the Equator-S spacecraft, with the charac-teristic pulsed, anti-sunward flows observed in the HF radar data in the ionosphere, as detailed above, at the conjugate footprint of Equator-S. Neudegg et al. (2000) found a strong statistical association between the magnetopause and iono-spheric phenomena. HF radar data are also characterised by an equatorward progression of the dayside auroral zone dur-ing a sequence of episodes of flux transfer, as the auroral zone tracks the expansion of the polar cap (e.g. McWilliams et al., 2001). Such data have also provided a wealth of in-formation on the morphology, dynamics and scale size of the dayside reconnection process. Quasi-periodic sequences of such anti-sunward bursts of flow, termed pulsed ionospheric flows (PIFs), have been examined both statistically and in-dividually, and the spatial extent of these events, their flow orientation, MLT occurrence and dependence on IMF have also been examined. The statistical location and extent of the HF radar cusp (identified via the characteristic pulsed an-tisunward flows) have been presented by Provan and Yeo-man (1999), and the dependence on the IMF BY
276 T. K. Yeoman et al.: A statistical study of the location and motion of the HF radar cusp
70 75 80 85
Magnetic Latitude
70 75 80 85
Magnetic Latitude
-800 -600 -400 -200 0 200 400 600 800
Velocity (ms
-1
)
Ground Scatter
0600 0700 0800 0900 1000 1100 1200 1300 1400
UT 65
70 75 80 85
Magnetic Latitude
0600 0700 0800 0900 1000 1100 1200 1300 1400
UT 65
70 75 80 85
Magnetic Latitude
0 50 100 150 200 250 300 350 400 450
Width (ms
-1
)
Fig. 1
65 70 75 80 85 -8 -6 -4 -2 0 2 4 6
[image:2.604.56.418.70.512.2]IMF Bz / nT
Fig. 1. An example of the identification
of the HF radar cusp location and mo-tion from 06:00–14:00 UT on 4 January 2000. The top panel presents the IMF
BZcomponent magnetic field data from
ACE, timelagged by 68 min (see text for details). Both raw data at a time resolu-tion of 5 min, and data smoothed over 50 min are shown. The middle panel presents line-of-sight velocity data from beam 9 of the SuperDARN Hankasalmi radar as a function of magnetic latitude and Universal Time. A statistical Feld-stein oval is included for reference. The bottom panel presents beam 9 spectral width data in the same format. The equatorward edge of the region of high spectral width is marked with a line, at a time resolution of 5 min, and also smoothed over 50 min. Equatorward progression of the HF radar cusp is clearly related to intervals of southward (negative) IMFBZ.
the large-scale and continuous monitoring of the ionospheric cusp region offered by the HF radar technique in order to ex-plore both the statistical location and motion of the HF radar cusp as a function of the IMFBZcomponent.
2 Observations
2.1 Instrumentation
The data analysed in this study are provided by the CUT-LASS Hankasalmi HF radar (Milan et al., 1997), which forms the easternmost element of the Northern Hemisphere SuperDARN array (Greenwald et al., 1995). The radar is fre-quency agile (8–20 MHz) and routinely measures the line-of-sight (l-o-s) Doppler velocity, spectral width and backscat-ter power from ionospheric plasma irregularities. The radar
forms 16 beams separated by 3.24◦, each gated into 75 range gates. Here, we restrict ourselves to an analysis of the l-o-s velocity and spectral width data from the Hankasalmi beam 9, which is the meridionally directed beam. The prevailing IMF conditions are determined from the Advanced Compo-sition Explorer (ACE) MFE instrument (Smith et al., 1998; Stone et al., 1998) and are reduced here to a time resolution of 5 min. The data are time-lagged in order to account for the propagation from the Sun-Earth L1 libration point to the dayside auroral ionosphere, using the technique outlined in Khan and Cowley (1999).
2.2 Data analysis
T. K. Yeoman et al.: A statistical study of the location and motion of the HF radar cusp 277
Fig. 2
IMF Bz (nT)
Magnetic latitude of HF radar Cusp (˚)
-1.50 -1.40 -1.30 -1.20 -1.10 -1.00 60
[image:3.604.315.542.71.230.2]65 70 75 80
Fig. 2. Scatterplot of the locations of the HF radar cusp, such as
those illustrated in Fig. 1, for prevailing IMF conditions with a southward (negative) IMFBZbetween−1.5 and−1.0 nT.
presents the IMF BZ component magnetic field data from
ACE, time-lagged by 68 min, as described above. The data is presented at a time resolution of 5 min, and a time series boxcar averaged over 10 data points (50 min) is also pre-sented. The middle panel illustrates the line-of-sight veloc-ity data from beam 9 of the SuperDARN Hankasalmi radar as a function of magnetic latitude (Altitude Adjusted Cor-rected Geomagnetic coordinates are used here throughout; Baker and Wing, 1989) and Universal Time. The l-o-s ve-locities are colour-coded such that yellow and red represent negative Doppler shifts (poleward flow away from the radar). A statistical Feldstein auroral oval forQ = 0 (Feldstein, 1963; Holzworth and Meng, 1975) is indicated for refer-ence. Pulsed, anti-sunward velocities, characteristic of HF radar cusp activity are clearly seen for almost the entire in-terval. The bottom panel presents the beam 9 spectral width data in the same format. Here the equatorward edge of the region of high spectral width is used as an indicator of the latitude of the equatorward boundary of the HF radar cusp. The high spectral width region corresponds to the cusp, as determined from low latitude particle signatures in a number of case studies (Baker et al., 1990; 1995), and this boundary (here taken to be 200 m s−1) is marked with a line at a time
resolution of 5 min. Again, a time-series boxcar averaged over 10 data points (50 min) is also plotted. The equatorward progression of the equatorward edge of the HF radar cusp (henceforth referred to here simply as the radar cusp) can be clearly related to intervals of southward (negative) IMF
BZ in the top panel, thus displacing the boundary
equator-ward of the statistical oval in the interval 07:30–09:30 UT, and after 10:30 UT. Here such locations and motions of the radar cusp are examined statistically for the months of De-cember 1999 and January 2000, between 05:00–15:00 UT (∼07:00–17:00 MLT, i.e. 10 h of local time spread symmet-rically about noon). The MLT at which the radar cusp is observed is controlled by the IMFBY component, and such
a range of local times will include the vast majority of radar cusp observations at Hankasalmi (Provan et al., 1999). The
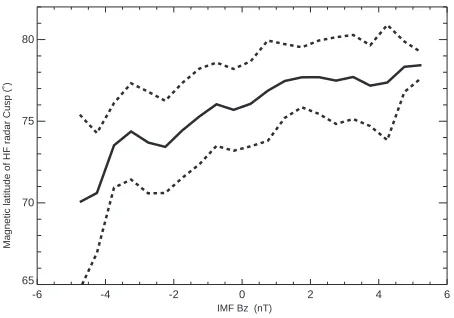
Fig. 3
IMF Bz (nT)
Magnetic latitude of HF radar Cusp (˚)
-6 -4 -2 0 2 4 6
[image:3.604.47.283.72.222.2]65 70 75 80
Fig. 3. The average location of the HF radar cusp as a function of
the prevailing IMFBZ component (solid line). The dashed lines
represent±1 standard deviation of the distribution of latitude val-ues. Only averages where more than 25 data points per bin were available are plotted.
winter 1999/2000 interval is chosen to maximize the obser-vation rate due to seasonal effects (Milan et al., 1997). This data set has provided some 300 h of simultaneous radar and spacecraft observations at 5 min resolution, with statistical analysis performed on the 50 min boxcar-averaged data sets, since short period fluctuations in the IMF and their effects in the dayside auroral zone are not the focus of the present study.
An example of the data from the statistical analysis is pre-sented in Fig. 2, depicting a scatterplot of the locations of the radar cusp, such as those illustrated in Fig. 1, for pre-vailing IMF conditions with a southward (negative) IMFBZ
component between−1.5 and−1 nT. A considerable scatter is observed and will be discussed below. The mean loca-tion of the radar cusp as a funcloca-tion of IMFBZin 0.5 nT bins
is illustrated in Fig. 3. A clear equatorward displacement of the average radar cusp location is apparent, with increasingly negative IMFBZ, although the considerable scatter in the
ob-servations from this mean behaviour is evident from the lines marking±1 standard deviations from the mean in Fig. 3.
The large-scale and near-continuous monitoring of the lo-cation of the radar cusp offered by the HF radar technique al-lows for the use of the time series of the radar cusp location, such as those presented in Fig. 1, to calculate the evolution of the radar cusp location, as well as its average position. Fig-ure 4 presents such an inferred radar cusp motion in degrees of latitude per minute, as a function of IMFBZ. For positive BZ, a near-static radar cusp location is evident. AsBZturns
Fig. 4
IMF Bz (nT)
Motion of HF radar Cusp (˚ latitude min
-1)
-6 -4 -2 0 2 4 6
[image:4.604.55.292.71.232.2]-0.15 -0.10 -0.05 0.00 0.05 0.10
Fig. 4. The average motion of the HF radar cusp as a function of the
prevailing IMFBZcomponent (solid line). The dashed lines
repre-sent±1 standard deviation of the distribution of latitude variation values. Only averages where more than 25 data points per bin were available are plotted.
3 Discussion
The location and motion of the radar cusp is strongly influ-enced by the IMFBZcomponent. However, it is clear from
Figs. 2–4 that a considerable scatter characterises both pa-rameters when organized solely by the IMFBZ. In part, this
is due to the history of the prevailing IMF conditions; the lo-cation of the cusp will respond to an integral of the IMFBZ
component for some prior period, and is also affected by sub-storm processes. The location of the ionospheric footprint of the cusp is also affected by the solar wind dynamic pressure (Zhou et al., 2000), and the IMFBY component (Newell et
al., 1989; Provan et al., 1999), which have not been consid-ered here. The MLT of the observation will also influence the observations, and this is illustrated in Fig. 1 via the statistical Feldstein oval. It is clear from Fig. 1 that the local time of observation will affect the deduced latitude of the HF radar cusp, with a change in the cusp latitude of∼ 0.01◦min−1 occurring due to local time effects. Since the local times cho-sen here for the statistical study are arranged symmetrically about noon, the effects of such variations will be apparent in the spread of values, rather than the averages obtained. The local time effects are also small, and thus equal in magnitude to the effect of an IMF BZ south of just 1 nT. As a result,
and due to the other effects which contribute to the spread of results detailed above, no explicit correction for MLT is ap-plied to the results discussed below. In spite of the effects outlined above, the average latitude of the location of the radar cusp determined here (75◦) corresponds very well to the equatorward boundary of the region of pulsed poleward flows (PPFs) observed by Provan et al. (1999) and Provan and Yeoman (1999). It is also in excellent agreement with the location of the equatorward boundary of the cusp as identi-fied in the DMSP data by Newell and Meng (1988). All three of these studies also placed the boundary at 75◦. Newell et al. (1989) explored the location of the equatorward edge of
the DMSP cusp as a function of IMFBZ, which was placed
at 73◦for an IMFBZof−5 nT, increasing to 77◦for a zero
IMFBZ, and then increasing more slowly to 78◦as BZ
in-creased to+5 nT. Again, the HF radar data presented here is in close agreement. The variation with IMF is also similar to recent high altitude measurements (Zhou et al., 2000), al-though the actual latitudes deduced from the high altitude lie poleward of the low altitude satellite and the radar observa-tions.
The motion of the radar cusp is examined in Fig. 4. For northward IMF, the location is seen to be static, as might be expected in the absence of subsolar dayside reconnection, which would add open flux. Lobe reconnection, unless oc-curring symmetrically in both hemispheres would leave the polar cap area unchanged. A closure of open flux due to sym-metrical lobe reconnection for strongly northward IMF has been suggested by a number of authors (e.g. Dungey, 1963; Song and Russell, 1992). The present study suggests that such a process is rare and overall, not an important mecha-nism in the closure of polar cap magnetic flux, although it might be important in individual case studies. This finding is in accord with earlier suggestions by Fusilier et al. (1995). No evidence is seen for substorm processes in the current data set, which would destroy open flux, and this might be expected to reduce the polar cap area, thus displacing the radar cusp poleward. Presumably such substorm activity is averaged out in such a statistical study keyed to IMFBZ. The
motion of the radar cusp varies from 0.02◦min−1 for IMF
BZ of −1 nT to 0.1◦min−1 when BZ decreases to−5 nT.
Assuming a circular, incompressible polar cap, these val-ues represent magnetic flux addition rates of 2×10⁴ and 105Wb s−1, respectively, or equivalently dayside reconnec-tion voltages of 20 and 100 kV. Such values are very simi-lar to posimi-lar cap expansion rates inferred from the equator-ward motion of HF radar data on the nightside during the substorm expansion phase (Lewis et al., 1998; Yeoman et al., 1999). The values of reconnection voltage also compare well with direct ionospheric measurements of the voltage as-sociated with FTE activity of∼60 kV for IMFBZ = −5 nT
(McWilliams et al., 2001) and 160 kV for IMFBZ = −13 nT
(Milan et al., 2000). Taylor et al. (1996) have suggested val-ues of flux addition of up to 5×10⁵Wb s−1during magnetic storm intervals. Any quasi-steady-state reconnection activity in the distant magnetotail would act to close open magnetic flux, and thus reduce the area of the polar cap. Such activity is not accounted for in the above analysis of rates of addi-tional open flux to the polar cap and reconnection voltages, and would need to be added to the figures presented above to obtain the true average dayside reconnection rates.
4 Summary
exam-T. K. Yeoman et al.: A statistical study of the location and motion of the HF radar cusp 279 ination of the location and motion of the equatorward edge
of the HF radar cusp as a function of the upstream IMFBZ
component. Considerable scatter is observed, since the IMF
BY component is not taken into account, which is known to
affect the cusp location or the IMF history, which will also have a profound effect. In spite of this, the location and motion of the radar cusp are both clearly influenced by the north-south component of the IMF. Excellent agreement is achieved with previous observations from low altitude space-craft data. The radar cusp region is seen to migrate equa-torward at a rate of 0.02◦min−1nT−1under IMFBZ south
conditions, but remains static for IMFBZ north. This
mo-tion of the radar cusp implies an addimo-tion of magnetic flux of∼2×10⁴Wb s−1nT−1under IMFB
Z south conditions,
equivalent to a reconnection voltage of 20 kV nT−1, which is consistent with previous estimates from case studies on both the dayside and nightside regions.
Acknowledgements. The CUTLASS HF radars are deployed and
operated by the University of Leicester, and are jointly funded by the UK Particle Physics and Astronomy Research Council (Grant no. PPA/R/R/1997/00256), the Finnish Meteorological Institute, and the Swedish Institute for Space Physics. KAM gratefully ac-knowledges funding from the British Council. We would like to thank the ACE Science Center and N. F. Ness for providing the ACE magnetic field data.
The Editor in Chief thanks a referee for his help in evaluating this paper.
References
Baker, K. B. and Wing, S.: A new magnetic coordinate system for conjugate studies at high latitudes, J. Geophys. Res., 94, 9139, 1989.
Baker, K. B., Greenwald, R. A., Ruohoniemi, J. M., Dudeney, J. R., Pinnock, M., Newell, P. T., Greenspan, M. E., and Meng, C.-I.: Simultaneous HF radar and DMSP observations of the cusp, Geophys. Res. Lett., 17, 1869, 1990.
Baker, K. B., Dudeney, J. R., Greenwald, R. A., Pinnock, M., Newell, P. T., Rodger, A. S., Mattin, N., and Meng, C.-I.: HF radar signatures of the cusp and low-latitude boundary layer, J. Geophys. Res., 100, 7671, 1995.
Dungey, J. W.: The structure of the exosphere or adventures in ve-locityu space, in: Geophysics, The Earth’s environment, (Eds) DeWitt, C., Hieblot, J., and LeBeau, A., 503–530, Gordon and Breach, New York, 1963.
Feldstein, Y. I.: On morphology of auroral and magnetic distur-bances at high latitudes, Geomagn. Aeron., 3, 183, 1963. Fuselier, S. A., Anderson, B. J., and Onsager, T.: Particle
signa-tures of magnetic topology at the magnetopause: AMPTE/CCE observations, J. Geophys. Res., 100, 11, 805, 1995.
Greenwald, R. A., Baker, K. B., Dudeney, J. R., Pinnock, M., Jones, T. B., Thomas, E. C., Villain, J.-P., Cerisier, J.-C., Senior, C., Hanuise, C., Hunsucker, R. D., Sofko, G., Koehler, J., Nielsen, E., Pellinen, R., Walker, A. D. M., Sato, N., and Yamagishi, H.: Darn/Superdarn: A global view of the dynamics of high-latitude convection, Space Sc. Rev., 71, 761, 1995.
Holzworth, R. H. and Meng, C.-I.: Mathematical representation of the auroral oval, Geophys. Res. Lett., 2, 377, 1975.
Khan, H. and Cowley, S. W. H.: Observations of the response time of high-latitude ionospheric convection to variations in the in-terplanetary magnetic field using EISCAT and IMP-8 data, Ann. Geophysicae, 17, 1306, 1999.
Lewis, R. V., Freeman, M. P., and Reeves, G. D.: The relationship of HF radar backscatter to the accumulation of open magnetic flux prior to substorm onset, J. Geophys. Res., 103, 26, 613, 1998. McWilliams, K. A., Yeoman, T. K., and Cowley, S. W. H.:
Two-dimensional electric field measurements in the ionospheric foot-print of a flux transfer event, Ann. Geophysicae, 18, 1584, 2001. Milan, S. E., Yeoman, T. K., Lester, M., Thomas, E. C., and Jones, T. B.: Initial backscatter occurrence statistics for the CUTLASS HF radars, Ann. Geophysicae, 15, 703, 1997.
Milan, S. E., Lester, M., Cowley, S. W. H., and Brittnacher, M.: Convection and auroral response to a southward turning of the IMF: Polar UVI, CUTLASS and IMAGE signatures of transient magnetic flux transfer at the magnetopause, J. Geophys. Res., 105, 15, 741, 2000.
Neudegg, D. A., Yeoman, T. K., Cowley, S. W. H., Provan, G., Haerendel, G., Baumjohann, W., Auster, U., Fornacon, K.-H., Georgescu, E., and Owen, C. J.: A Flux transfer event observed at the magnetopause by the Equator-S spacecraft and in the iono-sphere by the CUTLASS HF radar, Ann. Geophysicae, 17, 707, 1999.
Neudegg, D. A., Cowley, S. W. H., Milan, S. E., Yeoman, T. K., Lester, M., Provan, G., Haerendel, G., Baumjohann, W., Nikutowski, B., B¨uchner, J., Auster, U., Fornacon, K.-H., and Georgescu, E.: A survey of magnetopause FTEs and associated flow bursts in the polar ionosphere, Ann. Geophysicae, 18, 416, 2000.
Newell, P. T. and Meng, C.-I.: The cusp and the cleft/boundary layer: low-altitude identification and statistical local time varia-tion, J. Geophys. Res., 93, 14, 549, 1988.
Newell, P. T., Meng, C.-I., and Sibeck, D. G.: Some low-altitude cusp dependencies of the interplanetary magnetic field, J. Geo-phys. Res., 94, 8921, 1989.
Pinnock, M., Rodger, A. S., Dudeney, J. R., Baker, K. B., Newell, P. T., Greenwald, R. A., and Greenspan, M. E.: Observations of an enhanced convection channel in the cusp ionosphere, J. Geophys. Res., 98, 3767, 1993.
Pinnock, M., Rodger, A. S., Dudeney, J. R., Rich, F., and Baker, K. B.: High spatial and temporal resolution observations ofthe ionospheric cusp, Ann. Geophysicae, 13, 919, 1995.
Provan, G. and Yeoman, T. K.: Statistical observations of the MLT, latitude and size of pulsed ionospheric flows with the CUTLASS Finland radar. Ann. Geophysicae, 17, 855, 1999.
Provan, G., Yeoman, T. K., and Cowley, S. W. H.: The influence of the IMFBY component on the location of pulsed flows in
the dayside ionosphere observed by an HF radar, Geophys. Res. Lett., 26, 521, 1999.
Smith, M. F., Lockwood, M., and Cowley, S. W. H.: The statistical cusp: A flux transfer event model, Planet. Space Sci., 40, 1251, 1992.
Smith, C. W., Acu˜na, M. H., Burlaga, L. F., L’Heureux, J., Ness, N. F., and Scheifele, J.: The ACE Magnetic Fields Experiment, Space Sci. Rev., 86, 611, 1998.
Song, P. and Russell, C. T.: Model of the formation of the low-latitude boundary layer for strongly northward interplanetary magnetic field, J. Geophys. Res., 97, 1411, 1992.
Taylor, J. R., Yeoman, T. K., Lester, M., Emery, B. A., and Knipp, D. J.: Variations in the polar cap area during intervals of sub-storm activity on 20–21 March 1990 decuced from AMIE con-vections patterns, Ann. Geophysicae, 14, 879, 1996.
Yeoman, T. K., Lewis, R. V., Milan, S. E., and Watanabe, M.: An interhemispheric study of the ground magnetic and ionospheric
electric fields during the substorm growth phase and expansion phase onset, J. Geophys. Res., 104, 14, 867, 1999.