Ann. Geophys., 31, 755–764, 2013 www.ann-geophys.net/31/755/2013/ doi:10.5194/angeo-31-755-2013
© Author(s) 2013. CC Attribution 3.0 License.
EGU Journal Logos (RGB)
Advances in
Geosciences
Open Access
Natural Hazards
and Earth System
Sciences
Open AccessAnnales
Geophysicae
Open AccessNonlinear Processes
in Geophysics
Open AccessAtmospheric
Chemistry
and Physics
Open AccessAtmospheric
Chemistry
and Physics
Open Access DiscussionsAtmospheric
Measurement
Techniques
Open AccessAtmospheric
Measurement
Techniques
Open Access DiscussionsBiogeosciences
Open Access Open Access
Biogeosciences
DiscussionsClimate
of the Past
Open Access Open Access
Climate
of the Past
Discussions
Earth System
Dynamics
Open Access Open Access
Earth System
Dynamics
DiscussionsGeoscientific
Instrumentation
Methods and
Data Systems
Open Access
Geoscientific
Instrumentation
Methods and
Data Systems
Open Access DiscussionsGeoscientific
Model Development
Open Access Open Access
Geoscientific
Model Development
DiscussionsHydrology and
Earth System
Sciences
Open AccessHydrology and
Earth System
Sciences
Open Access DiscussionsOcean Science
Open Access Open Access
Ocean Science
DiscussionsSolid Earth
Open Access Open Access
Solid Earth
DiscussionsOpen Access Open Access
The Cryosphere
Natural Hazards
and Earth System
Sciences
Open Access
Discussions
A 20-day period standing oscillation in the northern winter
stratosphere
K. Hocke1,2, S. Studer1,2, O. Martius2, D. Scheiben1, and N. K¨ampfer1,2 1Institute of Applied Physics, University of Bern, Bern, Switzerland
2Oeschger Centre for Climate Change Research, University of Bern, Bern, Switzerland
Correspondence to: K. Hocke (klemens.hocke@iap.unibe.ch)
Received: 6 February 2013 – Revised: 5 April 2013 – Accepted: 8 April 2013 – Published: 25 April 2013
Abstract. Observations of the ozone profile by a ground-based microwave radiometer in Switzerland indicate a domi-nant 20-day oscillation in stratospheric ozone, possibly re-lated to oscillations of the polar vortex edge during win-ter. For further understanding of the nature of the 20-day oscillation, the ozone data set of ERA Interim meteorolog-ical reanalysis is analyzed at the latitude belt of 47.5◦N and in the time from 1979 to 2010. Spectral analysis of ozone time series at 7 hPa indicates that the 20-day oscilla-tion is maximal at two locaoscilla-tions: 7.5◦E, 47.5◦N and 60◦E, 47.5◦N. Composites of the stream function are derived for different phases of the 20-day oscillation of stratospheric ozone at 7 hPa in the Northern Hemisphere. The stream-line at9= −2×10⁷m2s−1is in the vicinity of the polar vortex edge. The other streamline at9=4×10⁷m2s1 sur-rounds the Aleutian anticyclone and goes to the subtropics. The composites show 20-day period standing oscillations at the polar vortex edge and in the subtropics above Northern Africa, India, and China. The 20-day period standing oscil-lation above Aral Sea and India is correlated to the strength of the Aleutian anticyclone.
Keywords. Atmospheric composition and structure (Mid-dle atmosphere – composition and chemistry) – Meteorology and atmospheric dynamics (Middle atmosphere dynamics) – Radio science (Remote sensing)
1 Introduction
The motivation of the study is to learn more about the char-acteristics and the causes of a 20-day oscillation in strato-spheric ozone above Bern (7.44◦E, 46.95◦N) which was the major finding of a previous study by Studer et al. (2012).
The ozone measurements were performed by the ground-based microwave radiometer GROMOS which is part of the Network for the Detection of Atmospheric Composition Change (NDACC) (Steinbrecht et al., 2009). GROMOS was described and validated by Dumitru et al. (2006). Studer et al. (2012) analyzed mean amplitude spectra of stratospheric ozone above Bern from 1994 to 2011 and found a domi-nant spectral component with a period of 20 days at pressure levels from 30 hPa to 2 hPa in the winter season from Octo-ber to March. The 20-day oscillation was stronger than the other intraseasonal oscillations in the period ranging from 3 to 100 days.
The present study extends the analyzed time interval by us-ing ERA Interim reanalysis data of ozone from 1979 to 2010. ERA Interim is the latest global atmospheric reanalysis data set of the European Center for Medium-range Weather Fore-cast (ECMWF) and is described in detail by Dee et al. (2011). The ERA Interim reanalysis data can characterize the geo-graphical occurrence of the 20-day oscillation and its possi-ble relation to the polar vortex of the northern winter strato-sphere. We like to know if the 20-day oscillation generally occurs at mid-latitudes or if it is restricted to central Europe. If it is due to a westward travelling Rossby wave, a standing wave, or other oscillations of the stratospheric polar vortex.
Laboratory experiments, earth observation, numerical sim-ulation, and theory gave evidence for various kinds of vortex oscillations of rotating fluids: Migrating waves, stationary waves, standing waves (or standing oscillations), irregular oscillations, and transitions from laminar to turbulent fluid flow associated with the occurrence of cyclones and anticy-clones (Fultz, 1950; Sonin, 1987; Ren and Cai, 2006). The characteristics of the dominant oscillations mainly depend on the meridional temperature gradient and the rotation rate of
756 K. Hocke et al.: A 20-day period standing oscillation
the earth in the numerical simulations and the rotating water tank experiments.
Since a major result of our study is the presence of a stand-ing oscillation in the Northern winter stratosphere with a frequency of 20 day1 , we should define what we mean with the terms “standing oscillation” and “stationary wave”. The term “standing oscillation” refers to a wave with (stationary) nodes of zero amplitude and (stationary) antinodes where the amplitude oscillates between the minimal and maximal value, for example with a frequency off = 1
20 day. On the other hand, a “stationary wave” should have an apparent wave frequencyf =0 for an observer at ground. For ex-ample the polar low and the Aleutian high pressure system form a stationary wave with the zonal wave number 1 and the apparent frequencyf =0. Our definition is not univer-sally valid but practical for the present study.
The method of data analysis (or the solution approach) of-ten causes a pre-selection of the atmospheric phenomenon. For example, if a least squares fit with stationary planetary waves and zonally propagating planetary waves of different zonal wave numbers is applied, it becomes difficult to discuss irregular vortex oscillations, vortex displacements, and lon-gitudinal dependences. Since we like to avoid a pre-selection of the cause and nature of the 20-day oscillation, a somewhat new data analysis is performed. We derive composites of the polar vortex for the different phases of the 20-day oscillation of stratospheric ozone.
In this way, the mean states of the polar vortex can be com-pared for different situations, e.g., when the 20-day oscilla-tion has an ozone maximum or a minimum at Bern. In addi-tion the mean vortex shapes are derived for the two transiaddi-tion phases: 5 days before and after the ozone maxima of the 20-day oscillation. In practise, composites of the stream function are calculated from the horizontal wind field of ERA Interim. The 31 years of ERA interim reanalysis data enable a good statistical description of the vortex oscillation which is re-sponsible for the observed 20-day oscillation in stratospheric ozone above central Europe. An oscillating streamline close to the vortex edge is selected in order to visualize the 20-day oscillation of the vortex. Furthermore, we select a streamline which surrounds the Aleutian anticyclone for study of a pos-sible relationship between the oscillations of the polar vortex and the Aleutian anticyclone.
2 A 20-day oscillation in stratospheric ozone above Bern
Studer et al. (2012) analyze vertical profiles of ozone volume mixing ratio above Bern observed by the ground-based mi-crowave radiometer GROMOS (7.44◦E, 46.95◦N). The time resolution of the ozone profiles is 2 h, and the vertical resolu-tion is about 10 km. The ozone profiles are retrieved at fixed pressure levels. The vertical spacing of the pressure levels is about 2 km. The mean difference of coincident ozone profiles
from GROMOS and the satellite experiment UARS/HALOE is less than 10 % at altitudes from 25 to 45 km (Dumitru et al., 2006).
ERA Interim reanalysis provides vertical profiles of ozone volume mixing ratio with a time resolution of 6 h. While the absolute values of the ozone profiles may have uncertainties of about 10 to 20 %, the spatial and temporal variations of the estimated ozone distribution on larger scales (say hor-izontal scales>1000 km and temporal scales>5 days) are reliable since the ozone distribution of ERA Interim is driven by observations from ozonesondes and satellites and by the dynamics of the ECMWF global circulation model. On the other hand, ozone photochemistry and the feedback from the ozone distribution back to the dynamics are not considered by ERA Interim (Dee et al., 2011). Further, the upper bound-ary of the assimilation model at about 65 km (0.1 hPa) might lead to uncertainties in the upper stratospheric circulation and ozone transport. Thus it is interesting to test if ERA In-terim reanalysis also indicates a dominant 20-day oscillation in stratospheric ozone above Bern during winter, as found by Studer et al. (2012) in ozone observations of GROMOS.
The spectral analysis is a wavelet-like analysis method since the 20-day oscillation often occurs over 2–3 cycles, and the oscillation is without an obvious phase lock to the annual oscillation. A Fourier spectrum of the ozone series of the complete observation interval (1994–2013) would pro-vide a better spectral resolution than the wavelet method but the Fourier spectrum would underestimate the strength of the 20-day oscillation. For derivation of the amplitude spectra of the temporal ozone fluctuations, the ozone time series are band-pass filtered at each period from 3 to 100 days. The cut off frequencies are selected as 0.9fcand 1.1fc. For a period Tp=1/fc=20 days, the cut off periods of the bandpass filter are 18.2 and 22.2 days. Then the amplitude is derived from the filtered series as function of period and pressure level. Studer et al. (2012) describe the selected spectral analysis in more detail.
Figure 1 shows the average amplitude spectra of the ozone fluctuations derived from the ozone time series of GROMOS and ERA Interim. The amplitude spectra are averaged for the winter interval from 1 November to 28 February while Studer et al. (2012) take a longer time interval from 1 October to 31 March. As a consequence the amplitudes in Fig. 1 are a bit larger than in Studer et al. (2012). The overall time interval (November 1994 to March 2010) is the same as in Studer et al. (2012). This time interval is taken for the derivation of the mean amplitude spectra of ozone oscillations during winter over Bern.
Fig. 1. Spectra of temporal ozone fluctuations above Bern during winter season (1 November–28 February) averaged over 16 winters between November 1994 and March 2010. (a) Result for the ozone series observed by the ground-based microwave radiometer GROMOS at Bern (7.44◦E, 46.95◦N). (b) Result for the ozone series of ERA Interim reanalysis at 7.5◦E, 47.5◦N (grid point near to Bern). The spectra of ERA Interim and GROMOS indicate a dominant 20-day oscillation. The altitude dependence of the amplitude of the 20-day oscillation is different for ERA Interim and GROMOS. The quality of the ozone series of ERA Interim is optimal at 15–100 hPa while the ozone measurements of GROMOS are most reliable at 1–15 hPa. Spacing between the white isopleths is 0.02 ppm.
driven by the ozonesonde measurements which are good at pressuresp >15 hPa while the GROMOS measurements are most reliable at pressure levels from 1 to 15 hPa. Nonethe-less, at the pressure levelp=7 hPa, which is selected in the following, the ozone spectra of ERA Interim and GROMOS are quite similar in shape and absolute amplitude.
A further intercomparison of GROMOS and ERA Interim is shown later in Fig. 5, where the phases and extrema of the 20-day oscillation agree well for the filtered ozone se-ries of GROMOS and ERA Interim at 7 hPa. In the follow-ing we utilize the ERA Interim ozone data for study of the longitudinal dependence of the 20-day oscillation at north-ern mid-latitudes. In addition, ERA Interim permits to study the ozone oscillation over a longer time interval (1979–2010) while Studer et al. (2012) are limited to the interval 1994– 2010.
3 Longitudinal dependence of the 20-day oscillation
A spectral analysis of the ozone profiles along the latitude belt at 47.5◦N is performed. Figure 2 shows the result. In agreement with Studer et al. (2012), the ozone series of ERA Interim at 7 hPa at the grid point close to Bern (indicated
by the cross on the left-hand side) shows a dominant oscil-lation centered at a period of 20 days for the winters from 1979 to 2010. There is a clear longitudinal dependence of the ozone oscillations having stronger amplitudes at longitudes from about 30◦W to 90◦E corresponding to the sectors At-lantic and Eurasia. The amplitudes are stronger on the Euro-pean side than on the Pacific side because the polar vortex is usually deformed or displaced towards the European sector. Ozone oscillations above Bern are often due to the overpass of the polar vortex edge where strong gradients in potential vorticity and ozone are present Calisesi et al. (2001). Also in the winter mean state, the polar vortex is not centered at the north pole but a bit shifted towards the longitude sector from 30◦W to 90◦E. This shift of the polar vortex is associated with the Aleutian anticyclone and the (meridional) Brewer– Dobson circulation cell in the stratosphere over the Pacific.
758 K. Hocke et al.: A 20-day period standing oscillation
Fig. 2. Mean envelopes of temporal ozone fluctuations as function of longitude and period for the latitude belts at 47.5◦N during win-ter (1 November–28 February). ERA Inwin-terim data of ozone volume mixing ratio at 7 hPa from 1979 to 2010 were analysed. Two crosses at 7.5◦E and 60◦E indicate the locations where the 20-day oscilla-tion is maximal. The ozone time series at 7.5◦E, 47.5◦N and 60◦E, 47.5◦N are selected in the following.
to dynamic wave-like motions in the upper troposphere and lower stratosphere.
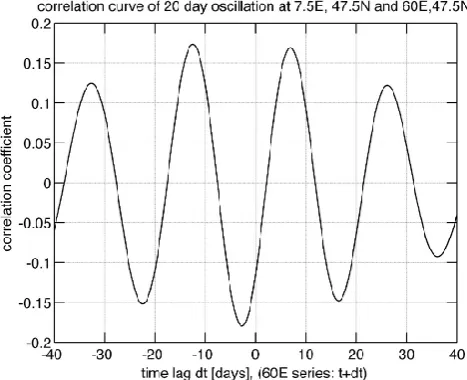
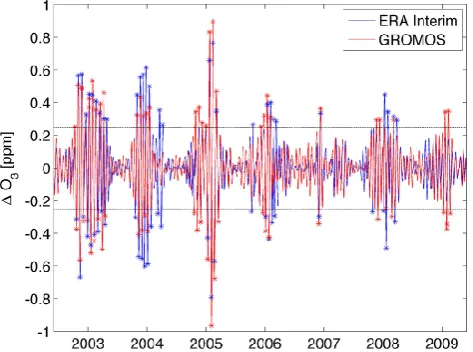
[image:4.595.51.287.61.260.2]At first the ozone series at 7 hPa are bandpass filtered at a period of 20 days (same filter as described in Sect. 2). An ex-ample with two-year data segments of the 20-day bandpass filtered ozone series is shown in Fig. 3. The 20-day ozone oscillation at 7.5◦E, 47.5◦N (blue) clearly differs from that at 60◦E, 47.5◦N (red). A constant phase lock between the ozone oscillations at the two places does not exist. In addition there are intervals when the oscillation at 7.5◦E, 47.5◦N is strong and that at 60◦E, 47.5◦N is weak, e.g., end of winter 1995/1996. The general increase of stratospheric ozone fluc-tuations during winter is well known and of no interest here. The result of the intercomparison is that the 20-day oscilla-tion seems to occur independently at the two places. In order to verify this finding, the correlation curve of the band-pass filtered ozone series at the two locations is shown in Fig. 4. The 20-day oscillation is weakly anti-correlated at the two places (r= −0.17 for a time lag of about 2 days). The weak anti-correlation in Fig. 4 and the differences in Fig. 3 sug-gest that the 20-day oscillation at the two locations might be not solely due to westward traveling Rossby waves. Stand-ing oscillations and other variations of the polar vortex may contribute to the 20-day oscillation in stratospheric ozone. We like to visualize the spatio-temporal behaviour of the 20-day oscillation in stratospheric flow by means of a composite analysis of the stream function.
Fig. 3. A two-year data segment of the 20-day bandpass filtered ozone series at 7 hPa is shown. The 20-day ozone oscillation at 7.5◦E, 47.5◦N (blue) clearly differs from that at 60◦E, 47.5◦N (red). A constant phase lock between the ozone oscillations at the two places does not exist. In addition there are intervals when the oscillation at 7.5◦E, 47.5◦N is strong and that at 60◦E, 47.5◦N is weak, e.g., end of winter 1995/1996. (The general increase of stratospheric ozone fluctuations during winter is well known and of no interest here.)
Fig. 4. The correlation curve of the filtered 20-day ozone oscilla-tions (7 hPa, 1979 to 2010) at 7.5◦E, 47.5◦N and 60◦E, 47.5◦N only shows a weak anti-correlation. Generally the 20-day oscilla-tion is not coherent at both places.
4 Composites of the stream function
[image:4.595.310.544.365.555.2]Fig. 5. Example data segment of the 20-day band-pass filtered ozone series at 7 hPa from observations of the ozone microwave radiome-ter GROMOS (red line) at Bern at 46.95◦N, 7.44◦E is compared to ERA Interim reanalysis (blue line) at 47.5◦N, 7.5◦E. The timing of the extrema and the modulation of the envelope of the 20-day oscillation are in reasonable agreement. Selected extrema for the composite analysis are indicated by the blue symbols which exceed a threshold of 0.25 ppm as indicated by the horizontal black lines.
caused by a solar storm. In this case, a list with the central dates of past solar storms is generated (as given by timing marks of observed solar X-ray bursts). Then the atmospheric observations are sorted with respect to these timing marks. For example one can select and average all temperature pro-files which were observed one day after a solar storm. This composite of temperature profiles one day after a solar storm can be compared to the composite of temperature profiles one day before a solar storm. The difference of the compos-ites indicates the typical impact of solar storms on the tem-perature profile of the earth’s atmosphere. A critical assess-ment of the composite analysis was provided by Haurwitz and Brier (1981).
4.1 Composites for the 20-day oscillation at Bern
In the following, the composite analysis is applied to de-rive the average atmospheric flow (stream function) associ-ated with different phases of the 20-day oscillation in strato-spheric ozone (e.g., minimal ozone above Bern).
We derive the timing marks from the maxima and minima of the 20-day bandpass filtered ozone series at 7 hPa above Bern. These timing marks are crucial for construction of the composites of the stream function. Figure 5 shows the band-pass filtered ozone series above Bern over several years. The figure explains how the timing marks are selected. The noise level of the oscillations in the series is about 0.1 ppm, e.g., amplitudes during summer when the 20-day oscillation is small. The threshold of the significant oscillations is taken as 0.25 ppm which is 2.5 times greater than the noise level. The
timing marks are the time points of the maxima (minima) of the series exceeding the threshold of 0.25 ppm (−0.25 ppm), respectively. The selected timing marks are indicated by the blue crosses in Fig. 5 which belong to the bandpass filtered ozone series of ERA Interim. For the sake of intercompari-son, the observational results of the ground-based microwave radiometer GROMOS are shown by the red line and the red crosses. We find a correlation ofr=0.80 between the band-pass filtered ozone series of GROMOS and ERA Interim. In the following we only consider the timing marks derived from ERA Interim for the composite analysis.
In total, four different sets of timing marks are derived: (1) timing marks of the ozone minima when the 20-day oscil-lation causes minimal ozone above Bern (0◦phase), (2) tim-ing marks of the ozone maxima when the 20-day oscillation causes maximal ozone above Bern (180◦phase), (3) timing marks of 5 days before minimal ozone above Bern (−90◦ phase), and (4) timing marks of 5 days after minimal ozone above Bern (90◦ phase). The timing marks only occur dur-ing wintertime from November to February. We get about 86 (±1) timing marks for each set over the complete time inter-val from 1979 to 2010.
For each of the four phases, the global maps of the stream function at 7 hPa at the time points of the selected timing marks are added and averaged. The stream function has been calculated from the horizontal wind fields of ERA Interim by using the algorithms of the Climatic Data Operator (CDO) which is a software tool for analysis of ECMWF meteorolog-ical data in grib format (https://code.zmaw.de/projects/cdo).
The variations of the polar vortex edge at mid-latitudes are studied by means of the streamline with a value of9= −2×10⁷m2s−1. For study of the 20-day oscillation, the se-lected streamline must not match the polar vortex edge ex-actly. It is sufficient if the streamline is about 5 to 10 de-grees in the vicinity of the vortex edge. The streamline9= −2×10⁷m2s−1is usually several degrees north of 47.5◦N in the European longitude sector at 7 hPa during winter time. However, the 20-day oscillation causes displacements and deformations of the polar vortex so that the streamline occa-sionally overpasses the location of Bern. In addition we se-lect the streamline9=4×10⁷m2s−1which surrounds the Aleutian anticyclone before going around the globe at about 30◦N latitude.
760 K. Hocke et al.: A 20-day period standing oscillation
Fig. 6. Composites of the stream function for different phases of the 20-day oscillation above Bern (47.5◦N, 7.5◦E) based on ERA In-terim reanalysis data of the winter seasons 1979-2010. The solid streamlines (9= −2×10⁷m2s−1) are near to the polar vortex edge. The dashed streamlines (9=4×10⁷m2s−1) surround the Aleutian anticyclone. Phase 0 (red line) is calculated from a com-posite of stream functions when ozone minima (state 1) are present in the 20-day bandpass filtered ozone series at 7 hPa above Bern from November to February. Phase−90◦refers to the composite of the stream function 5 days before state 1. Phase 90◦refers to the composite of the stream function 5 days after state 1. Phase 180◦ refers to state 2 (maximal ozone at Bern) which is the composite of the stream function 10 days after state 1. Random phase refers to a composite with random timing marks between November and February in the time from 1979 to 2010. Random phase can be con-sidered as the mean state of the polar vortex. The legend is valid for both solid and dashed streamlines.
0◦phase. Calisesi et al. (2001) directly derived from strato-spheric ozone measurements of GROMOS at Bern and back-ward trajectory calculations that the passage of polar vortex air leads to mid-stratospheric ozone minima. Using the in-terpretation of Calisesi et al. (2001) we can assume that the ozone minima of the 20-day oscillation at Bern are due to ozone-poor air of the polar vortex, overpassing the location of Bern during phase 0 (red streamline). The polar vortex is stretched towards central Europe during the 0◦phase of the 20-day oscillation. This finding conforms with previous stud-ies who found a close relationship between variations of po-tential vorticity, polar vortex displacements, planetary wave activity, and stratospheric ozone at northern mid-latitudes during winter (Calisesi et al., 2001; Flury et al., 2009; Harvey et al., 2002, 2008).
The new result of Fig. 6 is the information about the spatio-temporal variation of the polar vortex. Five days
af-ter the ozone minimum at Bern the streamline skips back to-wards north of Bern (light blue streamline) and ten days later (phase of maximal ozone at Bern) the dark blue streamline indicates a stretching of the vortex along a straight line from Northeast Canada to Siberia. Thus the 20-day oscillation in stratospheric ozone at Bern is due to a periodic transition be-tween two states of the vortex, and the transition happens within 10 days. In the one state (0◦phase) the vortex is de-formed towards Europe and in the other state (180◦phase) the vortex is stretched from Northeast Canada to Siberia. The yellow streamline in Fig. 6 is derived for random timing marks and represents the mean state of the polar vortex ing winter. Generally, the behaviour of the streamlines dur-ing the different phases of the 20-day oscillation in Fig. 6 is mainly due to alternating deformations and stretching of the polar vortex in different directions. It seems to be a 20-day period standing oscillation since three nodes occur at about 120◦W, 40◦W, and 55◦E longitude where crossings of the coloured streamlines take place in Fig. 6.
Regarding the dashed streamlines of9=4×10⁷m2s−1 in Fig. 6, we note that the vortex oscillations are correlated to the streamline variation above Northern Africa and anti-correlated to the streamline variation above India and China. The variations of the dashed streamlines over Africa and In-dia/China suggest a 20-day period standing oscillation with node above Egypt. Further, the polar vortex shift towards Bern (red line, phase 0) is associated with a small increase and displacement of the Aleutian anticylone. The outer, dashed streamlines are similar at longitudes from 150◦E to 300◦E so that a zonally traveling planetary wave in the sub-tropics is rather unlikely as cause of the 20-day oscillation.
4.2 Composites for the 20-day oscillation at Aral Sea
The selection of the second location in the north of Aral Sea (47.5◦E and 60◦E) is because of the second maximum of the 20-day oscillation in Fig. 2. We learned in Figs. 3 and 4 that the 20-day oscillation at Aral Sea is almost independent from that at Bern. The composites of the stream function at Bern explain this independence because a node occurs in the streamlines at (47.5◦E and 55◦E) which is rather close to Aral Sea. Thus a strong 20-day oscillation at Bern is associ-ated with a marginal variation in the node at Aral Sea.
9=4×10⁷m2s−1 which surrounds the Aleutian anticy-clone is shown by the dashed lines in Fig. 7.
Figure 7 shows the variable shape of the streamlines for the different phases of the 20-day oscillation. Again the yel-low line is obtained by random timing marks. The yelyel-low line in Fig. 7 represents the mean state of the streamline dur-ing winter and is very similar to the yellow line in Fig. 6 – as expected since the mean state of the polar vortex remains the same. The latitude difference between the red streamline (minimal ozone at Aral Sea) and the blue streamline (maxi-mal ozone at Aral Sea) is large (about 7◦) while the blue and red lines are relatively close together above central Europe. At Bern the red line is a bit north of the blue line while at Aral Sea the red line is south of the blue line. This finding is in agreement with the weak anti-correlation between the 20-day oscillation at Bern and Aral Sea (Fig. 4). One can state that the ozone minima at Aral Sea are caused by a de-formation or stretching of the vortex in direction to the Aral Sea (red line). In the other phase (blue line), the vortex skips back from Aral Sea and Northeast Canada while the vortex is stretched towards mid-latitudes at 15◦W (between Azores and Spain).
The nodes are not so clear as in Fig. 6. There might be 4 nodes – with 2 clear nodes at 20◦E and 135◦E. Compared to the composite of Bern (Fig. 6), the composite for Aral Sea suggests a similar 20-day period standing oscillations but the nodes are shifted by about 60 degrees in longitude. As a fur-ther result we find vortex oscillations which mainly occur at longitudes from Northeast Canada (90◦W) over Europe to Eurasia (120◦E). The 20-day vortex oscillation over Aral Sea and Northeast Canada are correlated, while anti-correlations or no correlations (in case of nodes) exist between the 20-day oscillation over Europe and those over Northeast Canada and Aral Sea.
Regarding the dashed streamlines of9=4×10⁷m2s−1 in Fig. 7, we note that the vortex oscillations are correlated to the streamline variation above India. The dashed and solid streamlines above India and Aral Sea show both a 20-day period standing oscillation. Further, the polar vortex shift to-wards Aral Sea (red line, phase 0) is associated with an in-tensification of the Aleutian anticylone. The outer, dashed streamlines are similar at longitudes from 150◦E to 360◦E so that a zonally traveling planetary wave in the subtropics is rather unlikely as cause of the 20-day oscillation.
5 Discussion
[image:7.595.310.547.60.288.2]The Brewer–Dobson circulation and the earth’s orography have strong influence on the behaviour, shape, and deforma-tion of the stratospheric polar vortex in the winter solstice in the northern hemisphere (Gabriel et al., 2011; Boville, 1960; Harvey et al., 2002). The yellow streamlines in Fig. 6 and 7 represent the mean shape of the polar vortex and are quite similar. Figure 1 in the article of Harvey et al. (2002)
Fig. 7. Same as Fig. 6 but for the composites of the stream function for different phases of the 20-day oscillation above Aral Sea. Now the timing marks of maximal and minimal ozone above Aral Sea (60◦E, 47.5◦N) are taken. The legend is valid for both solid and dashed streamlines at 9= −2×10⁷m2s−1 and 9= 4×10⁷m2s−1, respectively.
shows a more extreme situation when the polar vortex is stretched from North America to Siberia into an elliptical form apparently due to the occurrence of two anticyclones over the Aleutian Islands and the Azores. Harvey et al. (2002) connected the polar vortex oscillations to the occurrence of stationary, eastward and westward traveling anticyclones at mid-latitudes. The anticyclones further can be linked to planetary waves. Spectral analysis by Harvey et al. (2002) showed zonal wave numbers 1 and 2. The transient waves have periods from 5 to 22.5 days while stationary waves ex-ceed a period of 30 days (Harvey et al., 2002).
762 K. Hocke et al.: A 20-day period standing oscillation
the North Atlantic-Oscillation (NAO) index in surface air pressure (dominant period is around 30 days) and the ozone variations over Bern during winter. A related finding was re-ported by Nikulin and Repinskaya (2001) who derived em-pirical orthogonal functions (EOF) of geopotential height of the winter solstice in the northern hemisphere. They found that the anomalies of total ozone are associated with the Arc-tic Oscillation (which is itself related to the NAO). The EOF at 50 hPa (Fig. 1 of Nikulin and Repinskaya, 2001) has a sim-ilar shape as the streamlines in Fig. 6 (as expected).
Figure 6 of our study shows a small intensification of the Aleutian anticyclone when the vortex is deformed towards Bern. On the other hand Fig. 7 shows a clear intensification of the Aleutian anticyclone when the vortex is deformed to-wards the Aral Sea. Remarkable are also the red and the yel-low, dashed streamlines in Fig. 6 and 7 indicating a regular transport of subtropical air to the Aleuts during winter. More than 50 years ago Boville (1960) discussed the characteris-tic features of the winter circulation in the polar stratosphere (Fig. 2 in Boville, 1960). The shape and the displacement of the polar vortex on 1 January 1958 are a bit similar to the vortex streamline of the 0◦phase in Fig. 6 of the present study. Boville (1960) assumed that the Aleutian anticyclone acts as an anchor ridge for the strong baroclinic waves in the polar vortex. Our results for the Aral Sea supports this view and in addition it seems that pressure variations over India are associated with the intensification of the Aleutian anti-cyclone and the polar vortex oscillation. As pointed out by Boville (1960), the variability of stratospheric anticyclones should be analysed in relation with the Brewer–Dobson cir-culation and coupling processes between troposphere and stratosphere. Gabriel et al. (2011) described the generation of a stationary wave 1 in stratospheric ozone and water vapour as a consequence of the 3-D Brewer–Dobson circulation ad-vecting more ozone above the Aleutian Islands.
Our results from the composites of atmospheric flow dur-ing the various phases of the 20-day oscillation suggest the importance of a 20-day period standing oscillation at the vor-tex edge over Europe–Africa (Fig. 6) and over Aral Sea– India (Fig. 7). It is not a stationary wave (because it has an oscillation period of 20 days over Europe and Aral Sea), and it is not a (single) traveling wave since stationary nodes and antinodes occur in the composites of the streamline isopleths. Furthermore, the subtropical streamline only shows marginal variations at longitudes from 150◦E to 330◦E (Figs. 6 and 7). Variations in the strengths and positions of anticyclones at the Aleuts and at lower latitudes may disturb the polar vor-tex with a period of about 20 days. According to the com-posites the polar vortex oscillations are not isolated. There seems to be interactions between polar vortex, Aleutian an-ticyclone, and variability of subtropical streamlines (Figs. 6 and 7). It remains open what is cause and what is effect of the observed 20-day period standing oscillation. The 20 days are most likely a preferred oscillation period of the system of
vortex, anticyclone, and Brewer–Dobson circulation during Northern winter.
A 20-day period standing oscillation was also reported by Hirota (1976) for the northern winter stratosphere. Hirota found a pair of strong power density peaks in the power spec-tra of sspec-tratospheric temperature observed by the NIMBUS satellite. He attributed the pair of spectral peaks to the coin-cident occurrence of eastward and westward traveling plane-tary waves (zonal wave number 1, at 32◦and 48◦N).
6 Conclusions
Observations of a ground-based ozone radiometer at Switzer-land indicate the occurrence of a dominant 20-day oscillation of stratospheric ozone which is related to oscillations of the polar vortex edge during winter. For further understanding of the nature of the 20-day oscillation, the ozone data set of ERA Interim meteorological reanalysis is analyzed at the lat-itude belt of 47.5◦N and in the time from 1979 to 2010. Spec-tral analysis of ozone time series at 7 hPa indicate that the 20-day oscillation is maximal at two location: 7.5◦E, 47.5◦N and 60◦E, 47.5◦N.
Composites of the stream function are derived for differ-ent phases of the 20-day oscillation of stratospheric ozone at 7 hPa in the winter solstice in the northern hemisphere. The streamline at9= −2×10⁷m2s−1is in the vicinity of the polar vortex edge. The composites show the occurrence of a 20-day period standing oscillation at the polar vortex edge. The 20-day period standing oscillation of the polar vortex edge is minimal for the Pacific longitude sector (above Aleu-tian Islands) and maximal for the European longitude sector. Moreover, the 20-day period standing oscillation of the polar vortex edge is correlated to a 20-day period standing oscilla-tion in the streamline above Africa and India/China. We also find a correlation between the Aleutian anticyclone and the polar vortex oscillation. The Aleutian anticyclone intensifies when the polar vortex is deformed towards Aral Sea.
The present study confirms many results of previous stud-ies (e.g., Calisesi et al., 2001; Harvey et al., 2002, 2008; Hirota, 1976). We achieve progress in the description of the regional characteristics of the 20-day period standing oscilla-tion. Hirota (1976) explained the 20-day period standing os-cillation by a pair of traveling planetary waves from below. A further study about the 20-day period standing oscillation was not found by us.
Fig. A1. Estimation of the error of the latitude position of a selected streamline (case of the red streamline in Fig. 6 ). The black lines show the latitudinal dependences of< 9 >at the longitudes 0, 90, 180, and 270◦E for phase 0 of the 20-day oscillation (composite for minimal ozone at Bern). The error of the meanσmis depicted by the blue-dashed lines. The scales are the same for all viewgraphs. The blue error bar indicates a 2◦interval (just for orientation). The selected value of the streamline is9= −2×10⁷m2s−1, and this value is marked by the red line.
interaction in the presence of atmospheric waves from below and linked with the Brewer–Dobson circulation cell. The 20 days are most likely a preferred oscillation period of a system like that.
Appendix A
Error analysis
The error analysis estimates the variability of the geograph-ical position of the streamlines in Figs. 6 and 7. This vari-ability is mainly due to intraseasonal and interannual varia-tions of the winter circulation in the time from 1979 to 2010. The mean error of the latitude position of the streamline (9= −2×10⁷m2s−1) of phase 0 of the 20-day oscillation at Bern is discussed in the following. One advantage of the composite analysis is that the ensemble of 85 global9maps of phase 0 (time points of ozone minima at Bern) provides the mean stream function< 9 >as well as the standard devia-tionσand the error of the meanσm=√1nσ, wheren=85 is the number of the averaged9maps. A confidence interval of 68.3 % is given by< 9 >±t σmwitht≈1.04 forn=85.
Figure A1 shows the latitudinal dependence of < 9 > (black line) at the longitudes 0, 90, 180, and 270◦E. The er-ror of the meanσmis depicted by the blue-dashed lines. The scales are the same for all viewgraphs of Fig. A1. For orien-tation, the blue error bar indicates a 2◦interval. The selected value of the stream function is9= −2×10⁷m2s−1, and this value is marked by the red line. It is obvious from Fig. A1 thatσmcauses an error in the latitude position of the selected stream line and this error varies a bit in the four viewgraphs of Fig. A1. Generally the error of the latitude position of the streamline is about±2◦.
In addition we like to emphasize that the present study mainly discusses the differences between the selected streamlines of the four phases of the 20-day oscillation. Since the absolute latitude errors of the four streamlines are corre-lated in the time domain (5-day interval from one phase to the next), the absolute latitude error of phase 0 will be partly compensated by the absolute latitude error of phase 1 and so on. Thus the error of the latitude distance between the streamlines should be less than 2 degrees.
764 K. Hocke et al.: A 20-day period standing oscillation
variations of the 20-day oscillation are well above the noise level.
Acknowledgements. The study was mainly funded by the Swiss Na-tional Foundation SNF 200020-134613 (project DIAMO: Detection and Interpretation of Atmospheric Motions) and the MeteoSwiss project MIMAH of the Global Atmosphere Watch Programme. The study is further supported by the Strategic Korean-Swiss Cooper-ative Program (project Precursors and Effects of SSWs at Bern and Seoul). The ozone microwave radiometer GROMOS is oper-ated by the University of Bern and is part of the Network for the Detection of Atmospheric Composition Change (NDACC) and the Demonstration Network of ground-based remote sensing observa-tions in support of the GMES Atmospheric Service (NORS, FP7 of European Commission). ERA Interim reanalysis data were pro-vided by the European Center for Medium-range Weather Forecast (ECMWF). We also thank the International Space Science Institute (Bern, Switzerland) for hosting two science teams on sudden strato-spheric warmings (Larisa Goncharenko and Peter Hoffmann) giving ideas and motivation for the article. Furthermore, we are grateful to the Max-Planck-Institute for Meteorology (Hamburg, Germany) for providing the open acces software Climate Data Operators (CDO, https://code.zmaw.de/projects/cdo).
Topical Editor C. Jacobi thanks two anonymous referees for their help in evaluating this paper.
References
Boville, B. W.: The Aleutian Stratospheric Anticy-clone., J. Atmos. Sci., 17, 329–336, doi:10.1175/1520-0469(1960)017¡0329:TASA¿2.0.CO;2, 1960.
Calisesi, Y., Wernli, H., and K¨ampfer, N.: Midstratospheric ozone variability over Bern related to planetary wave activity during the winters 1994–1995 to 1998–1999, J. Geophys. Res., 106, 7903– 7916, doi:10.1029/2000JD900710, 2001.
Dee, D. P., Uppala, S. M., Simmons, A. J., Berrisford, P., Poli, P., Kobayashi, S., Andrae, U., Balmaseda, M. A., Balsamo, G., Bauer, P., Bechtold, P., Beljaars, A. C. M., van de Berg, L., Bid-lot, J., Bormann, N., Delsol, C., Dragani, R., Fuentes, M., Geer, A. J., Haimberger, L., Healy, S. B., Hersbach, H., H´olm, E. V., Isaksen, L., K˚allberg, P., K¨ohler, M., Matricardi, M., McNally, A. P., Monge-Sanz, B. M., Morcrette, J.-J., Park, B.-K., Peubey, C., de Rosnay, P., Tavolato, C., Th´epaut, J.-N., and Vitart, F.: The ERA-Interim reanalysis: configuration and performance of the data assimilation system, Q. J. Roy. Meteorol. Soc., 137, 553– 597, doi:10.1002/qj.828, 2011.
Dumitru, M. C., Hocke, K., K¨ampfer, N., and Calisesi, Y.: Compar-ison and validation studies related to ground-based microwave observations of ozone in the stratosphere and mesosphere, J. At-mos. Solar Terr. Phys., 68, 745–756, 2006.
Flury, T., Hocke, K., Haefele, A., K¨ampfer, N., and Lehmann, R.: Ozone depletion, water vapor increase, and PSC gen-eration at midlatitudes by the 2008 major stratospheric warming, J. Geophys. Res. (Atmospheres), 114, D18302, doi:10.1029/2009JD011940, 2009.
Fultz, D.: Experimental Studies of a Polar Vortex I, Tellus, 2, 137, 1950.
Gabriel, A., K¨ornich, H., Lossow, S., Peters, D. H. W., Urban, J., and Murtagh, D.: Zonal asymmetries in middle atmospheric ozone and water vapour derived from Odin satellite data 2001– 2010, Atmos. Chem. Phys., 11, 9865–9885, doi:10.5194/acp-11-9865-2011, 2011.
Harvey, V. L., Pierce, R. B., Fairlie, T. D., and Hitchman, M. H.: A climatology of stratospheric polar vortices and anticyclones, J. Geophys. Res. (Atmospheres), 107, 4442, doi:10.1029/2001JD001471, 2002.
Harvey, V. L., Randall, C. E., Manney, G. L., and Singleton, C. S.: Low-ozone pockets observed by EOS-MLS, J. Geophys. Res. (Atmospheres), 113, D17112, doi:10.1029/2007JD009181, 2008.
Haurwitz, M. W. and Brier, G. W.: A Critique of the Superposed Epoch Analysis Method: Its Application to Solar–Weather Rela-tions, Mon. Weather Rev., 109, 2074–2079, 1981.
Hirota, I.: Seasonal variation of planetary waves in the stratosphere observed by the Nimbus 5 SCR, Q. J. Roy. Meteorol. Soc., 102, 757–770, 1976.
Nikulin, G. N. and Repinskaya, R. P.: Modulation of total ozone anomalies in the midlatitude Northern Hemisphere by the Arc-tic Oscillation, Izvestiya Atmospheric and Oceanic Physics, 37, 633–643, 2001.
Ren, R. and Cai, M.: Polar vortex oscillation viewed in an isen-tropic potential vorticity coordinate, Adv. Atmos. Sci., 23, 884– 900, doi:10.1007/s00376-006-0884-6, 2006.
Roldugin, V. C., Nikulin, G. N., and Henriksen, K.: Wave-Like Ozone Movements, Phys. Chem. Earth B, 25, 511–514, doi:10.1016/S1464-1909(00)00055-1, 2000.
Sonin, E. B.: Vortex oscillations and hydrodynamics of ro-tating superfluids, Rev. Modern Physics, 59, 87–155, doi:10.1103/RevModPhys.59.87, 1987.
Steinbrecht, W., Claude, H., Sch¨onenborn, F., McDermid, I. S., Leblanc, T., Godin-Beekmann, S., Keckhut, P., Hauchecorne, A., Van Gijsel, J. A. E., Swart, D. P. J., Bodeker, G. E., Parrish, A., Boyd, I. S., K¨ampfer, N., Hocke, K., Stolarski, R. S., Frith, S. M., Thomason, L. W., Remsberg, E. E., Von Savigny, C., Rozanov, A., and Burrows, J. P.: Ozone and temperature trends in the upper stratosphere at five stations of the Network for the Detection of Atmospheric Composition Change, Int. J. Remote Sensing, 30, 3875–3886, doi:10.1080/01431160902821841, 2009.