https://doi.org/10.5194/angeo-35-1015-2017 © Author(s) 2017. This work is distributed under the Creative Commons Attribution 3.0 License.
Occurrence rate of dipolarization fronts in the plasma sheet:
Cluster observations
Sudong Xiao1, Tielong Zhang2,3, Guoqiang Wang2, Martin Volwerk3, Yasong Ge4, Daniel Schmid3, Rumi Nakamura3, Wolfgang Baumjohann3, and Ferdinand Plaschke3
1CAS Key Laboratory of Geospace Environment, University of Science and Technology of China, Hefei, China 2Harbin Institute of Technology, Shenzhen, China
3Space Research Institute, Austrian Academy of Sciences, Graz, Austria
4Institute of Geology and Geophysics, Chinese Academy of Sciences, Beijing, China
Correspondence to:Tielong Zhang ([email protected])
Received: 5 February 2017 – Revised: 24 July 2017 – Accepted: 26 July 2017 – Published: 29 August 2017
Abstract. We investigate the occurrence rate of dipolariza-tion fronts (DFs) in the plasma sheet by taking full advantage of all four Cluster satellites (C1–4) from years 2001 to 2009. In total, we select 466 joint-observation DF events, in which 318, 282, 254, and 236 DFs are observed by C1, C2, C3, and C4, respectively. Our findings are as follows: (1) the maxi-mum occurrence rate is ∼15.3 events per day atX∼15RE
in the XY plane, and the average occurrence rate is∼5.4 events per day over the whole observation period; (2) the oc-currence rate on the dusk side of the plasma sheet is larger and decreases with increasingBXY/BLobe; (3) the occurrence
rate within|Y|<6REincreases gradually fromX≈ −19 to −15REand then decreases fromX≈ −15 to−10RE; (4) the
occurrence rate when AE>200 nT is much larger than that when AE<200 nT, indicating that DFs preferentially occur during high geomagnetic activity. The magnetic pileup and earthward and duskward ion flows could contribute to the in-creases in the occurrence rate fromX≈ −19 to−15RE. We
suggest that both geomagnetic activity and multiple DFs con-tribute to the high occurrence rate of the DFs. In addition, the finite length of the DF in the dawn–dusk direction can affect the chance that a satellite observes the DF.
Keywords. Magnetospheric physics (plasma sheet)
1 Introduction
Dipolarization fronts (DFs) in the magnetotail plasma sheet have been widely studied in the last decade (Ge et al., 2008, 2012; Volwerk et al., 2008; Schmid et al., 2011, 2015, 2016; Runov et al., 2011; Fu et al., 2012a, 2013; Liu et al., 2013a, b; Lu et al., 2013; Huang et al., 2015; Pritchett et al., 2014; Wang et al., 2016). DFs are regarded as tangential disconti-nuities (Schmid et al., 2011; Fu et al., 2012a, b) usually sepa-rating the ambient dense plasma from the low-density plasma in the fast flow (Runov et al., 2011). However, in around 25 % of cases, the density in the fast flow is higher than in the am-bient plasma (Schmid et al., 2015). DFs are characterized by a sharp and large-amplitude increase in theZGSMcomponent
0.6
i 0.0
0.2 0.4 0.6 0.8 1.0
BXY
/B
Lobe
10-4 10-3 10-2 10-1 100
10-2 10-1
100 101
102 103
[image:2.612.315.536.65.244.2]104
Figure 1. Data distribution at different βi values along a
dis-tance relative to the neutral sheet obtained from C1 in the re-gionsX <−10REand|Y|<12RE. The steps along thexaxis are
log10(βi)=0.02 and along theyaxis areBXY/BLobe=0.01. The
value in each bin is determined by the number of data points in that bin divided by the total data number in the corresponding column along theyaxis.
et al., 2011; Ge et al., 2012). The typical length scales of fast flows are 2–3RE in the dawn–dusk direction and 1.5–2RE
in the north–south direction (Nakamura et al., 2004). Liu et al. (2013b) statistically found that the length scale of DFs in the dawn–dusk direction is about 3RE.
Occurrence rate of the DF in the plasma sheet could help to judge the importance of the DF in the magnetospheric dynamics. Based on Cluster 1 data, Fu et al. (2012a) stud-ied the occurrence rate of the earthward-propagating DFs in the regions−20< XGSM<−10RE,|YGSM|<12RE, and |ZGSM|<5RE. They found that the occurrence rate increases
gradually fromr=20 to 15REand then decreases rapidly
fromr=15 to 10RE, in whichr is the distance to the
cen-ter of the Earth in theXYGSMplane. The authors suggested
that this may be associated with the increasing pileup of the magnetic flux fromr=20 to 15RE and the strong ambient
magnetic field at r <13RE because it becomes difficult to
distinguish a DF from the strong ambient magnetic field. The maximum occurrence rate of the DFs occurs atZGSM∼0 and r∼15REwith 6.2 events per day. The criteria max(βi) >0.5
used by Fu et al. (2012a) means that the selected DFs are in the plasma sheet, whereβiis the ratio of the ion thermal
pres-sure and the magnetic prespres-sure. We note that some data in the regions−10> XGSM>−20RE,−12< YGSM<12RE, and −5< ZGSM<5RE could be in the plasma sheet boundary
layer or lobe, which can make the occurrence rate of the DF in the plasma sheet underestimated.
The primary aim of this study is to get a reliable occur-rence rate of the DF in the plasma sheet. DFs have a finite length in the dawn–dusk direction; thus, one satellite could miss the observation of a DF. In this study, we use all four Cluster satellites (C1–4) to further study the occurrence rate of the DF in the plasma sheet. We also discuss the contribu-tion of geomagnetic activity and fast flows to the occurrence rate of the DFs.
-60 -40 -20 0 20 40 60 t [s]
-10 0 10 20 30 40
[image:2.612.66.268.65.173.2]BZ
[GSM nT]
-60 -40 -20 0 20 40 60 t [s]
-10 0 10 20 30 40
BZ
[GSM nT]
-60 -40 -20 0 20 40 60 t [s]
-10 0 10 20 30 40
BZ
[GSM nT]
-60 -40 -20 0 20 40 60 t [s]
-10 0 10 20 30 40
BZ
[GSM nT]
C1 C2
C3 C4
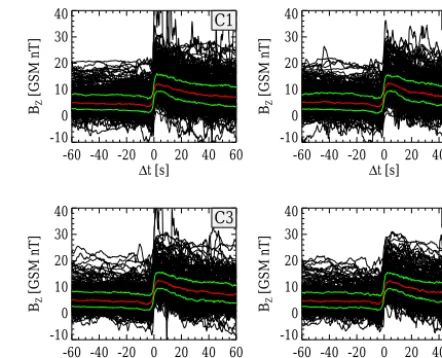
Figure 2.Superposed epoch analysis of 318, 282, 254, and 236 DFs
that are selected by C1, C2, C3, and C4, respectively. The profiles of each DF event are centered attDF. The red and upper and lower
green lines indicate the medians, upper quartiles, and lower quar-tiles of the data, respectively.
2 Selection of DFs
Cluster, which has an apogee of∼19.6REand a perigee of ∼4REwith a polar orbit, consists of four identical satellites
(Escoubet et al., 2001). These satellites constitute a tetra-hedron configuration with inter-spacecraft distances vary-ing from 100 to 18 000 km. We use the magnetic field data with 5 Hz resolution obtained by the fluxgate magnetome-ter (Balogh et al., 2001) from all four Clusmagnetome-ter satellites and the 4 s ion data obtained by the hot ion analyzer (HIA) of the Cluster Ion Spectrometer (CIS) experiment (Rème et al., 2001) from C1 during Cluster tail seasons from 2001 to 2009. The plasma sheet configuration is greatly affected by the magnetic dipole tilt angle and solar wind conditions (e.g., Schmid et al., 2011; Vörös et al., 2014; Xiao et al., 2016). Therefore, we useBXY/BLobeas a proxy of the distance of a
satellite from the neutral sheet, in whichBXY = q
BX2+BY2
in GSM (this coordinate system is used throughout the paper unless otherwise specified). The lobe magnetic field is calcu-lated from
BLobe= p
2µ0(Pi+PB) (1)
based on the assumption that the total pressure in the plasma sheet is balanced by the magnetic pressure in the tail lobe, in whichPiis the ion thermal pressure andPBis the local mag-netic pressure. C2–4 have no or not enough ion data. There-fore, we useBLobefrom C1 andBXY from C2–4 to estimate the distance of C2–4 from the neutral sheet. To make such a
BLobereliable, we require that the distance between C1 and
dis--10 -5 0 5
-5 0 5 10
0 5 10 15
00 0834 -17.93
-5.42 0.63
30
-17.93 -5.42 0.62
00 0835 -17.93
-5.42 0.62
30
-17.93 -5.42 0.62
00 0836 -17.93
-5.42 0.61 0
5 10 15
BX
C1 C2
C3
C4
BY
BZ
BT
(a) 15-08-2001
UT
XGSM YGSM ZGSM
-10 0 10
-10 0 10
0 10 20
30 2149 -14.67 -3.37 0.23
00 2150 -14.68
-3.36 0.23
30
-14.69 -3.36 0.22
00 2151 -14.69
-3.36 0.22
30
-14.70 -3.36 0.21 0
10 20
BX
C1 C2
C3
C4
BY
BZ
BT
(b) 09-09-2007
UT
[image:3.612.144.458.66.257.2]XGSM YGSM ZGSM
Figure 3.The magnetic field data of two DF events on 15 August 2001(a)and 9 September 2007(b). Black, red, green, and blue colors
indicate data from C1, C2, C3, and C4, respectively.
tribution inβi−BXY/BLobespace. One can find that the data
withBXY/BLobe<0.8 contain most of the data withβi>0.5
except for a small number of data withβi<0.5. Therefore,
we use|BXY/BLobe|<0.8 to replaceβi>0.5 as the criterion
of the plasma sheet.
We use a 3 min window to detect DF events at
−19< X <−10RE and|Y|<12REwith a step of 1.5 min
based on the following criteria: (1) in each window, the satel-lite is located in the plasma sheet, i.e., |BXY/BLobe|<0.8.
(2) The maximum inclination angle of the magnetic field
θ=arctan q Bz
B2X+BY2 !!
is larger than 45◦, and the dif-ference in elevation angle between maximum BZ (BZ_max)
and minimumBZ(BZ_min)exceeds 10◦. (3) The time of the
“potential DF” tDF is defined as the time betweenBZ_max
andBZ_min, and the correspondingBZis equal to (BZ_min+ BZ_max)/2. We require that the value of the maximumBZ minus the minimumBZbetweentDF−3 s andtDF+3 s
ex-ceeds 4 nT. Then we visually inspect all the events selected based on the criteria above to exclude events that are not typ-ical DFs based on profiles of the magnetic field data. Conse-quently, 318, 282, 254, and 236 DFs have been selected by C1, C2, C3, and C4, respectively.
Figure 2 presents the superposed epoch analysis of the DF events observed by C1, C2, C3, and C4 during the in-tervals 1 min before and after tDF. The red and upper and
lower green lines in Fig. 2 indicate the medians, upper quar-tiles, and lower quarquar-tiles, respectively. The profiles of the red lines in all four rows in each panel are in agreement with the typical DF (Ohtani et al., 2004; Schmid et al., 2011; Fu et al., 2012a). Only 15 out of 318 DFs observed by C1 have their maximum velocities less than 150 km s−1in the inter-val 1.5 min before and aftertDF, which means that the criteria
-10 -15 -20 XGSM [RE] -10
-5 0 5 10
YGSM
[R
E
]
-5 0 5
ZGSM [RE] -10
-5 0 5 10
YGSM
[R
E
]
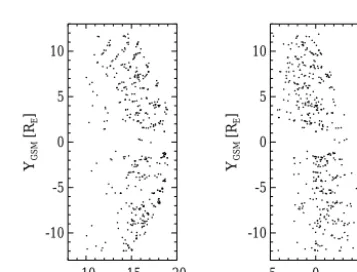
Figure 4. Spatial distribution of 466 DF events in the XY and
Y Zplanes.
without ion velocity do not significantly affect the statistical results of the occurrence rate of the DFs in this study.
Considering the typical velocity of DFs (Schmid et al., 2011) and the inter-spacecraft distances of Cluster, we re-gard any two DF events observed by different satellites as the same joint-observation DF event if their time difference is less than 30 s before 2005. The distances between the Clus-ter satellites could be larger than 10 000 km in theX direc-tion since the year 2005, i.e., a DF could take more than 30 s to propagate such a distance. Thus, we visually check any two adjacent DFs observed by different satellites with a time difference less than 2 min during this period. If theBZ pro-files of both events are similar, we regard them as the same observation DF event. Figure 3 shows two typical joint-observation DF events. For the event on 15 August 2001, the inter-spacecraft distances among the Cluster satellites are
[image:3.612.339.518.312.448.2]Orbit coverage
12 9 6 3 0 -3 -6 -9 -12 YGSM [RE]
-18 -15 -12
XGSM
[R
E
]
0.1 1.0 10.0
[image:4.612.358.498.65.164.2]Day
Figure 5. The orbit coverage of all four Cluster satellites in the XY plane. Bin size is 0.2RE. If at least two satellites are
simulta-neously in the same bin, we only count the time once for that bin.
Orbit coverage
12 9 6 3 0 -3 -6 -9 -12 YGSM [RE]
-18 -15 -12
XGSM
[R
E
]
1 10
Day
Observational rate
12 9 6 3 0 -3 -6 -9 -12 YGSM [RE]
-18 -15 -12
XGSM
[R
E
]
1 10
R
[
ev
en
ts
d
ay
-1]
Figure 6.The orbit coverage and the spatial distributions of the oc-currence rate of the DFs observed by all four Cluster satellites in theXY plane. Bin is 3×3RE. If at least two satellites are
simulta-neously in the same bin, we only count the time once for that bin; if at least two DFs, which belong to a same DF event, are observed by different satellites and located in the same bin, we only count the DF once for that bin.
distances between C1 and C3–4 are up to 10 000 km, and the time differences of the DFs observed by C1 and C3–4 are
∼50 s. In total, 466 joint-observation DF events are selected in present study. We show the spatial distribution of these events in theXY andY Z planes in Fig. 4. The distribution in theY Zplane is in agreement with the distribution of the plasma sheet.
The spatial distribution of the DFs is quite sparse nearY=
0 in Fig. 4. The results of Schmid et al. (2011) and Fu et al. (2012a) also show that there is a gap nearY =0 in the spatial distribution of the DFs. We check the orbit coverage of the Cluster satellites in theXY plane with bin size 0.2RE
as shown in Fig. 5 and find that there are few data nearY =0.
3 Statistical results
The dawn–dusk scale of DFs is ∼3RE (Liu et al., 2013b),
therefore, the spatial bin size in theXY plane is chosen to be
0.0 0.2 0.4 0.6 0.8 BXY/BLobe
0 5 10 15
[image:4.612.74.258.67.148.2]Event per day
Figure 7.Histogram of the occurrence rate of the DFs along the
neutral sheet distance.
3RE. We use all data withBXY/BLobe<0.8 and DF events
observed by C1–4 satellites to determine the occurrence rate of the DFs. If at least two satellites are simultaneously in the same bin, we count the time just once for that bin. In total, there are∼97.3 days in all bins, and the orbit coverage of the multiple satellites is shown in the upper panel of Fig. 6. If at least 2 DFs, which belong to a same joint-observation DF event, are simultaneously in the same bin, we only count one DF event for that bin. Consequently, there is a total of 525 DF events in all bins. The occurrence rate in each bin is determined by the number of the DF events divided by the time Cluster remained in the plasma sheet in that bin. The bottom of Fig. 6 shows the occurrence rate of the DFs in the
XY plane. The maximum occurrence rate is ∼15.3 events per day at−16< X <−13REand 0< Y <3RE, and the
av-erage occurrence rate in the entire theXY plane as shown in Fig. 5 is∼5.4 events per day. The occurrence rate on the dusk side of the plasma sheet is larger than that on the dawn side. Compared to the dusk side, the occurrence rate on the dawn side is very weak at−13< X <−10RE. One can also
find that the occurrence rate within|Y|<6 increases from
X= −19 to −15RE and then decreases from X= −15 to
−10RE.
The parameter of BXY/BLobe for each DF event is
de-termined by averaging the value of the magnetic field and
BLobe between tDF–3 min and tDF–2 min (see also, Liu et
al., 2013a). We use all data at −19< X <−10RE and |Y|<12RE from C1–4 to determine the occurrence rate of
the DFs along the neutral sheet distance, and the results are shown in Fig. 7. The occurrence rates are up to 10 events per day withinBXY/BLobe<0.4 and are∼1.4 events per day at
0.6< BXY/BLobe<0.8.
DFs are associated with plasma flows, especially earthward-moving flows (Schmid et al., 2011; Ge et al., 2012). We select all the ion velocities between tDF and tDF+5 min for each DF event from C1 and present the
ion velocity distributions of all the events in Fig. 8. The ion velocities in all distributions are mainly earthward and are faster at−19< X <−15REthan at−15< X <−10RE,
which is in agreement with the braking of the plasma flows in the near-Earth plasma sheet (Shiokawa et al., 1997). For
[image:4.612.81.252.210.388.2]Y [4, 12]
10 5 0 -5 -10 V [10 km s- 1]
Y 2 -10 -5 0 5 10 V [ 1 0 k m s -1] X 2 10-4 10-3 10-2 10-1 Occurrence rate
Y [-4, 4]
10 5 0 -5 -10 V [10 km s- 1]
Y 2 -10 -5 0 5 10 V [ 1 0 k m s -1] X 2 10-4 10-3 10-2 10-1 Occurrence rate
Y [-12, -4]
10 5 0 -5 -10 V [10 km s- 1]
Y 2 -10 -5 0 5 10 V [ 1 0 k m s -1] X 2 10-4 10-3 10-2 10-1 Occurrence rate
10 5 0 -5 -10 V [10 km s- 1]
Y 2 -10 -5 0 5 10 V [ 1 0 k m s -1] X 2 10-4 10-3 10-2 10-1 Occurrence rate
10 5 0 -5 -10 V [10 km s- 1]
Y 2 -10 -5 0 5 10 V [ 1 0 k m s -1] X 2 10-4 10-3 10-2 10-1 Occurrence rate
10 5 0 -5 -10 V [10 km s- 1]
Y 2 -10 -5 0 5 10 V [ 1 0 k m s -1] X 2 10-4 10-3 10-2 10-1 Occurrence rate
X [-15, -10]
X [-19, -15]
(a) (b) (c)
[image:5.612.132.462.67.212.2](d) (e) (f)
Figure 8.The ion velocity distributions of the DF events from C1 in different regions. The value in each bin is determined by the data
number of this bin divided by the total data number in that region. The ion velocities for each DF are selected in the interval betweentDFand
tDF+5 min.
AE < 200 200 < AE < 500 AE > 500 0.0 0.2 0.4 0.6 0.8 Occurrence rate
Figure 9.Histograms of the percentage of time that multiple satel-lites are in the plasma sheet (left bar) and DF events (right bar) when AE<200 nT, 200<AE<500 nT, and AE>500 nT; if at least two satellites are simultaneously in the plasma sheet, we count the time just once.
show dawn–dusk asymmetry and tend to be somewhat duskward except for panel (a). The velocity distributions at
−15< X <−10REand−12< Y <−4REshow that the ion
velocities in this region are generally small compared to other regions in Fig. 8. The ion velocities show duskward asymme-try, which is in agreement with previous findings (Juusola et al., 2011; Liu et al., 2014). The ion gradient drift could con-tribute to such asymmetry when close to the inner edge of the plasma sheet (Hori et al., 2000).
Next, we check how many joint-observation DF events oc-cur at high geomagnetic activity. As shown in Fig. 9, the per-centage of the time when the Cluster satellites located in the plasma sheet are about 68.9, 21.1, and 10 % (white bars), and the percentage of the joint-observation DF events are about 40.3, 35.4, and 24.3 % (black bars) under AE<200 nT, 200<AE<500 nT, and AE>500 nT, respectively.
Multiple DFs can occur during a short period, which could be one reason for the high occurrence rate of the DFs. We calculate the time difference of any two adjacent joint-observation DF events and show the histogram of the time differences in Fig. 10. We find that the time differences of 80, 118, and 151 adjacent joint-observation DF events are within 5, 10, and 15 min, respectively.
[image:5.612.361.493.278.369.2]0 10 20 30 40 50 60 T [min] 0 20 40 60 80 100 Number
Figure 10.Histograms of the number of the adjacent events versus
the time difference between two adjacent DFs for a certain adjacent event. Any two adjacent DFs are regarded as one adjacent event.
4 Discussion
Our results show that the occurrence rate of the DFs is larger on the dusk side of the plasma sheet than on the dawn side and the maximum occurrence rate occurs in the central plasma sheet, which is in agreement with the findings of Fu et al. (2012a) and Liu et al. (2013b). The maximum occurrence rate is 15.3 events per day in the XY plane, much higher than that of Fu et al. (2012a), who reported values of 6.2 per day. The maximum occurrence rate of the DFs in our study is nearX= −15RE, and the occurrence rate decreases rapidly
toward the Earth. Fu et al. (2012a) provided an explanation of the occurrence rate of DFs decreasing fromX= −15 to
−10RE that compared to the strong background magnetic
field in the near-Earth region. The increase ofBZat the DF is not prominent, resulting in many events excluded by the criteria max(BZ)−min(BZ) >4 nT and the difference in el-evation angle>10◦. Ion flows are found to be braked from
X= −15 to−10RE(Shiokawa et al., 1997). Therefore, we
suggest that the braking of ion flows could be another reason that the occurrence rate of the DFs decreases rapidly from
X= −15 to−10RE. Schmid et al. (2016) provided a
[image:5.612.89.249.279.359.2]12 and 20RE, respectively. They found that∼57 % of the
DFs observed by MMS propagate faster than 150 km s−1,
while for Cluster, the percentage is only∼35 %. Their find-ings contradict the idea that the velocity of DFs becomes slower when DFs propagate earthward. Schmid et al. (2016) explained that this contradiction might be because MMS and Cluster observed the DFs in different conditions, such as tail season, solar cycle, and so on.
Figure 6 shows that the occurrence rate within|Y|<6RE
gradually increases from X= −19 to −15RE, which is in
agreement with the findings of Fu et al. (2012a). Fu et al. (2012a) suggested that this may be associated with the increasing pileup of the magnetic flux from X= −20 to
−15RE. We find that the fast flows are mainly earthward
and somewhat duskward in the interval between tDF and tDF+5 min, as shown in Fig. 8. DFs are the front of fast
flows in the plasma sheet (see Schmid et al., 2011). Schmid et al. (2015) reported that DFs can be classified into two categories, and their observations suggested that the plasma flow direction of one category is along the magnetic tension force direction, while for another category the plasma flow is slightly tilted toward the dusk side. The occurrence rate of the DFs in Fig. 6 tends to be stronger on the dusk side than that on the dawn side. Therefore, we infer that the earthward and duskward fast flows could affect the asymmetry of the occurrence rate of the DFs.
Observations show that the typical scale of DFs in the dawn–dusk direction is∼3RE(Liu et al., 2013b; Huang et
al., 2015). We assume that the DF propagates only in theX
direction and the scale of the DF in the dawn–dusk direc-tion is 3RE; thus, a satellite located atY =0 could observe
the DF with the central line located betweenY= −1.5 and 1.5RE. Therefore, the finite length of the DF in the dawn–
dusk direction can affect the change that a satellite observes during a DF event at a certain position. It could be one of the reasons that the maximum occurrence rate of the DFs is up to 15.3 events per day. Another reason is that multiple DFs gen-erated by multiple burst bulk flows can occur in the plasma sheet (Hwang et al., 2011). Figure 10 shows that∼33.2 % of DF events happen after previous DFs within 15 min.
The DF is a common feature of substorm dynamics in the plasma sheet (Ge et al., 2011, 2012). Only∼31.1 % of the Cluster data are during AE>200 nT, while we find that
∼59.7 % of the DFs in our study are observed under such AE conditions. Therefore, the occurrence rate of the DFs tends to be larger when the geomagnetic activity is higher. DFs are the leading edge of the dipolaring flux bundle (DFB) (Liu et al., 2013a, 2014). The characteristics of the DFs in this study just account for partial DFBs since the DFs we select require the criteria thatBZincreases 4 nT within 6 s. Despite this, it has also been found that the occurrence rate of DFB increases when geomagnetic activities are higher (Liu et al., 2014). The average occurrence rate of the DFs is 5.4 events per day, close to the occurrence rate of substorms, which is
∼8.7 events per day (see Borovsky et al., 1993).
5 Summary
In this paper, we study the occurrence rate of the DFs in the plasma sheet by using all four Cluster satellites from the years 2001 to 2009. In total, we select 466 joint-observation DF events based on our criteria, and C1, C2, C3, and C4 observe 318, 282, 254, and 236 DFs, respec-tively. The maximum occurrence rate of the DFs in the
XYplane is∼15.3 events per day at−16< X <−13REand
0< Y <3RE, and the average occurrence rate is∼5.4 events
per day, in which the bin size is 3RE. The occurrence rate
de-creases with increasingBXY/BLobe, indicating that the
max-imum occurrence rate is in the central plasma sheet. The oc-currence rate is larger on the dusk side of the plasma sheet than that on the dawn side.
The occurrence rate of the DFs within|Y|<6REincreases
gradually from X= −19 to −15RE and then decreases
rapidly fromX= −15 to−10RE. We suggest that both the
magnetic pileup and the earthward and duskward ion flows contribute to the increase in occurrence rate fromX= −19 to
−15RE, while the decrease in occurrence rate fromX= −15
to−10REcould be associated with the braking of ion flows.
The occurrence rate of the DFs at AE>200 nT is much larger than that at AE<200 nT, indicating that DFs prefer to occur at high geomagnetic activity. Multiple DF events can occur in a short period, which is one reason for the large oc-currence rate of the DFs. In addition, the length of the DF in the dawn–dusk direction could affect the probability that a satellite observes a DF at a certain place in this direction.
Data availability. All Cluster data used in this study can be re-trieved from the Cluster Science Archive (http://www.cosmos.esa. int/web/csa), and AE index data used in this work are obtained from the Space Physics Data Facility OMNIWeb interface (http: //omniweb.gsfc.nasa.gov).
Competing interests. The authors declare that they have no conflict of interest.
Acknowledgements. This work in China is supported by the NSFC grant 41574173. This work in Austria is supported by EU FP7 grant 263325 – ECLAT, Austrian Science Fund FWF P23862-N16 and fund P24740-N27. We are grateful to the Cluster Science Archive for providing Cluster data and the Space Physics Data Facility for providing AE index data.
References
Balogh, A., Carr, C. M., Acuña, M. H., Dunlop, M. W., Beek, T. J., Brown, P., Fornacon, H., Georgescu, E., Glassmeier, K.-H., Harris, J., Musmann, G., Oddy, T., and Schwingenschuh, K.: The Cluster Magnetic Field Investigation: overview of in-flight performance and initial results, Ann. Geophys., 19, 1207–1217, https://doi.org/10.5194/angeo-19-1207-2001, 2001.
Borovsky, J. E., Nemzek, R. J., and Belian, R. D.: The oc-currence rate of magnetospheric-substorm onsets: Random and periodic substorms, J. Geophys. Res., 98, 3807–3813, https://doi.org/10.1029/92JA02556, 1993.
Escoubet, C. P., Fehringer, M., and Goldstein, M.: Introduc-tion The Cluster mission, Ann. Geophys., 19, 1197–1200, https://doi.org/10.5194/angeo-19-1197-2001, 2001.
Fu, H. S., Khotyaintsev, Y. V., André, M., and Vaivads, A.: Fermi and betatron acceleration of suprathermal electrons be-hind dipolarization fronts, Geophys. Res. Lett., 38, L16104, https://doi.org/10.1029/2011GL048528, 2011.
Fu, H. S., Khotyaintsev, Y. V., Vaivads, A., André, M., and Huang, S. Y.: Occurrence rate of earthward-propagating dipolarization fronts, Geophys. Res. Lett., 39, L10101, https://doi.org/10.1029/2012GL051784, 2012a.
Fu, H. S., Khotyaintsev, Y. V., Vaivads, A., Andre, M., and Huang, S. Y.: Electric structure of dipolarization front at sub-proton scale, Geophys. Res. Lett., 39, L06105, https://doi.org/10.1029/2012GL051274, 2012b.
Fu, H. S., Khotyaintsev, Y. V., Vaivads, A., André, M., Sergeev, V. A., Huang, S. Y., Kronberg, E. A., and Daly, P. W.: Pitch an-gle distribution of suprathermal electrons behind dipolarization fronts: A statistical overview, J. Geophys. Res., 117, A12221, https://doi.org/10.1029/2012JA018141, 2012c.
Fu, H. S., Cao, J. B., Khotyaintsev, Yu. V., Sitnov, M. I., Runov, A., Fu, S. Y., Hamrin, M., André, M., Retinò, A., Ma, Y. D., Lu, H. Y., Wei, X. H., and Huang, S. Y.: Dipolarization fronts as a conse-quence of transient reconnection: In situ evidence, Geophys. Res. Lett., 40, 6023–6027, https://doi.org/10.1002/2013GL058620, 2013.
Fu, H. S., Cao, J. B., Cully, C. M., Khotyaintsev, Y. V., Vaivads, A., Angelopoulos, V., Zong, Q.-G., Santolík, O., Macúšová, E., André, M., Liu, W. L., Lu, H. Y., Zhou, M., Huang, S. Y., and Zhima, Z.: Whistler-mode waves inside flux pileup region: Structured or unstructured?, J. Geophys. Res., 119, 9089–9100, https://doi.org/10.1002/2014JA020204, 2014.
Ge, Y. S., Russell, C. T., and Hsu, T.-S.: Implication of multiple depolarization event near 9 RE for the physics of substorms, Adv. Space Res., 41, 1243–1251, https://doi.org/10.1016/j.asr.2007.12.010, 2008.
Ge, Y. S., Raeder, J., Angelopoulos, V., Gilson, M. L., and Runov, A.: Interaction of dipolarization fronts within multi-ple bursty bulk flows in global MHD simulations of a sub-storm on 27 February 2009, J. Geophys. Res., 116, A00I23, https://doi.org/10.1029/2010JA015758, 2011.
Ge, Y. S., Zhou, X.-Z., Liang, J., Raeder, J., Raeder, M. L., Dono-van, E., Angelopoulos, V., and Runov, A.: Dipolarization fronts and associated auroral activities: 1. Conjugate observations and perspectives from global MHD simulations, J. Geophys. Res., 117, A10226, https://doi.org/10.1029/2012JA017676, 2012. Grigorenko, E. E., Kronberg, E. A., and Daly, P. W.:
Heating and acceleration of charged particles
dur-ing magnetic dipolarizations, Cosmic Res., 55, 57–66, https://doi.org/10.1134/S0010952517010063, 2017.
Hori, T., Maezawa, K., Saito, Y., and Mukai, T.: Average pro-file of ion flow and convection electric field in the near Earth plasma sheet, Geophys. Res. Lett., 27, 1623–1626, https://doi.org/10.1029/1999GL003737, 2000.
Huang, S. Y., Fu, H. S., Vaivads, A., Yuan, Z. G., Pang, Y., Zhou, M., Khotyaintsev, Yuri V., Deng, X. H., André, M., Zhang, L., Fu, S., Li, H. M., and Wang, D. D.: Dawn-dusk scale of dipolar-ization front in the earth’s magnetotail: multi-cases study, Astro-phys. Space Sci., 357, 1–7, https://doi.org/10.1007/s10509-015-2298-3, 2015.
Hwang, K.-J., Goldstein, M. L., Vinas, A. F., Schriver, D., and Ashour-Abdalla, M.: Wave-particle interactions during a dipo-larization front event, J. Geophys. Res.-Space, 119, 2484–2493, https://doi.org/10.1002/2013JA019259, 2014.
Hwang, K.-J., Goldstein, M. L., Lee, E., and Pickett, J. S.: Cluster observations of multiple dipolarization fronts, J. Geophys. Res., 116, A00I32, https://doi.org/10.1029/2010JA015742, 2011. Juusola, L., Østgaard, N., and Tanskanen, E.: Statistics of
plasma sheet convection, J. Geophys. Res., 116, A08201, https://doi.org/10.1029/2011JA016479, 2011.
Liu, J., Angelopoulos, V., Runov, A., and Zhou, X.-Z.: On the cur-rent sheets surrounding dipolarizing flux bundles in the magneto-tail: The case for wedgelets, J. Geophys. Res.-Space, 118, 2000– 2020, https://doi.org/10.1002/jgra.50092, 2013a.
Liu, J., Angelopoulos, V., Zhou, X.-Z., Runov, A., and Yao, Z. H.: On the role of pressure and flow perturbations around dipo-larizing flux bundles, J. Geophys. Res.-Space, 118, 7104–7118, https://doi.org/10.1002/2013JA019256, 2013b.
Liu, J., Angelopoulos, V., Zhou, X.-Z., and Runov, A.: Magnetic flux transport by dipolarizing flux bundles, J. Geophys. Res.-Space, 119, 909–926, https://doi.org/10.1002/2013JA019395, 2014.
Lu, H. Y., Cao, J. B., Zhou, M., Fu, H. S., Nakamura, R., Zhang, T. L., Khotyaintsev, Y. V., Ma, Y. D., and Tao, D.: Electric struc-ture of dipolarization fronts associated with interchange instabil-ity in the magnetotail, J. Geophys. Res.-Space, 118, 6019–6025, https://doi.org/10.1002/jgra.50571, 2013.
Luo, H., Kronberg, E. A., Grigorenko, E. E., Fränz, M., Daly, P. W., Chen, G. X., Du, A. M., Kistler, L. M., and Wei, Y.: Evidence of strong energetic ion acceleration in the near-Earth magnetotail, Geophys. Res. Lett., 41, 3724–3730, https://doi.org/10.1002/2014GL060252, 2014.
Nakamura, R., Baumjohann, W., Klecker, B., Bogdanova, Y., Balogh, A., Rème, H., Bosqued, J. M., Dandouras, I., Sauvaud, J. A., Glassmeier, K.-H., Kistler, L., Mouikis, C., Zhang, T. L., Eichelberger, H., and Runov, A.: Motion of the dipolarization front during a flow burst event observed by Cluster, Geophys. Res. Lett., 29, 1942, https://doi.org/10.1029/2002GL015763, 2002.
Nakamura, R., Baumjohann, W., Mouikis, C., Kistler, L. M., Runov, A., Volwerk, M., Asano, Y., Vörös, Z., Zhang, T. L., Klecker, B., Rème, H., and Balogh, A.: Spatial scale of high-speed flows in the plasma sheet observed by Cluster, Geophys. Res. Lett., 31, L09804, https://doi.org/10.1029/2004GL019558, 2004. Ohtani, S., Shay, M. A., and Mukai, T.: Temporal structure of the
observations and two-fluid simulations, J. Geophys. Res., 109, A03210, https://doi.org/10.1029/2003JA010002, 2004.
Pritchett, P. L., Coroniti, F. V., and Nishimura, Y.: The kinetic ballooning/interchange instability as a source of dipolarization fronts and auroral streamers, J. Geophys. Res.-Space, 119, 4723– 4739, https://doi.org/10.1002/2014JA019890, 2014.
Rème, H., Aoustin, C., Bosqued, J. M., Dandouras, I., Lavraud, B., Sauvaud, J. A., Barthe, A., Bouyssou, J., Camus, Th., Coeur-Joly, O., Cros, A., Cuvilo, J., Ducay, F., Garbarowitz, Y., Medale, J. L., Penou, E., Perrier, H., Romefort, D., Rouzaud, J., Vallat, C., Alcaydé, D., Jacquey, C., Mazelle, C., d’Uston, C., Möbius, E., Kistler, L. M., Crocker, K., Granoff, M., Mouikis, C., Popecki, M., Vosbury, M., Klecker, B., Hovestadt, D., Kucharek, H., Kuenneth, E., Paschmann, G., Scholer, M., Sckopke, N., Sei-denschwang, E., Carlson, C. W., Curtis, D. W., Ingraham, C., Lin, R. P., McFadden, J. P., Parks, G. K., Phan, T., Formisano, V., Amata, E., Bavassano-Cattaneo, M. B., Baldetti, P., Bruno, R., Chionchio, G., Di Lellis, A., Marcucci, M. F., Pallocchia, G., Korth, A., Daly, P. W., Graeve, B., Rosenbauer, H., Va-syliunas, V., McCarthy, M., Wilber, M., Eliasson, L., Lundin, R., Olsen, S., Shelley, E. G., Fuselier, S., Ghielmetti, A. G., Lennartsson, W., Escoubet, C. P., Balsiger, H., Friedel, R., Cao, J.-B., Kovrazhkin, R. A., Papamastorakis, I., Pellat, R., Scudder, J., and Sonnerup, B.: First multispacecraft ion measurements in and near the Earth’s magnetosphere with the identical Cluster ion spectrometry (CIS) experiment, Ann. Geophys., 19, 1303–1354, https://doi.org/10.5194/angeo-19-1303-2001, 2001.
Runov, A., Angelopoulos, V., Zhou, X.-Z., Zhang, X.-J., Li, S., Plaschke, F., and Bonnell, J.: A THEMIS multicase study of dipolarization fronts in the magnetotail plasma sheet, J. Geophys. Res., 116, A05216, https://doi.org/10.1029/2010JA016316, 2011.
Schmid, D., Volwerk, M., Nakamura, R., Baumjohann, W., and Heyn, M.: A statistical and event study of magne-totail dipolarization fronts, Ann. Geophys., 29, 1537–1547, https://doi.org/10.5194/angeo-29-1537-2011, 2011.
Schmid, D., Nakamura, R., Plaschke, F., Volwerk, M., and Baumjo-hann, W.: Two states of magnetotail dipolarization fronts: A statistical study, J. Geophys. Res.-Space, 120, 1096–1108, https://doi.org/10.1002/2014JA020380, 2015.
Schmid, D., Nakamura, R., Volwerk, M., Plaschke, F., Narita, Y., Baumjohann, W., Magnes, W., Fischer, D., Eichelberger, H. U., Torbert, R. B., Russell, C. T., Strangeway, R. J., Leinwe-ber, H. K., Le, G., Bromund, K. R., Anderson, B. J., Slavin, J. A., and Kepko, E. L.: A comparative study of dipolarization fronts at MMS and Cluster, Geophys. Res. Lett., 43, 6012–6019, https://doi.org/10.1002/2016GL069520, 2016.
Shiokawa, K., Baumjohann, W., and Haerendel, G.: Braking of high-speed flows in the near-Earth tail, Geophys. Res. Lett., 24, 1179–1182, https://doi.org/10.1029/97GL01062, 1997. Sitnov, M. I., Swisdak, M., and Divin, A. V.:
Dipolar-ization fronts as a signature of transient reconnection in the magnetotail, J. Geophys. Res., 114, A04202, https://doi.org/10.1029/2008JA013980, 2009.
Takada, T., Nakamura, R., Baumjohann, W., Asano, Y., Volwerk, M., Zhang, T. L., Klecker, B., Rème, H., Lucek, E. A., and Carr, C.: Do BBFs contribute to inner magnetosphere dipolarizations: Concurrent Cluster and Double Star observations, Geophys. Res. Lett., 33, L21109, https://doi.org/10.1029/2006GL027440, 2006. Volwerk, M., Lui, A. T. Y., Lester, M., Walsh, A. P., Alexeev, I., Cao, X., Dunlop, M. W., Fazakerley, A. N., Grocott, A., Kistler, L., Lun, X., Mouikis, C., Pu, Z., Shen, C., Shi, J. K., Taylor, M. G. G. T., Baumjohann, W., Nakamura, R., Runov, A., Vörös, Z., Zhang, T. L., Takada, T., Rème, H., Klecker, B., and Carr, C. M.: Magnetotail dipolarization and associated current systems observed by Cluster and Double Star, J. Geophys. Res., 113, A08S90, https://doi.org/10.1029/2007JA012729, 2008. Vörös, Z., Facskó, G., Khodachenko, M., Honkonen, I.,
Jan-hunen, P., and Palmroth, M.: Windsock memory COnditioned RAM (CO-RAM) pressure effect: Forced reconnection in the Earth’s magnetotail, J. Geophys. Res.-Space, 119, 6273–6293, https://doi.org/10.1002/2014JA019857, 2014.
Wang, G. Q., Zhang, T. L., Volwerk, M., Schmid, D., Baumjo-hann, W., Nakamura, R., and Pan, Z. H.: Mirror mode struc-tures ahead of dipolarization front near the neutral sheet observed by Cluster, Geophys. Res. Lett., 43, 8853–8858, https://doi.org/10.1002/2016GL070382, 2016.
Xiao, S., Zhang, T., Ge, Y., Wang, G., Baumjohann, W., and Nakamura, R.: A statistical study on the shape and position of the magnetotail neutral sheet, Ann. Geophys., 34, 303–311, https://doi.org/10.5194/angeo-34-303-2016, 2016.