SRef-ID: 1432-0576/ag/2005-23-3699 © European Geosciences Union 2005
Annales
Geophysicae
Wave particle interactions in the high-altitude polar cusp: a Cluster
case study
B. Grison1, F. Sahraoui1, B. Lavraud2, T. Chust1, N. Cornilleau-Wehrlin1, H. R`eme3, A. Balogh4, and M. Andr´e5 1Centre d’´etude des Environnements Terrestre et Plan´etaires, 10/12 avenue de l’Europe, 78140, V´elizy, France
2Space Science and Applications Los Alamos National Laboratory, MS D466, Los Alamos, NM 87545, USA 3Centre d’Etude Spatiale des Rayonnements, 9 avenue du Colonel, 31028 Toulouse Cedex 4, France
4Space and Atmospheric Group, The Blackett laboratory, Imperial College, Prince Consort road, London, UK 4Swedish Institute of Space Physics, Uppsala, Sweden
Received: 21 December 2004 – Revised: 27 October 2005 – Accepted: 28 October 2005 – Published: 23 December 2005
Abstract. On 23 March 2002, the four Cluster space-craft crossed in close configuration (∼100 km separation) the high-altitude (10RE) cusp region. During a large part of
the crossing, the STAFF and EFW instruments have detected strong electromagnetic wave activity at low frequencies, es-pecially when intense field-aligned proton fluxes were de-tected by the CIS/HIA instrument. In all likelihood, such fluxes correspond to newly-reconnected field lines. A fo-cus on one of these ion injection periods highlights the in-teraction between waves and protons. The wave activity has been investigated using the k-filtering technique. Experimen-tal dispersion relations have been built in the plasma frame for the two most energetic wave modes. Results show that ki-netic Alfv´en waves dominate the electromagki-netic wave spec-trum up to 1 Hz (in the spacecraft frame). Above 0.8 Hz, intense Bernstein waves are also observed. The close simul-taneity observed between the wave and particle events is dis-cussed as an evidence for local wave generation. A mecha-nism based on current instabilities is consistent with the ob-servations of the kinetic Alfv´en waves. A weak ion heating along the recently-opened field lines is also suggested from the examination of the ion distribution functions. During an injection event, a large plasma convection motion, indicative of a reconnection site location, is shown to be consistent with the velocity perturbation induced by the large-scale Alfv´en wave simultaneously detected.
Keywords. Magnetospheric physics (Magnetopause, Cusp and boundary layers; Plasma waves and instabilities) – Space plasma physics (Wave-particle interactions)
1 Introduction
The cusps, supposedly located on open magnetic field lines, are key regions for transfer of mass and momentum from
Correspondence to: B. Grison
the magnetosheath to the Earth’s magnetosphere. Solar wind particles can directly access to the ionosphere through it. The magnetic reconnection process in an open mag-netosphere model creates newly-opened field lines that are populated with magnetosheath ions and convected across this region under southward (Dungey, 1961) or northward (Dungey, 1963) IMF (Interplanetary Magnetic Field). The high-altitude cusp is adjacent to the magnetosheath and thus closer to reconnection sites than lower altitude cusp re-gions. After a few crossings by the HEOS spacecraft, provid-ing a first description of the high-altitude cusp (Paschmann et al., 1976), Gurnett and Frank (1978), using Hawkeye 1 data, highlighted that magnetic fluctuations in the ultra-low-frequency range are an indicator of this region. The POLAR spacecraft, with its highly elliptical orbit, first surveyed this region up to 9RE(Earth radii) in detail. From this spacecraft
the Alfv´enic perturbations that originate from the reconnec-tion site (Haerendel et al., 1978) could propagate along the newly-opened flux tube into this region.
The Cluster mission permits one to explore extensively this high-altitude cusp region with the unique opportunity given by the four spacecraft to decouple spatial and tempo-ral effects. Nykyri et al. (2003) found clear peaks around the local proton gyrofrequency without any correlation be-tween spacecraft signals while separated by 600 km. They concluded that waves are generated locally due to sheared plasma flows. With a study on the direction of the Poynting flux below and above the proton gyrofrequency, Sundkvist et al. (2005) also concluded that there is local wave genera-tion along the field lines.
At low altitudes, in the cusp as in the nearby auroral re-gion, wave and particle interactions have been frequently studied (e.g. Bouhram et al., 2003). Ion beams (Cattell et al., 2002), temperature anisotropy (Andr´e et al., 1986) and ve-locity shears (Lakhina, 1990) are plasma instabilities com-monly observed. Bernstein modes and Alfv´en modes ob-viously interact with particles in this region (Kintner et al., 1986; Chaston et al., 2004). Broad-band extremely lowfrequency (BBELF) waves – observed with Alfv´en waves -are associated with the most common types of oxygen heat-ing (Andr´e et al., 1998). Electromagnetic waves in the top ionosphere are often told to originate from higher altitudes (e.g. Le Queau and Roux, 1992). This idea is partly con-firmed by the simultaneous observations of alfv´enic elec-tromagnetic activity in the high-altitude cusp region and of ionospheric convection (Farrugia et al., 2004).
Here we study the cusp crossing that occurred on 23 March 2002 when the Cluster fleet was in close configuration in the cusp region (100 km of intercraft separation). After introduc-ing instrumentation and interplanetary magnetic conditions, we present a general overview of this crossing (Sect. 2). In Sect. 3, we discuss the correlation between strong ion injec-tion events and ULF magnetic activity. A focus on one of these events highlights these correlations and suggests that wave-particle interaction takes place in the cusp. Then we present in Sect. 4 the wave mode identification by means of the k-filtering analysis. Finally, we discuss our results, in order to explain the presence and origin of these modes.
2 Observations
2.1 Instrumentation
The plasma wave and particle data presented below have been measured by several instruments on board Cluster. Three magnetic components of the waves are measured by the Spatio Temporal Analysis of Field Fluctuations (STAFF) experiment (Cornilleau-Wehrlin et al., 2003). Two electric components are measured in the spin plane by the Elec-tric Field Wave (EFW) experiment (Gustafsson et al., 2001). These two instruments provide for this study waveform data at a sampling rate of 25 Hz. Let us call the STAFF waveform
data the STAFF-SC data. The three-axis search coil mag-netometer that constitutes part of the STAFF experiment is not able to measure fluctuations at frequencies lower than about 0.1 Hz. Also, a Doppler shift of ±0.25 Hz, due to the 4-s spin of the spacecraft, distorts the magnetic compo-nents measured in the plane perpendicular to the spin axis. STAFF-SC measurements of low frequency magnetic field fluctuations (frequencies lower than about 0.35 Hz) are thus not accurate. The low frequency counterpart of the magnetic fluctuations are provided by the Flux Gate Magnetometer ex-periment (FGM) (Balogh et al., 2001). The CIS instruments (R`eme et al., 2001) measure full 3-D ion distribution func-tions and moments (density, bulk flow velocity, temperature) at a time resolution up to the spin period. In this paper, we use the Hot Ion Analyser (HIA) data, which does not resolve ion species but has high energy and angular resolution. The IMF is provided by the ACE spacecraft that orbits at the L1 libration point.
2.2 Orbit
On 23 March 2002 the Cluster spacecraft crossed the high-altitude cusp from the northern lobe to the magnetosheath. This cusp crossing has also been studied by Lavraud et al. (2004). The outbound trajectory, approximately in the midnight-noon magnetic meridian, was mainly sunward. Figure 1 shows the Cluster spacecraft 1 orbit from 09:00 to 12:30 UT (black marks), with magnetospheric field lines de-rived from the T89 model (Tsyganenko, 1989). The space-craft tetrahedron projection in the noon-midnight plane is shown at 09:00 and 12:30 UT. The intercraft separations dur-ing the crossdur-ing were about 100 km and, for the sake of visi-bility, are enlarged by a factor of 100 in Fig. 1.
2.3 Interplanetary conditions
Figure 2 displays the IMF measured by ACE. The IMF clock angle, the three GSM components, and the IMF modulus are, respectively, plotted from bottom to top. The data have been shifted by 57 min forward to account for the solar wind con-vection time from ACE to the Cluster location. This shift is estimated with the mean bulk antisunward velocity in the considered time interval and before 11:50 UT (shifted time on Fig. 2). At this time, there is a strong and abrupt increase in the IMF (up to 12 nT), associated with a sudden enhance-ment of the solar wind density and bulk velocity, which could be a signature of an interplanetary shock. This shock is seen later in the FGM data, around noon (not shown), when Clus-ter has already reached the magnetosheath. This is why the time delay has been computed in averaging velocities before that shock. The same shift is used during the crossing.
Fig. 1. Cluster spacecraft orbit between 09:00 and 12:30 UT on
23 March 2002, projected on theXgsm, Zgsmplane. The field lines
have been computed from the T89 model. The yellow lines are the inner magnetosphere lines at 11:40 UT, whereas the black ones are the field lines that are going through the SC1 (black marks) po-sition every 30 min. The constellation, following the Black-Red-Green-Blue (BRGB) colour code (respectively, for spacecraft 1, 2, 3 and 4), has been plotted at 09:00 (BRGB crosses) and at 12:30 UT (BRGB squares). The inter-spacecraft separation centred around SC1 has been enlarged one hundred times. The green line indicates the part of the Cluster orbit that has been identified in the cusp.
is really dawnward (negative), between 10:30 and 11:15 UT, and after 11:32 UT. Otherwise|By|remains low (less than
2 nT). TheBx component fluctuates between −2 and 2 nT
until 11:02 UT. Then it becomes directed sunward (positive). It is worth noticing that the reconnection process at anti-parallel merging sites is likely to occur in the lobes when the IMF is northward, i.e. during the major part of cross-ing. As long as the clock angle is close to 0 deg, mainly until 10:37 UT, the anti-parallel merging sites are expected to be located poleward of the spacecraft.
2.4 Overview of the Cluster data
Figure 3 displays an overview of the wave and ion data ob-tained by SC1 during the 10:00–11:54 UT interval. From top to bottom, one sees, the ion plasma density (HIA) (red curve, panel a) and the magnetic field intensity (FGM) (black curve, panel a), the Alfv´en velocity (red curve, panel b) and the
δE/δBratio (black curve, panel b) derived from the power of the fluctuations measured by STAFF-SC and EFW over the range 0.35–2 Hz , the energy spectra of the ions (HIA) (panel c), the parallel (black) and perpendicular (red) com-ponents, with respect to the magnetic field (as all following references to parallel or perpendicular component), of the bulk flow velocity (HIA) (panel d), the power of the mag-netic field fluctuations averaged over its three components
Fig. 2. Lagged IMF measured by ACE spacecraft. From top to
bot-tom, in GSM (Geocentric Solar Magnetospheric) coordinate sys-tem, the solar magnetic field magnitude, thex,yandzmagnetic components and the clock angle (arctan(By/Bz)) are displayed
be-tween 09:30 and 12:00 UT. The calculated delay bebe-tween ACE and Cluster is 57 min.
and integrated over the 1–10 Hz frequency range (STAFF-SC) (panel e), the dynamic power spectra of the magnetic field fluctuations derived from the STAFF-SC data (FFT have been performed on intervals of 512 points, giving an about 20-s time resolution of the dynamic spectra) (panel f), the pitch angle spectra of the ions (HIA) (panel g) and the dy-namic power spectra of the electric field (EFW) (panel h). Because of the lack of EFW data on board SC1, we use those on board SC4. The comparison between these two data sets is relevant at a time resolution of about 20 s. Indeed, the com-parison of the FGM data between the four spacecraft, on the time scale of 20 s, shows almost identical fluctuations, as the spacecraft are separated by only 100 km.
[image:3.595.308.545.67.304.2]-6 -4 -2 0 4 5 6 7 -6 -4 -2 0 4 5 6 7
EFW
/H
IA
/H
IA
/H
IA
-3
log((mV/m)²/Hz)
log(
)
keV/(sec.cm².sr
.keV)
(e)
(f)
(h)
(g)
log((nT²)/Hz)
log(
)
keV/(sec.cm².sr
.keV)
(a)
(b)
(c)
(d)
vA
(km/s)
vö
dE/dB
[image:4.595.65.533.79.616.2](km/s)
Fig. 3. Overview of the cusp crossing on 23 March 2002. The data are provided from various instruments on board spacecraft 1, except EFW,
whose data are taken from SC4. Panel (a) displays the DC magnetic field given by FGM (black curve) and the density derived from HIA (red curve). Panel (b) displays theδE/δBratio (black curve) and the Alfv´en velocity derived from HIA and FGM data (red curve). Panel
(c) displays the ion energy spectrogram (HIA), (d) the parallel component of the bulk flow velocity (HIA) (black curve) and the norm of
regions, a region being characterized by a strongly asymmet-ric distribution of the pitch angles with ions moving mainly earthward (low pitch angles) and another region being char-acterized by a fairly isotropic pitch angle distribution of the ions. The parallel velocity (panel d) turns to negative from 10:55 UT until 11:20 UT. Pitch angle distribution during this period confirms the dominance of ion outflow. Fluctuations of the perpendicular and parallel components of the flow ve-locity (panel d) are of the same intensity. After 11:20 and un-til 11:38 UT, both velocity components are less than 50 km/s, corresponding to a stagnation region (Lavraud et al., 2004). Concerning the wave activity, one observes that magnetic fluctuations (panels e and f) start at about 10:10 UT with bursts of various intensity and duration. The mean wave ac-tivity level increases after 11:38 UT. The maximum of elec-tric fluctuations (panel h) is reached at about 10:12 UT. Then their intensity decreases. One can notice localized enhance-ments around 10:54 and 11:40 UT and a very low activity be-tween 11:10 and 11:38 UT. From panel (b) one could notice that theδE/δB ratio and the Alfv´en velocity have a similar trend. A very largeδE/δB ratio observed at 10:33, 10:46, 10:52 UT and 10:54 UT suggests an electrostatic wave ac-tivity. However, except at 10:54 UT, these cases are asso-ciated neither with strong electric field fluctuations nor with magnetic fluctuations, electrostatic wave activity being thus very weak: the wave activity observed in the cusp is essen-tially electromagnetic. So, as already noticed by Andr´e et al. (2001) during another crossing, the δE/δB ratio varies in relationship with background parameters, in this instance the magnetic field and the density. It can be seen, in partic-ular, from the electric fluctuations (panel h), the trend of the
δE/δBratio of the wave activity is correlated with the large-scale decrease of the background magnetic field intensity.
On each panel, a clear boundary, the magnetopause, is en-countered at about 11:38 UT (see Lavraud et al. (2004) for a description of this boundary). The mean energy of the particles is roughly the same but their density (intensity of the flux) clearly increases at this boundary. Between 11:38 and 11:40 UT the bulk velocity changes abruptly because the ions flow approximately perpendicular to the magnetic field at about 300 km/s. The magnetopause encounter is very dy-namic and appears to be correlated with the arrival of the interplanetary shock, as previously discussed. In summary, in the cusp part of this event (10:10-11:38 UT), which is the main purpose of this paper, the ion flow velocity highlights three successive regions crossed by the spacecraft. From about 10:10 UT to 10:55 UT, the bulk flow velocity is dom-inated by injections of magnetosheath ions and their relax-ation to an equilibrium distribution. Then, until 11:20 UT, the plasma is characterized by an enhancement of the convec-tion and the predominance of mirroring ions (when negative parallel velocity peaks are detected). Finally, and until the magnetopause crossing, the plasma almost stagnates with a flow velocity smaller than 50 km/s (see Lavraud et al. (2002) for a detailed study of such region). We will now deal with the relationship between the ions and ULF waves.
3 Correlation between wave and particle events
3.1 Correlation over the whole cusp crossing
Let us first examine the ULF power, on panel (e) of Fig. 3. To do so, we fix 7.10−3nT2 as the minimal threshold (see dotted yellow line on panel e) for considering wave activ-ity as significant: it corresponds roughly to a mean level of the wave power. The first time the power exceeds this value happens around 10:12 UT for a short duration. Later, it oc-curs during time intervals longer than 2 min: between 10:16 and 10:19 UT, between 10:22 and 10:29 UT and between 10:34 and 10:38 UT. Then peaks are shorter (2 min) and are centred around 10:50, 10:55, 10:59, 11:02, 11:06, 11:11 and 11:18 UT. We recall that all the magnetic fluctuations iden-tified above are of an electromagnetic nature (finiteδE/δB
ratio).
On panel (d), the ion perpendicular flow velocity varies be-tween 0 and 150 km/s, in a relatively smooth way, while the parallel flow velocity fluctuates much more abruptly. In the same way as we did for inspecting the wave power, we define a 100 km/s threshold for identifying the intervals when flow velocities, either parallel or perpendicular to the magnetic field, are large. At the entrance into the cusp (from 10:10 to 10:16 UT), where the plasma density is low, very high velocities (up to 400 km/s) are observed. Later, the periods of large velocities correspond to much shorter time intervals at 10:18, 10:22, 10:23, 10:25, 10:26, 10:28, 10:34, 10:36, 10:49, 10:50 and 10:53 UT. All these intervals correspond to positive parallel velocities, meaning earthward flows. Large, negative (upgoing), parallel components of the flow velocity are detected later on at 11:01, 11:04 and 11:09 UT. In con-junction with a large value of the parallel flow velocity, the perpendicular flow velocity also reaches large values (at least 100 km/s) at 10:08, 10:09, 10:13, 10:35 and 10:50 UT. Then, but with low values of the parallel flow velocity, this high level of the perpendicular flow velocity is again observed at 10:59, 11:03, 11:18 UT and for longer time intervals (about 2 min) around 11:06 and 11:11 UT.
5.5 6.0 6.5 7.0 -6 -4 -2 0
(i) (ii) (iii) (iv)
Log(keV/(sec.sr
.cm².keV)
log((nT)²/Hz)
(b)
(c) (a)
(d)
[image:6.595.52.287.60.375.2](e)
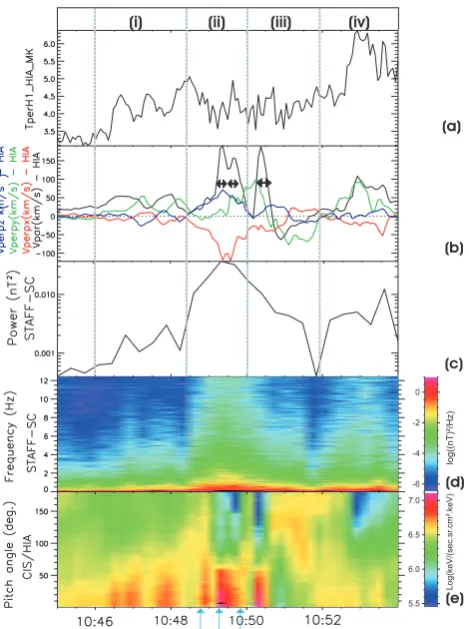
Fig. 4. This is an enlargement of an ion injection event. From top to
bottom, are displayed the ion perpendicular temperature measured by HIA (a), the bulk flow velocity given by HIA projected along the magnetic field direction given by FGM (in black) and the GSM components of the perpendicular bulk flow velocity (b), the mag-netic wave power integrated between 1 and 10 Hz from STAFF-SC
(c), the corresponding time-frequency spectrogram (d) and the ion
pitch angle spectrogram given by HIA (e). Four successive periods – (i) to (iv) – are delimited by dotted vertical lines. Vertical blue arrows at the bottom of the figure indicate the centre time of the distribution function shown in Fig. 5. Horizontal black arrows on panel (b) delimit the time intervals used in Sect. 4.
Later (after 11:01 UT), the absence of ion beams is probably due to the fact that the farther the spacecraft move sunward across the cusp, the farther they are from the region linked to the reconnection site in the northern lobe.
The conjunction of an injection of magnetosheath ions and an electromagnetic wave activity has often been noticed (e.g. D’Angelo et al., 1974; Le et al., 2001). From 10:53 to 11:22 UT, the large peaks of the perpendicular flow veloc-ity are associated with small magnitudes of the parallel flow velocity. In contrast with the injection events, the plasma there does not consist of a predominant earth-going plasma but also includes counterstreaming mirrored ions. Periods where upgoing and downgoing ions are of the same inten-sity (near zero parallel flow velocity) correspond to the peri-ods where the convection is maximum (large perpendicular flow velocity) and where a strong electromagnetic activity is
observed. On the other hand, when mirroring ions predomi-nate (negative parallel flow velocity), both the wave activity and the plasma convection are systematically weaker. As a result, it can be thought that some wave activity also results when a large convection is present; electromagnetic wave ac-tivity is thus not only observed during ion beams events.
At 11:20 UT, the IMF By is no longer negative and the
clock angle moves close to 0 deg. This IMF component is known to influence the cusp location significantly (Russell, 2000). It is thus possible that this IMF turning resulted in the entry of the spacecraft in the stagnant part of the high-altitude cusp. This region shows very low flow and mag-netic field; as suggested by Lavraud et al. (2004), this may be typical for northward IMF conditions. The plasma dis-plays neither unidirectional nor counterstreaming ion beams, but rather appears fairly isotropic. In this region, both elec-tric and magnetic fluctuations are very low (see Fig. 3). 3.2 Focus on an ion injection event
Figure 4 presents focuses on the last succession of strong ion injections associated with waves, between 10:45 and 10:54 UT. From top to bottom, the ion perpendicular temper-ature, the ion velocity components, the integrated power of the ULF magnetic wave, the time-frequency power spectro-gram of these waves, and the ion pitch angle spectrospectro-gram are displayed. The event has been divided into four successive intervals. The frontiers have been fixed where the parallel flow velocity is close to 0. The (ii) period covers the first and second strong injections. The (iii) period includes the third strong injection and the consecutive mirrored ions. The per-pendicular temperature (panel a) is low (less than 3.5 MK) before interval (i), fluctuates during intervals (i), (ii) and (iii) and is high (more than 4.5 MK) later. The parallel flow ve-locity (panel (b), black curve) displays two major positive peaks: at 10:49:20 and 10:50:20 UT, the parallel velocity reaches almost 200 km/s. Between these two peaks, it passes through a secondary maximum followed by a brief moment of vanishing velocity. After the second major peak, the paral-lel velocity is negative until 10:51:30 UT. Then it turns back to positive. During the (i) interval, all the components of the perpendicular bulk flow velocity display low values (less than 50 km/s). During the first strong injection (interval (ii)),
vx is strongly negative and passes through an extremum of
about −100 km/s at 10:49:30 UT. In the (iii) interval, the perpendicular velocity fluctuations occur mainly along the
y-direction. Thevycomponent is dawnward when outgoing
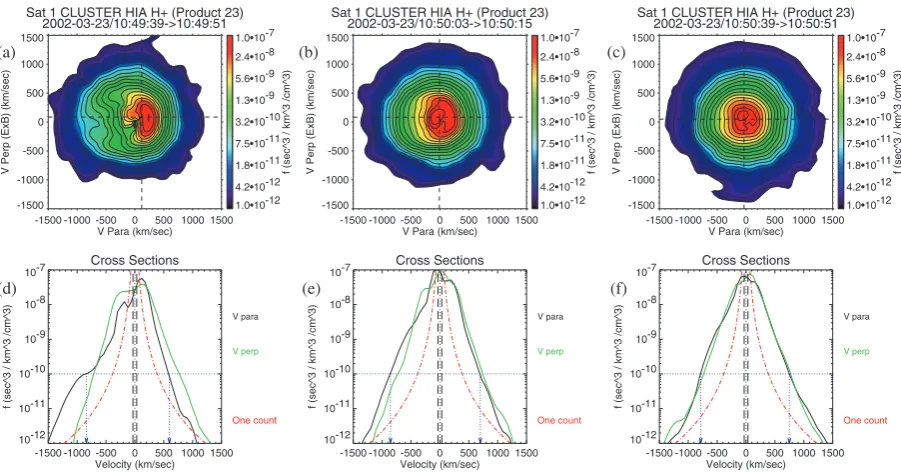
Fig. 5. Ion distribution functions of the ions from HIA on board spacecraft 1 for three selected times during the interval of interest.
Two-dimensional cuts of the ion distribution, in the parallel-perpendicular plane (the perpendicular direction is that of the convection), are shown in plots (a), (b) and (c). Their respective 1-D cuts along the parallel and perpendicular direction (black and green, respectively) are given in plots (d), (e) and (f). The one count level is superimposed to these latter as red dash-dotted lines. The dotted blue lines in plots (d), (e) and (f) only serve as guides to highlight the distributions’ width. Distributions (a), (b) and (c) are presented in the spacecraft frame (dotted black lines indicate the flow velocities used to define the plasma frame). Distributions (d), (e) and (f) are presented in the plasma frame.
seems that they are not located on freshly reconnected field lines because of numerous upgoing ions. Later, more diffuse (but for a longer time), anti-parallel ions are detected.
Figure 5 shows 2-D and 1-D cuts of the ion distribution functions for three selected times (shown by blue arrows in Fig. 4). The maximum of the wave activity is reached when the parallel component of the flow velocity is the largest (and positive). It corresponds to an anisotropic distribution func-tion (cuts (a) and (d) of Fig. 5). After the last injecfunc-tion the ions have been reflected at low altitudes and return to the spacecraft, resulting in a bulk flow with a substantial anti-parallel component (part (iii) in Fig. 4). There, the wave activity turns back to a lower level. The velocity changes are sharper when the precipitating ions (parallel population) are dominant while smoother when mirrored ions are largely present. It is hard to disentangle whether this stems from ballistic effects (the presence of both up- and downgoing ions on the same field line may render the velocity changes smoother) or from wave-particle diffusion processes. In the following interval (part (iv)), a little injection is observed and the wave activity has a mean level. These observations strongly suggest a causal link between the wave generation and the injection of particles. This is also supported by the observations of local enhancements of the wave activity dur-ing the two ion beams of interval (i). It is worth noticdur-ing that the first strong injection period (between 10:49:20 and 10:49:45 UT) is associated with a strong antisunward con-vection motion. We remember here that theBz orientation
of the IMF was unclear at this time (turned from northward to southward at 10:51 UT). Although the site location can-not be deduced from either the IMF orientation or from a time-latitude dispersion analysis, due to very short duration of the event, the convection motion argues for a reconnection site located in the equatorward region of the magnetopause. Note also that such a location is consistent with either south-ward or northsouth-ward IMF (Fuselier et al., 2000). The second strong injection period (at 10:50:20 UT) has a large duskward component that is coherent with an anti-parallel merging site located more dawnward from the cusp (theBycomponent of
the IMF is directed dawnward). This focus on a short inter-val allowed us to highlight the apparent simultaneity of wave activity and injections of magnetosheath ions. It further con-firms the relationship between the ion flux intensity (when directed earthward) and the power of the ULF electromag-netic wave activity.
DT
1DT
2DT
310:49 10:50 10:51
Bz(n
T)
By(n
T)
Bx(
nT)
10:48 10:49 10:50 10:51
10:48 10:49 10:50 10:51
[image:8.595.48.285.59.357.2]10:48
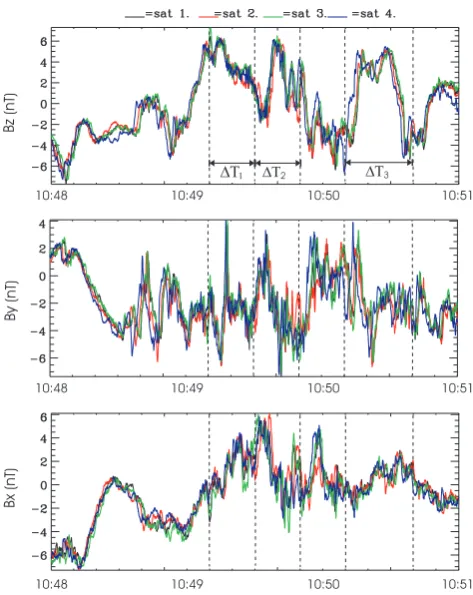
Fig. 6. The magnetic field components measured by the FGM
ex-periment in the MFA frame over 3 min, starting from 10:48:00 UT. The mean values (over time and spacecraft) are removed from the signal and used to define the MFA frame. The colours are relative to the four satellites. The vertical dashed lines delimit the intervals when the maxima of the parallel flow velocities are observed.
wave-particle interaction may also contribute to the evolution of the distribution, one may first compare the parallel and anti-parallel components of the distributions (d), (e) and (f). The 1-D cuts of the distributions displayed in plot (e) reveal that the width of the distribution in the anti-parallel direc-tion is larger than that in the parallel direcdirec-tion. Sundkvist et al. (2005) highlighted that waves are generated in the cusp along whole field lines, meaning above and below the Clus-ter spacecraft. Then considering that the mirrored ions spend more time than the downgoing ones in crossing the region where electromagnetic waves can interact with the ions, heat-ing will be more important for the mirrored particles. It is worth noticing that the next distribution (f) shows only little evidence for the same feature. On the other hand, ion heating may equally occur above the spacecraft location. This sug-gestion comes from the appearance of a high-energy tail in the parallel spectrum of the ions in distribution (f), as com-pared to that of distribution (d). Our observations may there-fore represent some heating which occurs during a major part of the trajectory of the ions after their injection into the mag-netosphere.
We must stress, however, that the observations of the dis-tribution function characteristics in the parallel direction are
experimentally difficult because of the mixing of the up- and downgoing populations. The presence of these two popula-tions induces uncertainty in the determination of the plasma frame and makes any assessment from the parallel spectra – in the present case a difference in temperature – not fully conclusive. Assuming gyrotropy, one may expect the anal-ysis of the perpendicular temperature to be less sensitive to this problem. A lack of perpendicular temperature enhance-ment would suggest the absence of heating, while the detec-tion of a finite temperature enhancement would constitute an upper limit to any given heating mechanism. From the time series of the perpendicular temperature shown in Fig. 4, the lowest perpendicular temperature during the large flows is about 3.5 MK ,while it is of about 4.5 MK later when the dis-tribution is isotropic, for example, at 10:52 UT. There is an upper limit of a 30% increase in temperature for this partic-ular case, as more and more mirrored particles are detected. This, added with the observations in the parallel tempera-ture, suggests that some heating may occur by wave-particle interaction in the cusps. Nevertheless, it should be com-pared with the typical factor of 2–3 observed between the magnetosheath temperature and that of the exterior cusp (at their boundary) under northward IMF (Lavraud et al., 2004, 2002). The other processes at other locations (e.g. reconnec-tion site or magnetopause discontinuity) are probably also needed to explain the temperatures observed in the cusp, in comparison with temperatures in the magnetosheath.
4 Mode identification using the k-filtering technique
In this section we propose to study the nature of the wave activity discussed in the previous section. Figure 6 presents the three components of the magnetic field measured by the FGM experiment during the strong injections observed be-tween 10:48 and 10:51 UT. They are shown in the MFA (Magnetic Field Aligned) frame, with the z-axis aligned with the ambient magnetic field. The mean values, calcu-lated over the period studied and over the four spacecraft, have been removed from the waveforms and are used to de-fine the MFA frame. We have subdivided the time interval into three sub-intervals, centred around the injection events where a maximum of the parallel velocity of the ions is ob-served: 1T1≡10:49:10 to 10:49:30 UT; 1T2≡10:49:30 to 10:49:50 UT and1T3≡10:50:10 to 10:50:40 UT (see blue arrows at the bottom of panel (b) in Fig. 4). The three injec-tion events seem to be well correlated with large-scale fluctu-ations of the parallel component of the magnetic field. How-ever, only the two first injections are accompanied by strong large-scale fluctuations (about the duration of the interval) of the perpendicular magnetic field component, in this case
Bx. Perpendicular fluctuations of smaller scales (duration of
few seconds) are seen in each of these injections at 10:49:16, 10:49:35 and 10:50:08 UT on theBycomponent.
parallel component of the magnetic field is larger than the perpendicular one. This tendency is reversed for frequencies ranging from 0.13 to 1.0 Hz. The dominance of the perpen-dicular component in the frequency range [0.13,1.0] Hz, as expected from the inspection of the waveforms, can be terpreted as a signature of shear waves. To confirm this in-terpretation, we have used the k-filtering technique to iden-tify the nature of the waves for each frequency in the inter-val [0.13,1.0] Hz. Before presenting the results obtained, let us recall the principle of the k-filtering method (Pinc¸on and Lefeuvre, 1991; Pinc¸on and Motschmann, 1998).
The k-filtering technique is based on the simultaneous measurements of a given wave field in several points of space. It allows one to estimate the energy distribution func-tion of the corresponding wave field in the 4-D Fourier space
(ω,k), denoted hereafter by the functionP (ω,k). The k-filtering method adopts a plane wave decomposition and re-quires the time stationarity and space homogeneity of the time series. In real data, these two hypotheses are not strictly fulfilled. However, in practice, we are content with the con-cept of weak space homogeneity (and time stationarity): the signal should be homogeneous (stationary) on scales that are larger than the largest spatial (temporal) scale determined by the k-filtering method. Once the wave energy distribution
P (ω,k)is calculated, it can be used to identify the relevant modes (Sahraoui et al., 2003). For each given frequencyω0, and using an isocontour representation, the energy distribu-tion in the k-space is displayed as cuts in the(kx, ky)plane
along thekz axis. The validity domain of the technique in
the wave vector space is determined from the separations be-tween the Cluster spacecraft: all the existing wavelengths have to be larger than the intercraft separations, which are of the order of 100 km in the present case. For each value of
kzcorresponding to an identified peak ofP (ω0,k), the the-oretical dispersion relations of the low-frequency (LF) linear plasma modes (MHD and mirror modes) are superimposed on the energy spectrum (after being Doppler shifted into the spacecraft frame using the flow velocity measured by the HIA experiment (R`eme et al., 2001)). The mirror mode is as-sumed to have approximately a zero frequency in the plasma frame, which means that it is observed in the satellite frame with the dispersionω=k.v. When it is necessary, other the-oretical dispersion relations (kinetic modes), computed from the WHAMP program (R¨onnmark, 1982), are introduced be-sides the MHD modes. For both MHD and kinetic modes the control parameters are given by the different Cluster ex-periments: B0 from FGM, the ion temperature and density from HIA. For more details on the use of the k-filtering tech-nique, the reader is referred to Sahraoui et al. (2003) and the references therein.
In the following we present the results obtained in the frequency range [0.13,1.0] Hz. The frequencies below 0.35 Hz are studied from the FGM data, whereas the higher frequencies are studied from the STAFF-SC data. In Sahraoui et al. (2004), it has been shown, from the very good similarity between STAFF-SC and FGM results, that there is no effect of the high-pass filter applied to STAFF-SC data
[image:9.595.310.547.62.177.2]nT²/Hz
Fig. 7. The FFT power spectra of the FGM data during the
pe-riod1T1 calculated for the spacecraft 1 in the frequency range [0.09,3] Hz. The red and blue lines show the spectra of the parallel and perpendicular components, respectively. The black line shows the total spectrum.
Fig. 8. Energy distribution in the k-space of the most intense
iden-tified peak for the frequency f=0.26 Hz. It is presented in the kz=0.0011 rd/km plane which contains the maximum of magnetic
energy for this frequency. The black thin lines are the isocontours of energy in the(kx, ky)plane, whereas the coloured lines are the
theoretical dispersion relations of the LF modes Doppler shifted in the satellite frame. The blue line is the Doppler shiftω=k.v and
corresponds to the mirror dispersion relation in the satellite frame. The curves of the slow mode are very close to the curve of the mir-ror mode, since the slow mode propagates in the present case quasi-perpendicularly to the magnetic field.
on the spatio-temporal properties of the observed waves. For the frequencyf=0.26 Hz, the(kx, ky)-plane, containing the
maximum of the magnetic energy distribution function, is shown in Fig. 8. It is found forkz=0.0011 rd/km which is the
[image:9.595.312.546.265.462.2]Fig. 9. Two peaks with comparable intensities are identified for
the frequency f=0.79 Hz. The first one (left-hand side of the top panel) corresponds to the latest identifiable Alfv´en mode with (k,B0)=88◦andfplasma≈0.5fci. The second one (right-hand side
of the bottom panel) is identified by WHAMP as a Bernstein mode with:(k,B0)=98◦andfplasma≈2.5fci.
Now, one may ask whether the identification of the Alfv´en mode for this frequency is consistent for higher frequencies. For this purpose, we have analyzed all the frequencies of the interval [0.1,1.0] Hz. Figure 9 presents the(kx, ky)planes
containing the two main energy peaks for the frequency
f=0.79 Hz. At this frequency, the first and second extrema of energy lie, respectively, in planes for whichkz=0.0011 rd/km
(top) and kz=−0.0054 rd/km (bottom). The maximum
en-ergy is on the left edge of the top panel (i.e.kx≈−0.05 rd/km)
and it is close from the theoretical Alfv´en mode. In this panel, significant energy is also present around the point of coordinateskx≈0.037 rd/km andky≈−0.008 rd/km. It is
worth noticing that these coordinates correspond to the loca-tion of the second maximum (bottom panel): the wave en-ergy distribution spreads over a wide range of k. For the same reason, one can notice a peak energy on the left side
of the bottom panel at the location of the maximum peak of the top panel. The two main energy peaks are found for a parallel wave number which is small as compared to the per-pendicular one. The study confirms the observation of the Alfv´en mode up to the frequencyf=0.8 Hz, where it reaches the shortest wavelength accessible to the measurement given the 100-km intercraft separation (see Fig. 9, in the left-hand side of the top panel, the maximum is on the edge of the box). As the frequencies increase, the wave vectors of the identified Alfv´en mode have constant parallel components (all corre-sponding peaks are in the samekzplane) but increasing
per-pendicular ones, leading to various propagation angles (with respect to the local ambient magnetic field), ranging from 83◦to 88◦. The modulus of the wave vectors is varying from
kρ=0.8 forf=0.18 Hz tokρ=3.7 forf=0.8 Hz (as seen in Fig. 10, described below), whereρ∼75 km is the proton Lar-mor radius. We notice therefore that the appellation “Alfv´en mode” used in the present work should be taken with some caution: the identified spatial scales are typically in the range of the kinetic regime of the Alfv´en mode and the name “Ki-netic Alfv´en Wave” would be a more accurate name of the Alfv´enic fluctuations observed in the present case. Never-theless, for the sake of simplicity, we remain in the classical “Alfv´en mode” appellation most of the time. In line with this, we notice that for such spatial scales (kρ∼3) the properties of the Alfv´en mode are much different from those correspond-ing to the MHD limit (kρ1). The Alfv´en mode, even in the kinetic range, is expected to have a group velocity mainly di-rected along the field line. For instance, the compressibility of the mode, defined as the ratioδB///δB⊥ and calculated from WHAMP, varies from zero in the MHD limit to 0.4 for
kρ∼3. The identification of the Alfv´en mode as the dominant one in the frequency range [0.1,0.8] Hz over a wide range of spatial scales allows one therefore to explain the dominance of the perpendicular magnetic component with respect to the parallel one mentioned above, but also some of the observed parallel fluctuations. Other compressional modes with lower intensity (not shown here) are identified in the same range of frequency. Their detailed study is postponed to future works. For the frequency f=0.8 Hz, in addition to the Alfv´en mode peak, we have identified another peak with a compa-rable energy. It is localized in thekz=−0.0054 rd/km plane
(Fig. 9, right-hand side of the bottom panel). Its extension to otherkz planes appears on the top panel of Fig. 9. This
wave has approximately the same spatial scales as the ob-served kinetic Alfv´en wave: both wave vectors are almost equal but have opposite sign, which means that they have been symmetrically Doppler shifted, according to the for-mula ωplasma=ωsatellite±k.v. However, from Fig. 9 (right-hand side of the bottom panel), we see that this second peak is located far from any dispersion curve of the MHD modes. The corresponding frequency in the plasma frame is approx-imatelyf=1.3 Hz∼2.5fci, wherefci is the proton
gyrofre-quency.
Bernstein modes are known to have dispersion relations in kinetic range close to ω=(n+0.5).ωci (n>1). Using
mode. The Bernstein modes are very unstable for the quasi-perpendicular direction, and are generally electrostatic (Janhunen et al., 2003). However, in this case of large wave vectors (kρ∼3.5) and largeβ(≈1), WHAMP provides an important magnetic component for the Bernstein mode:
δE/δB∼4VA, where VA≈350 km/s is the Alfv´en velocity.
This explains why the Bernstein mode could be present in magnetic data. This Bernstein mode is identifiable for all the frequencies belonging to [0.8,1.0] Hz, and disappears for higher ones. Its wave frequency in the plasma frame de-creases with the wave vector. The observed wave vectors form angles varying from 99◦to 95◦with respect to B0.
In order to summarize all the previous results, we present in Fig. 10 the dispersion relations observed for the two prin-cipal identified wave peaks. The frequencies measured in the spacecraft frame are Doppler-shifted back into the plasma frame and then plotted as a function of its perpendicular wave vector (i.e.ωplasmaversusk⊥), the dependence with the paral-lel wave vector being negligible. These experimental disper-sion relations are compared to the theoretical ones obtained from WHAMP. The question of de-Dopplerizing has to be treated with caution, since strong variations of the plasma velocities are observed during the period studied,1T1(see Fig. 4). The crucial point is to disentangle the velocity pertur-bations caused by the waves from the background flow veloc-ity. For this purpose three different values of the plasma ve-locity have been used to Doppler-shift the wave frequencies measured in the satellite frame back into the plasma frame. These values are calculated in the MFA frame as follows:
– v1=(−100, −40, 140) km/s, as averaged over 1T1 (20 s),
– v2=(−50, −16, 58) km/s, as averaged over 180 s between 10:48:00 and 10:51:00,
– v3=(v1+v2)/2=(−75,−28,−100) km/s.
The velocities v1, v2and v3are used, respectively, to plot the green, blue and red experimental dispersion curves displayed in Fig. 10. Owing to the fact that the perpendicular gradi-ents are much sharper than the parallel ones (k//k⊥), the Doppler-shift is less sensitive to the parallel flow velocity. It has to be stressed that even with an important uncertainty in the determination of the background flow velocity, the mode identification of the observed wave peaks is still accurate. As a matter of fact, Fig. 10 shows that the global behaviour of the experimental dispersion curves follows the ones of the Alfv´en and Bernstein modes, even if they are not very close (green and blue dots). The fast mode lies far from all the ex-perimental peaks. The slow mode (not plotted in Fig. 10) has almost a zero frequency and moreover, is strongly damped abovekρ=1.
We also notice that the two velocities v1 and v2 can be considered as over- and underestimations of the background flow velocity, respectively. In fact, since the wave activity presents a large-scale fluctuation over the period1T1, the mean value of the flow velocity over this period, calculated
fast
Bernstein 1 Bernstein 2
Alfvén
kperpr
w/w
ci
Fig. 10. Comparison of the experimental dispersion relations (coloured dots) observed in the frequency range [0.1,1] Hz to the theoretical ones determined from WHAMP (black curves). The blue, green and red dots are the de-Dopplerized experimental dis-persions obtained with the flow velocities v1, v2and v3, respec-tively. The dispersion of the waves observed in the frequency range [0.1,0.8] Hz fits the Alfv´en wave dispersion curve shape, and quite well for v3 (red dots). The dispersion of the waves observed in the frequency range [0.8,1] Hz is very close to the dispersion curve of second harmonic of the Bernstein mode for the same v3 flow velocity (red dots).
only over the high bulk velocities of the injection, turns out to be an overestimate of the flow velocity carrying waves. The inverse situation can occur when the mean velocity is calculated over a time interval which is too large. These con-siderations suggest that the most realistic flow velocity could have a value ranging between the two previous limits. This hypothesis is indeed strongly supported by Fig. 10: the best fit of the experimental dispersion curves with the theoretical ones is obtained when the flow velocity v3is used for the de-Dopplerization (red dots). Note that Figs. 8 and 9 have been obtained with the v3flow velocity.
[image:11.595.313.546.60.302.2]5 Discussion
The Cluster case study reported here shows that in the high-altitude polar cusp, the numerous injection events of magne-tosheath ions from a reconnection site located poleward of the cusp are always observed with an intense wave activity. Using the k-filtering analysis, part of these intense waves ob-served simultaneously are identified as kinetic Alfv´en waves. The local wave generation of kinetic Alfv´en waves is still not well understood but we can argue here that a plausible mech-anism may be based on a current instability (Forslund et al., 1979). As seen in Fig. 6, large-scale fluctuations (>15s) of theBxcomponent give evidence for the signature of parallel
currents during the two first intervals,1T1and1T2, while no signature of a large-scale parallel current is observed dur-ing the last interval,1T3. The waves identified during the two first injections (1T1and1T2) are mostly of an Alfv´enic nature and show similar characteristics. On the other hand, the third injection, which corresponds to a lower intensity in the parallel current, shows no evidence for Alfv´en waves. Parallel currents may thus be the energy source of the kinetic Alfv´en waves which have been observed. Nevertheless, we notice that background parameters may influence the onset of electromagnetic wave activity: specific beams could either generate or not generate kinetic Alfv´en waves under various conditions. Numerical simulations are needed to clarify this issue.
In the MHD theory homework, the Alfv´en mode is ex-pected to induce a perturbation of the bulk plasma velocity of aboutδv=vAδB/B0. Both perturbationsδv andδB are
perpendicular to the(B0,k)plane. If one considers the
per-turbation seen onBxduring the two injections observed
be-tween 10:49:20 and 10:49:40 (see Fig. 10) as the temporal signature of an Alfv´enic current, a perturbation on the plasma motion of about 100 km/s along thex-axis is expected. It is precisely the amplitude of the perpendicular bulk flow veloc-ity measured along thex-axis during that period (see Fig. 4). So, its interpretation from a large-scale Alfv´en wave pertur-bation is consistent. Conversely, the observation of such an enhanced perpendicular plasma motion during an injection event could be the signature of a large-scale Alfv´en wave.
The theory of reconnection predicts the production of Alfv´en waves along newly-opened field lines (e.g. Haeren-del et al., 1978). The Alfv´en waves observed by Cluster may thus originate from the reconnection sites associated with the injection events. However, the close simultaneity of the wave and particle events can hardly be explained other than by a local generation of the waves. In the framework of reconnection (Smith and Lockwood, 1996), the magne-tosheath ions penetrating into the magnetosphere are accel-erated up to the local Alfv´en velocity and move then in a first approximation with a constant velocity. The Alfv´en waves generated simultaneously may therefore follow the injected ions as long as the variation of the Alfv´en velocity along the field line is negligible. Indeed, if one considers an Alfv´en velocity of about 200 km/s at the reconnection site, which corresponds to the parallel flow velocity observed for the
injected ions, an Alfv´en velocity of about 350 km/s at the location of the Cluster spacecraft, and a distance of about 10RE between the reconnection site and the spacecraft, a
time lag of about 80 s between the detection of the magne-tosheath ions and the Alfv´enic perturbations may be expected in the event presented in this study (the two successive events around 10:50 UT). In fact, with the time resolution of the particle instrument (up to 4 s) being much higher than 80 s, the observations do not give any evidence for such a time lag. So, in all likelihood, the observed Alfv´en wave is lo-cally generated. Otherwise, one should describe a mecha-nism explaining a common propagation of the injected ions and the Alfv´en wave from the reconnection site. The dis-tance of 10REhas been estimated following the method
pre-sented in Onsager and Fuselier (1994). From Fig. 1, we no-tice that this distance is consistent with a subsolar position of the reconnection site; Vontrat-Reberac et al. (2003) obtained a similar estimation in the case of lobe reconnection. The an-tisunward convection motion is still the only indicator of the site location.
Concerning the waves identified as Bernstein mode the sit-uation can be understood in a relatively simple way. As ki-netic modes, the Bernstein modes are known to be very sen-sitive to the shape of the distribution function, which may ex-plain why the mode identification cannot be perfectly clear. Ion distribution due to newly-reconnected field lines gen-erates predominantly perpendicular waves (Bingham et al., 1999). More recently, Janhunen et al. (2003) defined that part of the waves destabilized from ion shell are Bernstein modes. In all likelihood, part of the waves generated from the anisotropic distribution function of the ion beam (roughly half-ring) are probably Bernstein waves. Thus, the observa-tion of Bernstein modes during injecobserva-tion events is not very surprising, even if the predominance of the second harmonic over the first one is not obvious. Bernstein waves are known to hardly propagate, except perpendicularly to the magnetic field (Ichimaru, 1973). The Bernstein waves are thus very likely observed close to their source. The wave energy ob-served during the injection events, as dominated by the ki-netic Alfv´en and Bernstein modes, is thus of local origin.
suggests that some ion heating occurs along the whole field line above and below the spacecraft. Diffusion by the electro-magnetic waves simultaneously detected is a good candidate to explain the local part of this heating, especially the perpen-dicular one. Following a classical scheme it can contribute to increase the parallel temperature (Andr´e et al., 1990).
6 Summary and conclusions
The main result of this study is the identification of mixed modes in the ULF turbulent-like electromagnetic spectrum observed in the high-altitude cusp region. These results are provided by the unique possibility offered by the Cluster mis-sion, which allows the simultaneous measurements in several points of space. The presence of kinetic Alfv´en waves, Bern-stein waves and other less energetic waves suggests that vari-ous processes of wave generation occur. The injected proton events that have been observed are clearly associated with a strong ULF electromagnetic activity. This is a strong argu-ment for the local generation of the waves. Many processes for the generation of kinetic Alfv´en waves exist, the current instability being a plausible mechanism consistent with the observation of large-scale magnetic field fluctuations. Gen-eration of Bernstein waves can be explained by the specific distributions of the injected ions. The associated waves (ki-netic Alfv´en and Bernstein waves) are good candidates to explain part of the observed ion heating. Therefore, we sug-gest that the electromagnetic waves contribute to the evolu-tion of the ion distribuevolu-tion funcevolu-tion associated with the in-jections, even if this evolution can be explained by ballistic effect. Very isotropic distribution functions, observed in the stagnant plasma region and between strong injections, corre-spond systematically, as well as unidirectional flows of mir-rored ions, to very low wave activity. On the other hand, intense electromagnetic waves are present during periods of high plasma convection. The present case study suggests that the large-scale Alfv´enic fluctuation seen in the magnetic waveform at 10:49 UT during the injection event is a signa-ture of the strong anti-sunward convection which could be explained by the motion of the newly-reconnected flux tubes from the reconnection site equatorward of the cusp.
Finally, we stress that the scenario of generation of the Alfv´en (or the Bernstein) waves, presented above, shall be taken as a first interpretation rather than as a final expla-nation of the observations. The study of a large variety of other cusp crossings and some theoretical developments are required to confirm these first ideas and to go further. Nev-ertheless, it can already be concluded that the high-altitude polar cusp, supplied with ions by the magnetosheath, acts as a source of waves, especially when the proton flows are field-aligned. In turn, these waves, in particular, kinetic Alfv´en waves and Bernstein waves, can diffuse and heat the ions along the entire trajectory of the injected ions: the process of wave generation, as observed here, is likely to occur at much lower altitudes. This hypothesis is supported here by the ob-servation of traces of ion heating and elsewhere by previous
studies (D’Angelo et al., 1974; Le et al., 2001) that showed a correlation between the waves and the injected particles at lower altitudes, also suggesting a local wave generation.
Acknowledgements. We acknowledge the ACE MAG team for the
use of IMF data. STAFF data processing is partly supported by CNES grant. F. Sahraoui is funded by a CNES fellowship. The authors thank T. D. Phan for useful discussions.
Topical Editor T. Pulkkinen thanks two referees for their help in evaluating this paper.
References
Andr´e, M., Norqvist, P., Andersson, L., Eliasson, L., Eriksson, A. I., Blomberg, L., Erlandson, R. E., and Waldemark, J.: Ion ener-gization mechanisms at 1700 km in the auroral region, J. Geo-phys. Res., 103, 4199–4222, 1998.
Andr´e, M., Temerin, M., and Gorney, D.: Resonant generation of ion waves on auroral field lines by positive slopes in ion velocity space, J. Geophys. Res., 91, 3145–3151, 1986.
Andr´e, M., Crew, G. B., Peterson, W. K., Persoon, A. M., and Pol-lock, C. J.: Ion heating by broadband low-frequency waves in the cusp/cleft, J. Geophys. Res., 95, 20 809–20 823, 1990.
Andr´e, M. , Behlke, R., Wahlund, J.-E., Vaivads, A., Eriksson, A.-I., Tjulin, A., Carozzi, T. D., Cully, C., Gustafsson, G., Sundkvist, D., Khotyaintsev, Y., Cornilleau-Wehrlin, N., Rezeau, L., Maksi-movic, M., Lucek, E., Balogh, A., Dunlop, M., Lindqvist, P.-A., Mozer, F., Pedersen, A., and Fazakerley, A.: Multi-spacecraft ob-servations of broadband waves near the lower hybrid frequency at the Earthward edge of the magnetopause, Ann. Geophys., 19, 1471–1481, 2001,
SRef-ID: 1432-0576/ag/2001-19-1471.
Balogh, A., Carr, C. M., Ac˜una, M. H., Dunlop, M. W., Beek, T. J., Brown, P., Fornac¸on, K.-H., Georgescu, E., Glassmeier, K. H., Harris, J., Musmann, G., Oddy, T., and Schwingenschuh, K.: The Cluster Magnetic Field Investigation: overview of in-flight performance and initial results, Ann. Geophys., 19, 1207–1217, 2001,
SRef-ID: 1432-0576/ag/2001-19-1207.
Bingham, R., Kellett, B. J., Cairns, R. A., Dendy, R. O., and Shukla, P. K.: Wave generation by ion horseshoe distributions on auroral field lines, Geophys. Res. Lett., 26, 2713–2716, 1999.
Bouhram, M., Malingre, M., Jasperse, J. R., Dubouloz, N., and Sauvaud, J.-A.: Modeling transverse heating and outflow of ionospheric ions from the dayside cusp/cleft, 2 Applications, Ann. Geophys., 21, 1773–1791, 2003,
SRef-ID: 1432-0576/ag/2003-21-1773.
Cattell, C., Johnson, L., Bergmann, R., Klumpar, D., Carlson, C., McFadden, J., Strangeway, R., Ergun, R., Sigsbee, K., and Pfaff, R.: FAST observations of discrete electrostatic waves in associa-tion with down-going ion beams in the auroral zone, J. Geophys. Res., 12–1, 2002.
Chaston, C. C., Bonnell, J. W., Carlson, C. W., McFadden, J. P., Ergun, R. E., Strangeway, R. J., and Lund, E. J.: Auroral ion acceleration in dispersive Alfv´en waves, J. Geophys. Res., 109, A04205, 2004.
Pinc¸on, J. L., D´ecr´eau, P. M. E., Harvey, C. C., Louarn, P., San-tolik, O., Alleyne, H. S. C., Roth, M., Chust, T., Le Contel, O., and Staff Team: First results obtained by the Cluster STAFF ex-periment, Ann. Geophys., 21, 437–456, 2003,
SRef-ID: 1432-0576/ag/2003-21-437.
Cowley, S. W. H.: The causes of convection in the earth’s mag-netosphere−A review of developments during the IMS, Rev. Geophys. Space Phys., 20, 531–565, 1982.
D’Angelo, N., Bahnsen, A., and Rosenbauer, H.: Wave and Particle Measurements at the Polar Cusp, J. Geophys. Res., 79, 3129– 3134, 1974.
Dungey, J. W.: Interplanetary Magnetic Field and the Auroral Zones, Phys. Rev. Lett., 6, 47–48, 1961.
Dungey, J. W.: The structure of the exosphere or adventures in velocity space, in Geophysics: The Earth’s Environment, 526-536, (Eds.) Dewitt, C., Hieblot, J., and Lebeau, A., Gordon and Breach, Newark, N. J., 1963.
Farrugia, C., Lund, E., Sandholt, P., Wild, J., Cowley, S., Balogh, A., Mouikis, C., M¨obius, E., Dunlop, M., Bosqued, J., Carlson, C., Parks, G., Cerisier, J., Kelly, J., Sauvaud, J., and R`eme, H.: Pulsed flows at the high-altitude cusp poleward boundary, and as-sociated ionospheric convection and particle signatures, during a Cluster – FAST – SuperDARN- Søndrestrøm conjunction under a southwest IMF, Ann. Geophys., 22, 2891–2905, 2004,
SRef-ID: 1432-0576/ag/2004-22-2891.
Forslund, D. W., Kindel, J. M., and Stroscio, M. A.: Current driven electromagnetic ion cyclotron instability, Journal of Plasma Physics, 21, 127–139, 1979.
Fuselier, S. A., Trattner, K. J., and Petrinec, S. M.: Cusp observa-tions of high- and low-latitude reconnection for northward inter-planetary magnetic field, J. Geophys. Res., 105, 253–266, 2000. Gurnett, D. A. and Frank, L. A.: Plasma waves in the polar cusp -Observations from Hawkeye 1, J. Geophys. Res., 83, 1447–1462, 1978.
Gustafsson, G. , Andr´e, M., Carozzi, T., Eriksson, A. I., F¨althammar, C.-G., Grard, R., Holmgren, G., Holtet, J. A., Ivchenko, N., Karlsson, T., Khotyaintsev, Y., Klimov, S., Laakso, H., Lindqvist, P.-A., Lybekk, B., Marklund, G., Mozer, F., Mur-sula, K., Pedersen, A., Popielawska, B., Savin, S., Stasiewicz, K., Tanskanen, P., Vaivads, A., and Wahlund, J-E.: First results of electric field and density observations by Cluster EFW based on initial months of operation, Ann. Geophys., 19, 1219–1240, 2001,
SRef-ID: 1432-0576/ag/2001-19-1219.
Haerendel, G., Paschmann, G., Sckopke, N., and Rosenbauer, H.: The frontside boundary layer of the magnetosphere and the prob-lem of reconnection, J. Geophys. Res., 83, 3195–3216, 1978. Ichimaru, S.: Basic principles of plasma physics: a statistical
ap-proach, Benjamin/Cummings, Reading, Massachusets, 1973. Janhunen, P., Olsson, A., Vaivads, A., and Peterson, W. K.:
Gener-ation of Bernstein waves by ion shell distributions in the auroral region, Ann. Geophys., 21, 881–891, 2003,
SRef-ID: 1432-0576/ag/2003-21-881.
Kintner, P. M., Labelle, J., Scales, W., Yau, A. W., and Whalen, B. A.: Observations of plasma waves within regions of perpen-dicular ion acceleration, Geophys. Res. Lett., 13, 1113–1116, 1986.
Lakhina, G. S.: Generation of ULF waves in the polar cusp region by velocity shear-driven kinetic Alfv´en modes, Astrophys. Space Sci., 165, 153–161, 1990.
Lavraud, B., Dunlop, M. W., Phan, T. D., R`eme, H., Bosqued, J.-M., Dandouras, I., Sauvaud, J.-A., Lundin, R., Taylor, M. G. G. T.,
Cargill, P. J., Mazelle, C., Escoubet, C. P., Carlson, C. W., McFadden, J. P., Parks, G. K., Moebius, E., Kistler, L. M., Bavassano-Cattaneo, M.-B., Korth, A., Klecker, B., and Balogh, A.: Cluster observations of the exterior cusp and its surround-ing boundaries under northward IMF, Geophys. Res. Lett., 29, 56–60, 2002.
Lavraud, B., Phan, T. D., Dunlop, M. W., Taylor, M. G. G. T., Cargill, P. J., Bosqued, J.-M., Dandouras, I., R`eme, H., Sauvaud, J.-A., Escoubet, C. P., Balogh, A., and Fazakerley, A.: The ex-terior cusp and its boundary with the magnetosheath: Cluster multi-event analysis, Ann. Geophys., 22, 3039–3054, 2004,
SRef-ID: 1432-0576/ag/2004-22-3039.
Le, G., Blanco-Cano, X., Russell, C. T., Zhou, X.-W., Mozer, F., Trattner, K. J., Fuselier, S. A., and Anderson, B. J.: Electro-magnetic ion cyclotron waves in the high altitude cusp: Polar observations, J. Geophys. Res., 19 067–19 080, 2001.
Le Queau, D. and Roux, A.: Heating of oxygen ions by resonant absorption of Alfv´en waves in a multicomponent plasma, J. Geo-phys. Res., 97, 14 929–14 946, 1992.
Nykyri, K., Cargill, P. J., Lucek, E. A., Horbury, T. S., Balogh, A., Lavraud, B., Dandouras, I., and R`eme, H.: Ion cyclotron waves in the high altitude cusp: CLUSTER observations at vary-ing spacecraft separations, Geophys. Res. Lett., 30, 12–1, 2003. Onsager, T. G. and Fuselier, S. A.: The location of magnetopause
reconnection for northward and southward interplanetary mag-netic field, Geophys. Monogr. Ser., 84, 183–197, 1994.
Paschmann, G., Haerendel, G., Sckopke, N., Rosenbauer, H., and Hedgecock, P. C.: Plasma and magnetic field characteristics of the distant polar cusp near local noon−The entry layer, J. Geo-phys. Res., 81, 2883–2899, 1976.
Pickett, J. S., Franz, J. R., Scudder, J. D., Menietti, J. D., Gurnett, D. A., Hospodarsky, G. B., Braunger, R. M., Kintner, P. M., and Kˇurth, W. S.: Plasma waves observed in the cusp turbu-lent boundary layer: An analysis of high time resolution wave and particle measurements from the Polar spacecraft, J. Geophys. Res., 19 081–19 100, 2001.
Pinc¸on, J. L. and Lefeuvre, F.: Local characterization of homoge-neous turbulence in a space plasma from simultahomoge-neous measure-ments of field components at several points in space, J. Geophys. Res., 96, 1789–1802, 1991.
Pinc¸on, J. L. and Motschmann, U.: Multispacecraft filtering:general framework, in Analysis methods for multi-spacecraft data, Int. Space Sci. Inst., Bern, Switzerland, 65–78, 1998.
experiment, Ann. Geophys., 19, 1303–1354, 2001,
SRef-ID: 1432-0576/ag/2001-19-1303.
R¨onnmark, K.: Kiruna Geophysical Institute Report, 179, 1982. Russell, C. T.: The Polar Cusp, Adv. Space Res., 25, 1413–1424,
2000.
Sahraoui, F., Pinc¸on, J. L., Belmont, G., Rezeau, L., Cornilleau-Wehrlin, N., Robert, P., Mellul, L., Bosqued, J. M., Balogh, A., Canu, P., and Chanteur, G.: ULF wave identification in the mag-netosheath: The k-filtering technique applied to Cluster II data, J. Geophys. Res., 108, 1–1, 2003.
Sahraoui, F., Belmont, G., Pinc¸on, J. L., Rezeau, L., Balogh, A. P. R., and Cornilleau-Wehrlin, N.: Magnetic turbulent spectra in the magnetosheath: new insights, Ann. Geophys., 22, 2283– 2288, 2004,
SRef-ID: 1432-0576/ag/2004-22-2283.
Smith, M. F. and Lockwood, M.: Earth’s magnetospheric cusps, Rev. Geophys., 34, 233–260, 1996.
Sundkvist, D., Vaivads, A., Andr´e, M., Wahlund, J.-E., Hobara, Y., Joko, S., Krasnoselskikh, V. V., Bogdanova, Y. V., Buchert, S. C., Cornilleau-Wehrlin, N., Fazakerley, A., Hall, J.-O., R`eme, H., and Stenberg, G.: Multi-spacecraft determination of wave char-acteristics near the proton gyrofrequency in high-altitude cusp, Ann. Geophys., 23, 983–995, 2005,
SRef-ID: 1432-0576/ag/2005-23-983.
Tsurutani, B. T., Lakhina, G. S., Ho, C. M., Arballo, J. K., Gal-van, C., Boonsiriseth, A., Pickett, J. S., Gurnett, D. A., Peterson, W. K., and Thorne, R. M.: Broadband plasma waves observed in the polar cap boundary layer: Polar, J. Geophys. Res., 103, 17 351–17 366, 1998.
Tsyganenko, N. A.: A magnetospheric magnetic field model with a warped tail current sheet, Planet. Space Sci., 37, 5–20, 1989. Vontrat-Reberac, A., Bosqued, J. M., Taylor, M. G. G. T., Lavraud,
![Fig. 7. The FFT power spectra of the FGM data during the pe-riod �T1 calculated for the spacecraft 1 in the frequency range[0.09,3] Hz](https://thumb-us.123doks.com/thumbv2/123dok_us/8176375.253555/9.595.312.546.265.462/fig-fft-power-spectra-calculated-spacecraft-frequency-range.webp)