O R I G I N A L R E S E A R C H
Open Access
Evaluation of elastix-based propagated align
algorithm for VOI- and voxel-based analysis of
longitudinal
18
F-FDG PET/CT data from patients
with non-small cell lung cancer (NSCLC)
Gerald SMA Kerner
1*, Alexander Fischer
2, Michel JB Koole
3, Jan Pruim
3,4and Harry JM Groen
1Abstract
Background:Deformable image registration allows volume of interest (VOI)- and voxel-based analysis of longitudinal changes in fluorodeoxyglucose (FDG) tumor uptake in patients with non-small cell lung cancer (NSCLC). This study evaluates the performance of the elastix toolbox deformable image registration algorithm for VOI and voxel-wise assessment of longitudinal variations in FDG tumor uptake in NSCLC patients.
Methods:Evaluation of the elastix toolbox was performed using18F-FDG PET/CT at baseline and after 2 cycles of therapy (follow-up) data in advanced NSCLC patients. The elastix toolbox, an integrated part of the IMALYTICS workstation, was used to apply a CT-based non-linear image registration of follow-up PET/CT data using the baseline PET/CT data as reference. Lesion statistics were compared to assess the impact on therapy response assessment. Next, CT-based deformable image registration was performed anew on the deformed follow-up PET/CT data using the original follow-up PET/CT data as reference, yielding a realigned follow-up PET dataset. Performance was evaluated by determining the correlation coefficient between original and realigned follow-up PET datasets. The intra- and extra-thoracic tumors were automatically delineated on the original PET using a 41% of maximum standardized uptake value (SUVmax) adaptive threshold. Equivalence between reference and realigned images was tested (determining 95% range of the difference) and estimating the percentage of voxel values that fell within that range. Results:Thirty-nine patients with 191 tumor lesions were included. In 37/39 and 12/39 patients, respectively, thoracic and non-thoracic lesions were evaluable for response assessment. Using the EORTC/SUVmax-based criteria, 5/37 patients had a discordant response of thoracic, and 2/12 a discordant response of non-thoracic lesions between the reference and the realigned image. FDG uptake values of corresponding tumor voxels in the original and realigned reference PET correlated well (R2=0.98). Using equivalence testing, 94% of all the voxel values fell within the 95% range of the difference between original and realigned reference PET.
Conclusions:The elastix toolbox impacts lesion statistics and therefore therapy response assessment in a clinically significant way. The elastix toolbox is therefore not applicable in its current form and/or standard settings for PET response evaluation. Further optimization and validation of this technique is necessary prior to clinical implementation.
Keywords:Elastix; PET/CT; Image deformation; NSCLC
* Correspondence:[email protected]
1University of Groningen and Department of Pulmonary Diseases, University Medical Center Groningen, Hanzeplein 1, P.O. Box 30.001, 9700 RB Groningen, The Netherlands
Full list of author information is available at the end of the article
© 2015 Kerner et al.; licensee Springer. This is an Open Access article distributed under the terms of the Creative Commons Attribution License (http://creativecommons.org/licenses/by/4.0), which permits unrestricted use, distribution, and reproduction in any medium, provided the original work is properly credited.
Kerneret al. EJNMMI Research (2015) 5:15
Background
Tumor response during or after treatment is an import-ant surrogate marker for survival in oncological patients. Most commonly, tumor response is measured with CT using predefined anatomical criteria such as the Re-sponse Evaluation Criteria in Solid Tumors (RECIST) criteria or volumetric criteria [1]. In the past years, metabolic response assessment with 18F-FDG PET has gained importance for patients treated with chemother-apy. Especially for patients who are treated with tyrosine kinase inhibitors, metabolic lesion changes as measured with PET have been proven to precede lesion size alter-ations measurable with CT [2-4]. In order to standardize metabolic response assessment with 18F-FDG PET, the European Organization for Research and Treatment of Cancer (EORTC) recommendations and more recently the PERCIST criteria were drafted as guidance for clin-ical practice [5,6].
Traditionally, 18F-FDG lesion uptake is quantified by the maximum and/or mean standardized uptake value (SUV) of tumor lesions. Although these measures (spe-cifically maximum standardized uptake value (SUVmax)) have a prognostic value in a variety of cancers, including non-small cell lung cancer (NSCLC) [7-10], flaws in SUV quantification can be introduced by a variety of factors including the type of equipment used, differences in PET acquisition protocols, reconstruction parameters, analysis procedures, and image statistics. Moreover, tex-tural changes in tumor heterogeneity better reflect tumor response and survival than SUV quantification alone [11].
Consequently, research efforts have attempted to im-prove the predictive nature of PET by taking into ac-count all voxel values and using voxel-wise approaches for image analysis. For other imaging modalities, such as MR imaging, a so-called voxel-by-voxel analysis is well established. It has been proven to be a viable technique for measuring therapy response in breast cancer [12], while for high-grade glioma, it was predictive for the overall survival rate [13]. Voxel-based analysis has also been applied to response assessment with PET images in head and neck cancer patients and was shown to be a useful tool [14].
Deformable image registration may help to improve tumor response assessment. The elastix toolbox is a modular computer program for intensity-based medical image registration. The elastix toolbox [15] has been validated for thoracic deformable CT to CT image regis-tration demonstrating a good overall performance com-pared to other available algorithms [16]. Theoretically, this algorithm can also be applied to the PET/CT data-sets using the corresponding sequentially acquired low-dose CT data. Because of the public domain nature of the program, the modular adaptability, and the previous
good performance, the toolbox has been integrated with the propagated align algorithm to perform PET/CT to PET/CT deformable image registration. To the best of our knowledge, the performance of the elastix toolbox on the alignment of solid lung tumors or the impact on intratumoral distribution of 18F-FDG uptake has not been assessed so far. The aim of this study is to evaluate the applicability of the elastix deformable registration for a volume of interest (VOI)-based evaluation of lesion statistics.
Methods
Baseline VOIs and transformed and interpolated follow-up data and a voxel-by-voxel longitudinal mapping of18 F-FDG uptake in a clinical setting of patients with advanced NSCLC were used. For this evaluation, the dif-ferent steps necessary to perform PET/CT to PET/CT alignment with the elastix toolbox were integrated in the IMALYTICS Research Workstation to make the CT-based deformable registration functionality for thoracic and extra-thoracic lesions available to clinical end users and researchers.
Patients and tumor lesions
Patients with advanced (stages III and IV) NSCLC were studied. All underwent serial18F-FDG PET/CT prior to and after 6 weeks of chemotherapy as part of routine clinical care. No consent was necessary from the Medical Ethics Committee because of the retrospective nature of this study, under the Dutch Medical Research involving Human Subjects Act.
18
F-FDG PET/CT 18
F-FDG PET/CT scanning was performed on a Siemens Biograph mCT 64 slice PET/CT scanner (Siemens Healthcare, Erlangen, Germany). Blood glucose levels were consistently checked and recorded. All values were below 11 mmol/L. A weight-dependent 18F-FDG dose (3 MBq/kg bodyweight) was administered to the patients intravenously, and 60 min post-injection PET/CT scan was acquired from the mid-thigh to the brain [17]. Prior to PET imaging, a low-dose CT scan was acquired cra-niocaudally during shallow breathing. Effective tube current was 24 mAs, tube voltage of 100 kV and care dose switched on. Slice thickness was 2 mm, and pitch 1.5 with a gantry rotation time of 0.5 s.
PET imaging was performed with a scan time per bed position dependent on patient weight. Scan time per bed position was 1 min for a patient weighing less than 60 kg, 2 min for a patient weighing between 60 and 90 kg, and 3 min for a patient weighing above 90 kg [17]. PET data were corrected for attenuation using the low-dose CT data while a delayed coincidence window
was used for random correction and a model-based scat-ter correction was applied.
PET data were reconstructed using a transaxial image matrix of 256 × 256 and an ordered subset expectation maximization (OSEM) algorithm taking advantage of time of flight information and modeling the system re-sponse. This scheme used 3 iterations each consisting of 21 subsets. The reconstructed volumetric voxel size was 3.2 × 3.2 × 2.0 mm (20.8 mm3). A Gaussian filter with 8-mm full width half maximum (FWHM) was used to smooth the reconstructed data, such that recovery coef-ficients were in line with EANM guidelines [18].
Per patient multiple metabolically active tumor lesions were delineated on the reference and the baseline scan using the 41% adaptive thresholding technique [19]. VOI lesions were classified as both thoracic with presumed movement errors and extra-thoracic localization with minimal movement errors. Lesions were defined as thor-acic if they were within the lung, mediastinum, and in or against the interior side of the thoracic wall. The largest thoracic lesion was defined as the primary tumor.
CT-based response assessment
Contrast-enhanced CT of the thorax was performed on the Biograph mCT in the same session. Scanning was performed craniocaudally in 8 s, with breath hold at inspiration. Effective tube current was 80 mAs with tube voltage of 120 kV and care dose settings on. Slice thick-ness was 0.5 mm, and pitch was 1.4 with a gantry rota-tion time of 0.5 s. Patients were injected with 55 mL of Iomeron contrast (350 mg/mL) at a speed of 2.5 mL/s, starting 30 s before the start of the scan. Tumor response was measured on CT according to RECIST 1.1 criteria [1].
Propagated align algorithm function
The propagated align algorithm, which is part of the PC-based IMALYTICS Research Workstation (Philips Innova-tive Technologies GmbH, Aachen, Germany) is based on the elastix toolbox (version 4.6), a public domain computer program for intensity-based medical image registration [15]. The elastix-based propagated align al-gorithm incorporates a graphical user interface and provides a cubic B-spline-based non-linear algorithm to correct for deformations. Rigid and deformable image registration is performed on the low-dose CT data, and the resulting transformations are thereafter applied on the sequentially acquired PET scans.
CT to CT registration errors were previously investi-gated and known to be small [16,20]. Consequently, they were not further studied in this paper.
The procedure for the deformable registration of a target PET/CT dataset to a reference PET/CT dataset is as follows:
1. The rigid transformation for optimal alignment of the target CT to the reference CT dataset is determined.
2. Subsequently, the resulting rigid transformation (translation and rotation) is applied to the target PET to ensure that the target PET properly aligns to the reference PET.
3. Next, a non-rigid transformation is performed on the rigidly aligned CT images as discussed by Klein et al. [15]. The result is a deformation vector field (Table 1) based on cubic B-splines mapping the rigidly transformed target CT onto the reference CT. For quality assurance, the Jacobian determinant (Table 1) of the deformation vector field is extracted as well, since it provides information on the local deformations (expansion/contraction). No additional constraints to the deformation field are imposed. 4. The following step is to propagate the deformation
field to the rigidly aligned PET images from step 2. In this way, target PET images are deformed to spatially match the reference PET data.
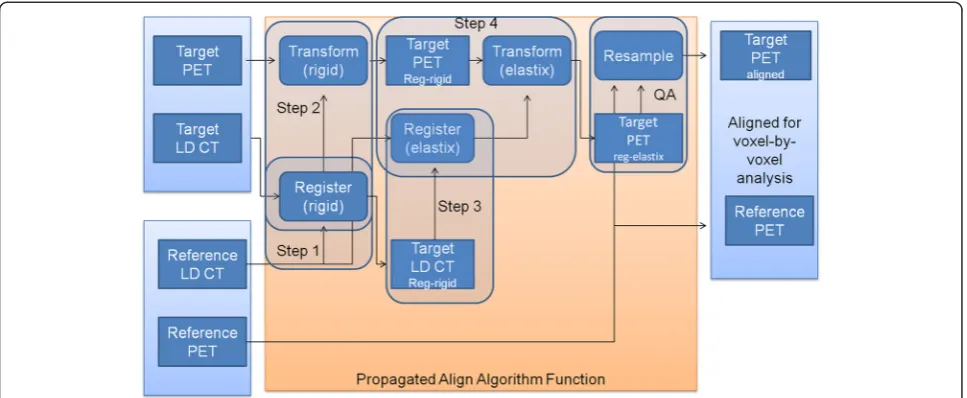
The fusion steps are also detailed in Figure 1. All transformation calculations used a four-level multi-resolution approach while mutual information as image similarity measure, and an adaptive stochastic gradient descent optimizer [21] was used to maximize image similarity. The control point spacing of the B-spline transformation was 16 mm. The maximum number of iterations was set to 250 (rigid) and 500 (B-spline). Because of computation time, data were proc-essed in batch mode using python scripting.
Quality assessment of the image registration was per-formed systematically by visually comparing each non-rigidly aligned CT to the reference CT scan.
Longitudinal VOI-based and voxel-by-voxel analysis All previous steps are necessary in order to achieve de-formable image registration of PET images acquired at different time points. Next, the deformed or ‘warped’ image registration was evaluated in terms of both lesion statistics and voxel-by-voxel mapping of tumoral 18 F-FDG uptake.
First, the lesion statistics were investigated as follows: the follow-up PET data were transformed and interpolated to the spatial voxel locations of the baseline PET data. Tumor delineations of the baseline PET scan were used to calculate lesion statistics of both baseline and the aligned follow-up data. These findings were compared with the lesion statistics determined on the original (non-warped) follow-up PET data. This was done in order to evaluate the impact of deformed and interpolated follow-up data on therapy response assessment.
Secondly, in terms of voxel-by-voxel mapping of tumoral 18F-FDG uptake between different PET time points, the original follow-up dataset was aligned to the baseline PET/CT (which was used for the lesion statis-tics). An elastix deformable image registration was per-formed again to realign the warped follow-up dataset back with the original follow-up dataset. The aim is to assess to which extent the original follow-up tumor uptake values is preserved by applying image registration using the elastix toolbox. If there were any large discrepancies (i. e., <80% alignment usingΔSUV), we further investigated the reason for this low alignment percentage.
Impact of PET signal to noise ratio (SNR) on the voxel-by-voxel analysis
Signal to noise measurements were performed by defin-ing VOIs in healthy pulmonary and hepatic tissue of the original PET data. A spherical VOI of 5 cm diameter was placed in the right lobe of the liver, while a 3-cm-diameter spherical VOI was positioned in healthy lung tissue.
Statistics
The correlation coefficient between original and rea-ligned tumor uptake values (SUV) was determined using Pearson’s R test. The difference between original and realigned tumor uptake values was calculated both as the difference in standard uptake values (ΔSUV) and the difference in percentage of the original SUV (Δ percent-age). Equivalence between original and realigned follow-up tumor follow-uptake values was assessed by a Bland-Altman
analysis with the original follow-up tumor data used as reference method. For the Bland-Altman analysis,ΔSUV and Δ% SUV corresponding to the 95% limits of agree-ment was determined taking into account the tumor voxels of all measurable tumor lesions in all patients.
To assess the influence of spatial discrepancies be-tween PET and CT data due to respiratory and cardiac motion, equivalence between original and realigned tumor uptake values was assessed per patient separately for thoracic and extra-thoracic lesions. The significance of the equivalence between thoracic and extra-thoracic lesions was assessed using a chi-square test.
To assess the effects of SNR, the mean activity of the lung and liver spherical VOI were divided by the stand-ard deviation (SD) of the activity. This was performed to estimate for the signal to noise ratio. Impact of the PET SNR on the voxel-by-voxel statistical analysis was evalu-ated by assessing the relationship between PET SNR and equivalence between original and realigned tumor up-take values.
All statistical analyses were performed using SPSS version 20.0 (International Business Machines Corp, Armonk, NY, USA). Nominal P values less than 0.05 were considered significant.
Results
A total of 39 patients were evaluated. There were 37 patients with stage IV disease and 2 with stage III. Me-dian age was 59 (21 to 79) years, and male/female ratio was 14/25. Body weight changed less than 1 kg during the study.
Figure 1Fusion steps of the propagated align algorithm.Reg-rigid: rigidly registered image. Reg-elastix: rigid and non-rigidly registered image. Step 1: rigid CT to CT alignment of target to reference. Step 2: translation of step 1 on target PET. Step 3: CT to rigid aligned CT non-rigid alignment using elastix toolbox. Step 4: translation of step 3 to PET of step 2. QA: resample of image as quality assurance, so voxel size matches prior to voxel-by-voxel comparison.
Delineated tumor lesions
For each of the 39 patients, a median (range) number of 3 (1 to 20) VOIs were delineated on the original baseline fluorodeoxyglucose (FDG) PET scan with per tumor VOI localization. The range of the volume of the pri-mary tumor was 2.4 to 556.8 mL (median 25.5 mL), and for the metastasis, it was 1.2 to 390 mL (median 7.8 mL). For the 39 patients, a total of 191 different tu-mors (primaries and metastases) consisting of 295,219 tumor voxels (6,141 mL) were considered.
Equivalence of the original and realigned baseline tumor uptake values
On visual assessment, all target CT aligned properly to the respective reference CT. There was a good relationship between the voxel values of the original and elastix ad-justed images (Pearson correlation test;R20.98;P< 0.01).
Equivalence testing usingΔSUV
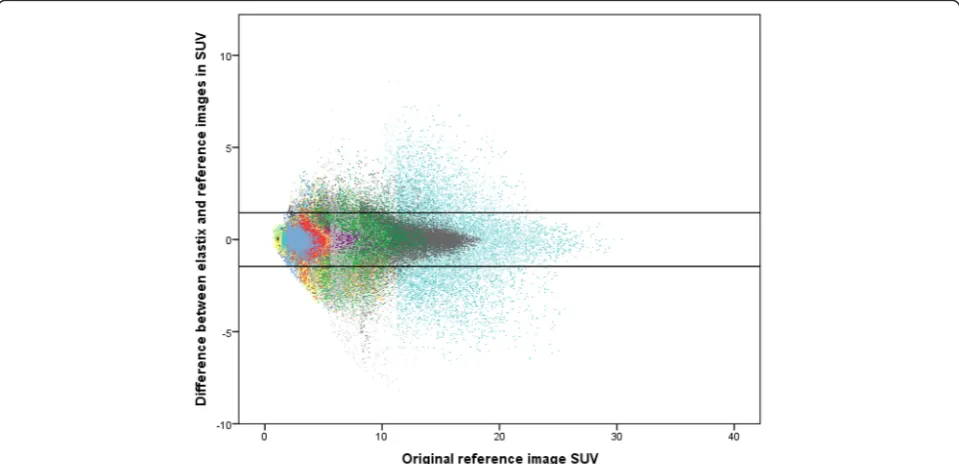
The SD of the ΔSUV between reference and target im-ages was 0.74. With the range of the 95% limits of agree-ment defined as between −1.46 and 1.46 ΔSUV, a total of 94% of all voxels was accurately aligned within the range, or in other words, 6% of the voxels mismatched (Figure 2). UsingΔSUV, 34 patients had a thoracic align-ment (i.e., the voxel percentage with an alignalign-ment within the 95% estimated range) of above 80%. Five patients had an alignment less than 80% (Table 1; see below). The extra-thoracic locations aligned above 90% of the voxels in all patients implicating that movement control was adequate (Table 1).
A typical example of a patient is shown in Figure 3, with the reference, target and target minus reference image.
Further study of the 5 patients with a voxel alignment <80% revealed that the reason for misalignment in gen-eral was due to CT- to PET-specific-related inaccuracies. In some patients, these inaccuracies were specific to therapy as it involved tumor necrosis (Figure 4). The other reason for an inaccuracy was the subsequent pres-ence or abspres-ence of collapsed lung tissue after therapy (Additional file 1: Table S1).
Equivalence testing usingΔpercentage
The SD of the Δpercentage between reference and tar-get images was 13%. With the range of the 95% limits of agreement defined as between−25 and 25Δpercentage, a total of 93% of voxels aligned within this range, which means that 7% of the voxels mismatched using this method. The alignment percentage per patient using ΔSUV andΔpercentage is detailed in Table 2.
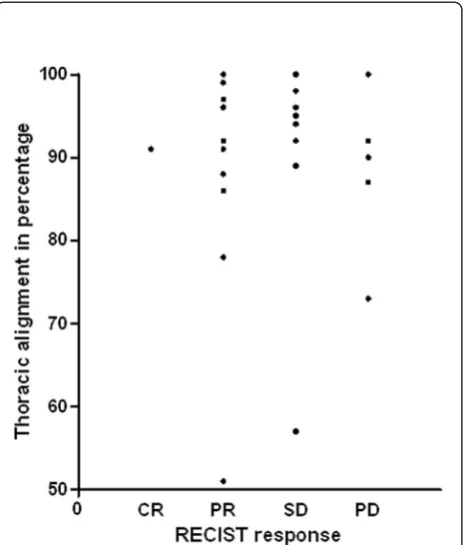
There was no relation between the alignment percent-age and tumor response (Figure 5), signal to noise ratio of either the liver or normal parts of the lung, or with the distribution of the original SUV.
Assessment of effects on SUVmax
It was not possible to perform simultaneous measurement of the SUVmax in two patients. One (nr. 23) had only a solitary extra-thoracic metastasis. The other patient (nr. 32) had at baseline no measurable thoracic lesions; how-ever, there was a significant amount of measurable lesions after 6 weeks of therapy. The median difference of SUVmax of the primary tumor between the elastix adjusted to
Figure 2Equivalence plot between reference and realigned images of 39 patients.94% of the voxels are within the 95% range of the difference.
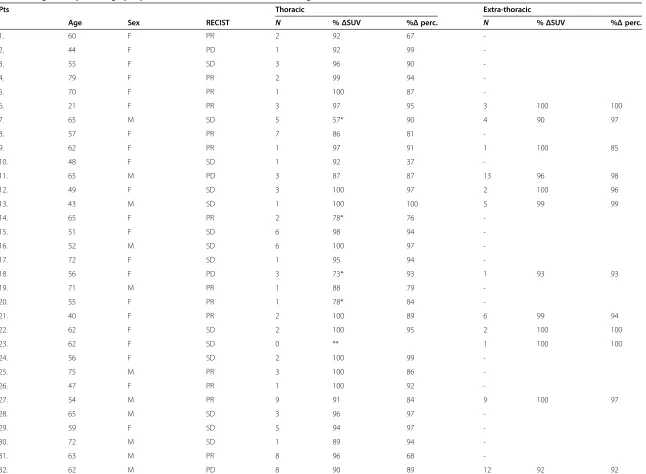
Table 1 Alignment percentage per patient between elastix and baseline image of intra- and extra-thoracic measurable lesions
Pts Thoracic Extra-thoracic
Age Sex RECIST N %ΔSUV %Δperc. N %ΔSUV %Δperc.
1. 60 F PR 2 92 67
-2. 44 F PD 1 92 99
-3. 55 F SD 3 96 90
-4. 79 F PR 2 99 94
-5. 70 F PR 1 100 87
-6. 21 F PR 3 97 95 3 100 100
7. 65 M SD 5 57* 90 4 90 97
8. 57 F PR 7 86 81
-9. 62 F PR 1 97 91 1 100 85
10. 48 F SD 1 92 37
-11. 65 M PD 3 87 87 13 96 98
12. 49 F SD 3 100 97 2 100 96
13. 43 M SD 1 100 100 5 99 99
14. 65 F PR 2 78* 76
-15. 51 F SD 6 98 94
-16. 52 M SD 6 100 97
-17. 72 F SD 1 95 94
-18. 56 F PD 3 73* 93 1 93 93
19. 71 M PR 1 88 79
-20. 55 F PR 1 78* 84
-21. 40 F PR 2 100 89 6 99 94
22. 62 F SD 2 100 95 2 100 100
23. 62 F SD 0 ** 1 100 100
24. 56 F SD 2 100 99
-25. 75 M PR 3 100 86
-26. 47 F PR 1 100 92
-27. 54 M PR 9 91 84 9 100 97
28. 65 M SD 3 96 97
-29. 59 F SD 5 94 97
-30. 72 M SD 1 89 94
-31. 63 M PR 8 96 68
-32. 62 M PD 8 90 89 12 92 92
Kerner
et
al.
EJNMMI
Research
(2015) 5:15
Page
6
of
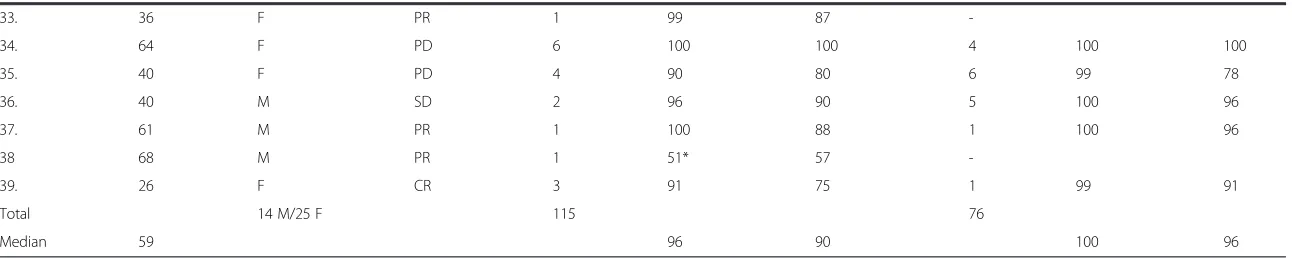
Table 1 Alignment percentage per patient between elastix and baseline image of intra- and extra-thoracic measurable lesions(Continued)
33. 36 F PR 1 99 87
-34. 64 F PD 6 100 100 4 100 100
35. 40 F PD 4 90 80 6 99 78
36. 40 M SD 2 96 90 5 100 96
37. 61 M PR 1 100 88 1 100 96
38 68 M PR 1 51* 57
-39. 26 F CR 3 91 75 1 99 91
Total 14 M/25 F 115 76
Median 59 96 90 100 96
N, number of measurable lesions per patient; %ΔSUV, percentage of the voxels that fall within the 95% limits of agreement of−1.46 to 1.46ΔSUV; %Δ% perc., percentage of the voxels that fall within the 95% limits of agreement of−25 to 25Δpercentage; CR, complete response; PR, partial response; SD: stabile disease; PD, progressive disease;−, no extra-thoracic lesions present. *Misalignment caused by adjacent normal tissue. **Patient with a solitary metastasis post curative surgical treatment. RECIST 1.1 response assessment.
Kerner
et
al.
EJNMMI
Research
(2015) 5:15
Page
7
of
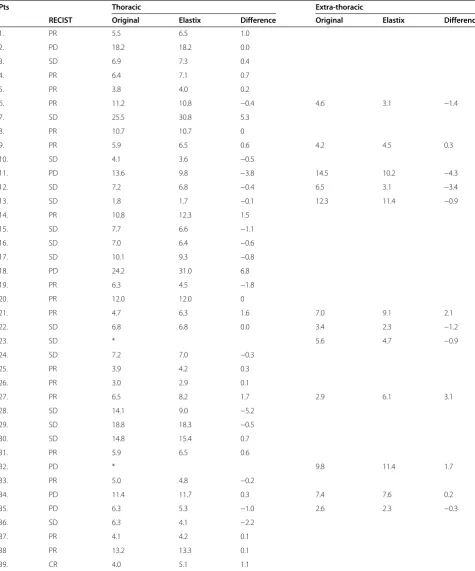
baseline image and the original image was 0.0 SUV (−5.2 to 6.8 SUV), while for extra-thoracic lesions it was −0.6 SUV (−4.3 to 3.1 SUV). When measured using the EORTC criteria, concerning the primary tumor, 5/37 patients had a discordant response, whereas in the extra-thoracic lesions, 2/12 patients had a discordant response (Table 2).
Discussion
In this study, we investigated whether a non-linear re-alignment of PET images using the elastix toolbox can
be used for therapy assessment on patients with NSCLC. This allows the reuse of baseline lesion delineations for the quantification of tracer uptake in tumor lesions at follow-up. Also, it may facilitate therapy response assess-ment using EORTC or PERCIST criteria. Furthermore, this approach may allow an automated volumetric voxel-by-voxel analysis as it delivers more information on tumor changes. Changes in the distribution of voxels under the influence of treatment in terms of percentage vi-able voxels (i.e., percentage above or below a predetermined
Figure 3Original (A), elastix adjusted (B), and subtraction(C) maximum intensity projection of patient 6.These images show the typical results before and after alignment as well as the difference between these two images.
;
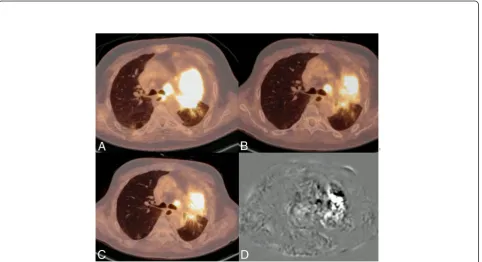
.Figure 4Example image of patient 7: baseline (A), reference (B), elastix adjusted (C) and subtraction (D).Because of a mix of non-active and active tumor tissue between the two scans (and no visible decrease in anatomic tumor size with stable disease), only 57% of the voxels aligned within the 95% limits of agreement of−1.46 to 1.46ΔSUV. However, on crude visual assessment, the images look very similar.
Table 2 SUVmaxof thoracic and non-thoracic lesions and the difference between original and elastix adjusted image
Pts Thoracic Extra-thoracic
RECIST Original Elastix Difference Original Elastix Difference
1. PR 5.5 6.5 1.0
2. PD 18.2 18.2 0.0
3. SD 6.9 7.3 0.4
4. PR 6.4 7.1 0.7
5. PR 3.8 4.0 0.2
6. PR 11.2 10.8 −0.4 4.6 3.1 −1.4
7. SD 25.5 30.8 5.3
8. PR 10.7 10.7 0
9. PR 5.9 6.5 0.6 4.2 4.5 0.3
10. SD 4.1 3.6 −0.5
11. PD 13.6 9.8 −3.8 14.5 10.2 −4.3
12. SD 7.2 6.8 −0.4 6.5 3.1 −3.4
13. SD 1.8 1.7 −0.1 12.3 11.4 −0.9
14. PR 10.8 12.3 1.5
15. SD 7.7 6.6 −1.1
16. SD 7.0 6.4 −0.6
17. SD 10.1 9.3 −0.8
18. PD 24.2 31.0 6.8
19. PR 6.3 4.5 −1.8
20. PR 12.0 12.0 0
21. PR 4.7 6.3 1.6 7.0 9.1 2.1
22. SD 6.8 6.8 0.0 3.4 2.3 −1.2
23. SD * 5.6 4.7 −0.9
24. SD 7.2 7.0 −0.3
25. PR 3.9 4.2 0.3
26. PR 3.0 2.9 0.1
27. PR 6.5 8.2 1.7 2.9 6.1 3.1
28. SD 14.1 9.0 −5.2
29. SD 18.8 18.3 −0.5
30. SD 14.8 15.4 0.7
31. PR 5.9 6.5 0.6
32. PD * 9.8 11.4 1.7
33. PR 5.0 4.8 −0.2
34. PD 11.4 11.7 0.3 7.4 7.6 0.2
35. PD 6.3 5.3 −1.0 2.6 2.3 −0.3
36. SD 6.3 4.1 −2.2
37. PR 4.1 4.2 0.1
38 PR 13.2 13.3 0.1
39. CR 4.0 5.1 1.1
*No thoracic lesion measurable, RECIST 1.1 response assessment. CR, complete response; PR, partial response; SD, stabile disease; PD, progressive disease.
cutoff point) within a certain volume of interest may be a better indicator of efficacy and consequently have prognos-tic value. In order to make this method feasible, a reliable alignment technique for PET scans is paramount. We used the elastix toolbox which had shown good performance in different CT-based thoracic alignment studies [22,23]. Anatomical information such as lung boundaries and major lung fissures and correspondence to annotated landmark pairs were used, and the results showed a good perform-ance. The toolbox makes use of a cubic B-spline non-linear algorithm which shows good mass preservation between inspiration and expiration CT scans [24]. Our study not only used the CT-based alignment of the elastix toolbox but also projected this alignment on the corresponding18 F-FDG PET images, and the performance was assessed using both lesion statistics and voxel-by-voxel analysis.
Our results show that the method has significant im-pact on lesion statistics. This imim-pact, with differences between−5 and 7 ΔSUV in thoracic lesions, is clinically relevant. First of all, such large spread of 12 SUV affects the interpretation of the results in a clinically significant way. Secondly, we observed changes in the response as-sessment in 5 out of 37 (14%) patients using the 1999 EORTC response proposal. The elastix toolbox settings were optimized for CT-CT registration where the align-ment of anatomical structures in the lungs was the
primary target. For longitudinal PET quantification, other settings might be more appropriate. On the other hand, the approach for volumetric tumor analysis used by van Velden et al. where instead of interpolating follow-up data to match baseline voxel locations, the baseline VOIs are projected onto the follow-up data, may be considered more appropriate for longitudinal tracer quantification [25]. The reason that it might be more appropriate is that this approach does not allow a voxel-by-voxel analysis but allows a more accurate quan-tification of global tumor characteristics such as SUVmax.
The second goal of using deformable image registra-tion and realigning follow-up with baseline data was to be able to measure more accurately intratumoral hetero-geneity (textural analysis) and response to treatment in a more detailed manner. This is important, as initially measured high intratumoral heterogeneity on 18F-FDG PET is related both to poor prognosis and to resistance to treatment [26]. We demonstrate that the original intratumoral tracer distribution indeed can be preserved by using a forward and backward deformable image registration. This means that the registration process is nearly invertible and information about intratumoral tracer distribution is preserved to a great extent during the registration.
The propagated align algorithm itself is a shell that makes the multiple steps necessary for performing de-formable image registration using the elastix toolbox more user friendly. It provides an automated method to perform not just the multiple steps per patient but also the multiple patients per instance. It can also be adapted to other deformable image registration methods.
Methodological shortcomings
There are some factors that negatively influence the ap-plication of this technique.
First, in 5 patients, there was a voxel misalignment in the thorax, which was caused by the presence of medias-tinal tissue directly adjacent to the tumor tissue. We need to consider that the first step of the alignment method is based on anatomical CT changes and that on CT, hardly no difference can be made between the col-lapsed lung, tumor necrosis, or mediastinal tissue, whereas PET can do so. Consequently, in these cases, the method will introduce discrepancies, that will need further attention.
Second, as was seen with the SUVmaxmeasurement, in some patients, the SUVmax was different with a wide-spread on the elastix adjusted image and the original image. This effect was particularly pronounced in thor-acic lesions. However, because the voxel-by-voxel analysis showed that values correspond well after for-ward and backfor-ward transformations, it suggests that the
Figure 5Relation between thoracic imaging alignment and tumor response according to RECIST criteria per patient.RECIST tumor response was not related to the thoracic alignment percentage.
corresponding transformation is practically invertible. This is a concern that needs further optimization of the algorithm and limits the applicability of the algorithm in its current stage. This problem could be exacerbated due to the use of 3D instead of 4D PET. A previous study showed significant differences in textural features be-tween static 3D and respiratory-gated 4D PET/CT [27]. The same study showed higher uptake and less blurring in the 4D PET images compared to the corresponding 3D PET images [27].
Third, we were not able to further compare the tex-tural features between the images. Textex-tural features can predict disease recurrence and survival, sometimes more powerfully than the current global measurements used in clinical practice [11,26]. This should be the subject of future studies.
Conclusions
Comparative imaging analyses with an automated voxel-by-voxel technique are a promising tool for tumor evalu-ation in patients with advanced NSCLC. However, the elastix toolbox impacts lesion statistics and therefore therapy response assessment in a clinically significant way. Consequently, the elastix toolbox is not applicable in its current form and/or standard settings for response evaluation. It remains to be determined to which extent the intratumoral uptake distribution is preserved when this type of deformable image registration is applied. Further optimization and validation is necessary due to the inaccuracies observed in this study. The propagated align algorithm provides the shell for performing deformable image registration, in this case, using the elas-tix toolbox. The propagated align algorithm itself could be adapted for performing deformable image registration using other techniques.
Additional files
Additional file 1: Table S1.Reason for less than 80% alignment using ΔSUV.
Competing interests
GK was employed by CTMM, the Center for Translational Molecular Medicine. AF is employed by Philips Technologie GmbH Innovative Technologie and has developed the IMALYTICS Research Workstation described herein. The other authors declare that they have no competing interests.
Authors’contributions
HG developed the study design. GK carried out the research and wrote the manuscript. AF developed the shell algorithms used for this study. GK, AF, MK, JP, and HG all made substantial contributions to the analysis and interpretation of data. AF, MK, JP, and HG revised the manuscript critically. All authors have given final approval for this article and agree to be accountable for all aspects of the work.
Acknowledgements
We are grateful to J.H. van Snick for the tremendous logistic support given during the course of this study. This research was performed within the
framework of CTMM, project AIRFORCE (grant 030–103), a non-commercial public-private entity for the advancement of science. CTMM did not play a role in the study design, in the data collection, analysis, and writing of the manuscript. The work was made possible with a contribution of CTMM Air Force Consortium.
Author details
1
University of Groningen and Department of Pulmonary Diseases, University Medical Center Groningen, Hanzeplein 1, P.O. Box 30.001, 9700 RB Groningen, The Netherlands.2Philips Technologie GmbH Innovative Technologies, Postfach 40, Philipstr. 8, Aachen 52068, Germany.3University of Groningen and Department of Nuclear Medicine and Molecular Imaging, University Medical Center Groningen, Hanzeplein 1, P.O. Box 30.001, 9700 RB Groningen, The Netherlands.4Department of Nuclear Medicine, Faculty of Medicine & Health Sciences, Tygerberg Hospital, Stellenbosch University, Francie van Zijl drive, Cape Town 7505, South-Africa.
Received: 4 December 2014 Accepted: 20 February 2015
References
1. Eisenhauer EA, Therasse P, Bogaerts J, Schwartz LH, Sargent D, Ford R, et al. New response evaluation criteria in solid tumours: revised RECIST guideline (version 1.1). Eur J Cancer. 2009;45:228–47.
2. Sunaga N, Oriuchi N, Kaira K, Yanagitani N, Tomizawa Y, Hisada T, et al. Usefulness of FDG-PET for early prediction of the response to gefitinib in non-small cell lung cancer. Lung Cancer. 2008;59:203–10.
3. Kobe C, Scheffler M, Holstein A, Zander T, Nogova L, Lammertsma AA, et al. Predictive value of early and late residual 18 F-fluorodeoxyglucose and 18 F-fluorothymidine uptake using different SUV measurements in patients with non-small-cell lung cancer treated with erlotinib. Eur J Nucl Med Mol Imaging. 2012;39:1117–27.
4. Tiseo M, Ippolito M, Scarlattei M, Spadaro P, Cosentino S, Latteri F, et al. Predictive and prognostic value of early response assessment using 18FDG-PET in advanced non-small cell lung cancer patients treated with erlotinib. Cancer Chemother Pharmacol. 2014;73:299–307.
5. Young H, Baum R, Cremerius U, Herholz K, Hoekstra O, Lammertsma AA, et al. Measurement of clinical and subclinical tumour response using [18 F]-fluorodeoxyglucose and positron emission tomography: review and 1999 EORTC recommendations. European Organization for Research and Treatment of Cancer (EORTC) PET Study Group. Eur J Cancer.
1999;35:1773–82.
6. Wahl RL, Jacene H, Kasamon Y, Lodge MA. From RECIST to PERCIST: evolving considerations for PET response criteria in solid tumors. J Nucl Med. 2009;50 Suppl 1:122S–50.
7. Cerfolio RJ, Bryant AS, Ohja B, Bartolucci AA. The maximum standardized uptake values on positron emission tomography of a non-small cell lung cancer predict stage, recurrence, and survival. J Thorac Cardiovasc Surg. 2005;130:151–9.
8. Paesmans M, Berghmans T, Dusart M, Garcia C, Hossein-Foucher C, Lafitte JJ, et al. Primary tumor standardized uptake value measured on fluorodeoxyglucose positron emission tomography is of prognostic value for survival in non-small cell lung cancer: update of a systematic review and meta-analysis by the European Lung Cancer Working Party for the International Association for the Study of Lung Cancer Staging Project. J Thorac Oncol. 2010;5:612–9. 9. Bille A, Okiror L, Skanjeti A, Errico L, Arena V, Penna D, et al. The prognostic
significance of maximum standardized uptake value of primary tumor in surgically treated non-small-cell lung cancer patients: analysis of 413 cases. Clin Lung Cancer. 2013;14:149–56.
10. de Jong WK, van der Heijden HF, Pruim J, Dalesio O, Oyen WJ, Groen HJ. Prognostic value of different metabolic measurements with fluorine-18 fluorodeoxyglucose positron emission tomography in resectable non-small cell lung cancer: a two-center study. J Thorac Oncol. 2007;2:1007–12. 11. Cook GJ, Yip C, Siddique M, Goh V, Chicklore S, Roy A, et al. Are
pretreatment 18 F-FDG PET tumor textural features in non-small cell lung cancer associated with response and survival after chemoradiotherapy? J Nucl Med. 2013;54:19–26.
12. Ma B, Meyer CR, Pickles MD, Chenevert TL, Bland PH, Galban CJ, et al. Voxel-by-voxel functional diffusion mapping for early evaluation of breast cancer treatment. Inf Process Med Imaging. 2009;21:276–87.
13. Galban CJ, Chenevert TL, Meyer CR, Tsien C, Lawrence TS, Hamstra DA, et al. The parametric response map is an imaging biomarker for early cancer treatment outcome. Nat Med. 2009;15:572–6.
14. Schreibmann E, Waller AF, Crocker I, Curran W, Fox T. Voxel clustering for quantifying PET-based treatment response assessment. Med Phys. 2013;40:012401.
15. Klein S, Staring M, Murphy K, Viergever MA, Pluim JP. Elastix: a toolbox for intensity-based medical image registration. IEEE Trans Med Imaging. 2010;29:196–205.
16. Murphy K, van Ginneken B, Reinhardt JM, Kabus S, Ding K, Deng X, et al. Evaluation of registration methods on thoracic CT: the EMPIRE10 challenge. IEEE Trans Med Imaging. 2011;30:1901–20.
17. de Groot EH, Post N, Boellaard R, Wagenaar NR, Willemsen AT, van Dalen JA. Optimized dose regimen for whole-body FDG-PET imaging. EJNMMI Res. 2013;3:63.
18. Boellaard R, O’Doherty MJ, Weber WA, Mottaghy FM, Lonsdale MN, Stroobants SG, et al. FDG PET and PET/CT: EANM procedure guidelines for tumour PET imaging: version 1.0. Eur J Nucl Med Mol Imaging. 2010;37:181–200. 19. Cheebsumon P, Boellaard R, de Ruysscher D, van Elmpt W, van Baardwijk A, Yaqub M, et al. Assessment of tumour size in PET/CT lung cancer studies: PET- and CT-based methods compared to pathology. EJNMMI Res. 2012;2:56.
20. Kanai T, Kadoya N, Ito K, Onozato Y, Cho SY, Kishi K, et al. Evaluation of accuracy of B-spline transformation-based deformable image registration with different parameter settings for thoracic images. J Radiat Res. 2014;55:1163–70.
21. Klein S, Pluim JPW, Staring M, Viergever MA. Adaptive stochastic gradient descent optimisation for image registration. Int J Comput Vis. 2009;81:227–39. 22. Staring M, Klein S, Reiber JHC, Niessen WJ, Stoel BC. Pulmonary image
registration with elastix using a standard intensity-based algorithm. In: Book pulmonary image registration with elastix using a standard intensity-based algorithm. 2010.
23. Kabus S, Klinder T, Murphy K, van Ginneken B, van Lorenz C, Pluim JP. Evaluation of 4D-CT lung registration. Med Image Comput Comput Assist Interv. 2009;12:747–54.
24. Yin Y, Hoffman EA, Lin CL. Mass preserving nonrigid registration of CT lung images using cubic B-spline. Med Phys. 2009;36:4213–22.
25. van Velden FH, van Beers P, Nuyts J, Velasquez LM, Hayes W, Lammertsma AA, et al. Effects of rigid and non-rigid image registration on test-retest variability of quantitative [18 F]FDG PET/CT studies. EJNMMI Res. 2012;2:10. 26. Chicklore S, Goh V, Siddique M, Roy A, Marsden PK, Cook GJ. Quantifying
tumour heterogeneity in 18 F-FDG PET/CT imaging by texture analysis. Eur J Nucl Med Mol Imaging. 2013;40:133–40.
27. Yip S, McCall K, Aristophanous M, Chen AB, Aerts HJ, Berbeco R. Comparison of texture features derived from static and respiratory-gated PET Images in non-small cell lung cancer. PLoS One. 2014;9:e115510.
Submit your manuscript to a
journal and benefi t from:
7Convenient online submission
7Rigorous peer review
7Immediate publication on acceptance
7Open access: articles freely available online
7High visibility within the fi eld
7Retaining the copyright to your article
Submit your next manuscript at 7 springeropen.com