R E S E A R C H
Open Access
Temporal and spatial evaluation of the
River Nile water quality between Qena and
Sohag Cities, Egypt
Ahmed A. Elnazer
1, Alaa Mostafa
2, Salman A. Salman
1*, Elmontser M. Seleem
2and Ahmed Gab-Allah Al-Gamal
3Abstract
Background:The River Nile became under stress in the last decades from the different human (anthropogenic) activities. The present work dealt with the River Nile water quality from Qena to Sohag districts, Egypt. Sixty water samples were collected during 2016 winter and summer and subjected to chemical analysis according to standard methods.
Results:The results indicated temporal and spatial variations in the chemical content of the collected water samples. The samples showed higher concentrations of Ca, Cl, Cd, Cu, Pb, Cr, and Zn during summer than winter, owing to intensive human activities during summer such as navigation and agricultural and industrial activities. The samples enriched with pH, TDS, Mg, Na, K, HCO3, SO4, and NO3during winter, due to the small water column and slow flow-rate.
Conclusion:The studied samples in winter and summer were unsuitable for drinking due to the recorded unacceptable concentrations of As, Cd, Cr, and Pb in the studied samples. The presence of As, Cd, Cr, and Pb may impact water consumer health because the used coagulation procedures in drinking water stations are not effective in the removal of these metals. The River Nile water is suitable for irrigation, except for some samples, which contain elevated
concentrations of As and Cr. Finally, the River Nile protection laws must be strictly applied by national and international authorities to save its water quality.
Keywords:River Nile, Heavy metals, Drinking water, Irrigation water, Pollution, Spatial, Temporal, Evaluation, Egypt
Background
The River Nile is the main source of fresh water in Egypt. However, it has been reported that Egypt is one of the first 10 countries that will be suffering from water scarcity by the year 2025, due to the rapid population growth (Lawson 2011). The River Nile passes through 10 countries and gets its water from three Tributaries; the Blue Nile (68%), Atbara (22%) and the White Nile (10%) (Garzanti et al. 2015). The White Nile drains Archaean–Proterozoic rocks of the Congo Craton and extends through Precambrian rocks of the Saharan Metacraton (Abdelsalam et al.2002). The Blue Nile and Atbara, together with its tributary the Tekeze, are sourced in the Ethiopian Highlands, where they drain the flood basalts (Garzanti et al.2015).
One of the major environmental hazards worldwide is the pollution of water resources with heavy metals (HMs). HMs are present naturally in river water with very low concentrations safe for aquatic biota and come mainly from the weathering of rocks and soils. Meanwhile, the high concentrations come from the anthropogenic sources as domestic and industrial wastewater effluents and urban runoff (Reza and Singh2010). The pollution of the aquatic environment with these metals can be poisonous and even killed the fish (Zeitoun and Mehana,2014).
Human activities produce a huge amount of wastewater that can reach water bodies causing the deterioration of water quality and hence causing adverse human health im-pact (Melegy et al. 2014; Mohanta and Goel 2014). The River Nile receives a huge amount (≈549 × 106m3year−1) of industrial effluents (El-Sheekh2009). These effluents are loaded with different pollutant types, which can adversely impact the River Nile quality. The area contains many pol-lution point sources as agricultural drains, agro-industries, metallurgical (Aluminum) industries, navigation, and * Correspondence:[email protected]
1Geological Sciences Department, National Research Centre, POB: 12622, 33
El Bohouth St. (former El Tahrir St.)- Dokki, Giza, Egypt
Full list of author information is available at the end of the article
drinking water network washing station. Several authors (Ali et al., 2011; Melegy et al. 2014; Zaki et al. 2015, and Abu El Ella et al.,2017) pointed out the adverse impact of sugarcane industries on the River Nile water quality. Ipeaiyeda et al. (2012) concluded that the smelting activities in aluminum production led to the pollution of Essene Creek, Imo and Utaewa Rivers.
In the study area, coal is used in smelters that repre-sent a major source of environmental pollution with HMs. On the other hand, the natural sources of pollu-tion are the drains of the watersheds in the upstream and the Eastern Desert rocks during the seasonal flash floods. Also, the study area contains huge canal/drain networks. These networks facilitate the dispersal of pollutants into the river. The irrigation system in this region is by surface irrigation; therefore, the excess water containing these organic and/or inorganic chemical compounds migrates to the drains by infiltration or seepage. The aims of this work were the determination of the River Nile water quality and spatial as well as tem-poral variation in its inorganic chemical contents be-tween Qena and Sohag districts.
Methods
Water samples were collected from 30 sampling points along the River Nile Trunk along a distance of about 150 km from Qena to Sohag districts (Fig.1) in 1-L plas-tic bottles for physicochemical tests during winter 2016. The same sites were sampled again during summer 2016. A well-constrained Global Positioning System (GPS) was used for navigation to locate the sampling sites accurately. The samples were transferred to the Geological Sciences Department, National Research Centre (NRC), for analyses. The temperature, pH, and total dissolved solids (TDS) were determined in situ with digital HANNA pH meter (HI 991300), which was
calibrated prior to taking readings. In the laboratory, the samples were filtered and analyzed for chemical constit-uents by using standard procedures of APHA (1995). Calcium, magnesium, carbonate, bicarbonate and chlor-ide were analyzed by volumetric methods. Sodium and potassium were determined by flame photometer. Ni-trate and sulphate were determined by using HANNA Spectrophotometer instrument (model HI 83215). HMs were determined by using the atomic absorption spec-troscopy (Perkin Elmer 400). The suitability of water for irrigation was determined by calculating the sodium ab-sorption ratio (SAR) according to Richards (1954) equa-tion (All values in meq/l):
SAR¼Naþ= Ca2þþMg2þ=2½
Results
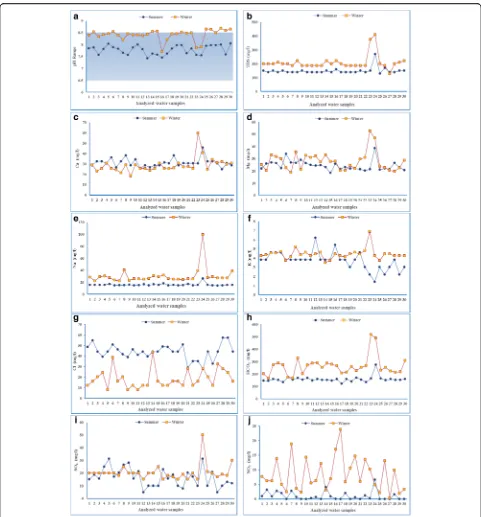
The measured parameters’ descriptive statistics of the River Nile water for both winter and summer seasons are illustrated in Tables 1 and 2 and Figs. 2 and 3. Carbonate was not detected in the studied samples. Nearly all the collected samples contain acceptable levels of water major characteristics (Table1) for drinking and irrigation purposes. It was observed that water samples contain higher concentrations of the studied parameters (except Ca and Cl) during winter over than summer. On contrary, samples collected during summer contained higher concentrations of Pb, Cr, Cu, Cd, As, and Zn than the samples collected during the winter season (Table2).
Discussion
Water chemical characteristics
The recorded slightly alkaline pH is preferable in waters for the removal of heavy metals by precipitation as car-bonate or bicarcar-bonate (Ahipathy and Puttaiah2006). The pH was relatively high in winter, because the water stays longer in contact with bottom sediment owing to the low flow rate and shallow water column. With respect to TDS, the water samples are considered good potable water with values < 500 ppm. A higher level of TDS during the winter season can be attributed to untreated agricultural and domestic wastes discharged into the river, as well as water longer contact with bottom sediment. Samples (23) and (24) were collected near agricultural drains while the sample (26) at Gerga Sugar factory. The water longer contact with bottom sediment was the main reason in the elevated concentrations of Mg, Na, K, HCO3, SO4, and
NO3during winter than summer. The appearance of NO3
in concentrations > 5 ppm is reflecting unsanitary condi-tions (Uqab et al.2017) in the Nile water.
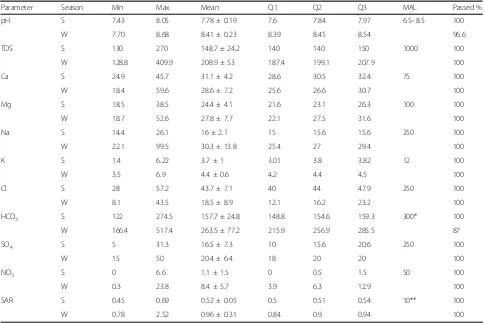
Table 1Descriptive statistics of the measured major characteristics of water sample
Parameter Season Min Max Mean Q1 Q2 Q3 MAL Passed %
pH S 7.43 8.05 7.78 ± 0.19 7.6 7.84 7.97 6.5–8.5 100
W 7.70 8.68 8.41 ± 0.23 8.39 8.45 8.54 96.6
TDS S 130 270 148.7 ± 24.2 140 140 150 1000 100
W 128.8 409.9 208.9 ± 53 187.4 199.1 207.9 100
Ca S 24.9 45.7 31.1 ± 4.2 28.6 30.5 32.4 75 100
W 18.4 59.6 28.6 ± 7.2 25.6 26.6 30.7 100
Mg S 18.5 38.5 24.4 ± 4.1 21.6 23.1 26.3 100 100
W 18.7 52.6 27.8 ± 7.7 22.1 27.5 31.6 100
Na S 14.4 26.1 16 ± 2.1 15 15.6 15.6 250 100
W 22.1 99.5 30.3 ± 13.8 25.4 27 29.4 100
K S 1.4 6.22 3.7 ± 1 3.01 3.8 3.82 12 100
W 3.5 6.9 4.4 ± 0.6 4.2 4.4 4.5 100
Cl S 28 57.2 43.7 ± 7.1 40 44 47.9 250 100
W 8.1 43.5 18.5 ± 8.9 12.1 16.2 23.2 100
HCO3 S 122 274.5 157.7 ± 24.8 148.8 154.6 159.3 300* 100
W 166.4 517.4 263.5 ± 77.2 215.9 256.9 285.5 87
SO4 S 5 31.3 16.5 ± 7.3 10 15.6 20.6 250 100
W 15 50 20.4 ± 6.4 18 20 20 100
NO3 S 0 6.6 1.1 ± 1.5 0 0.5 1.5 50 100
W 0.3 23.8 8.4 ± 5.7 3.9 6.3 12.9 100
SAR S 0.45 0.69 0.52 ± 0.05 0.5 0.51 0.54 10** 100
W 0.78 2.52 0.96 ± 0.31 0.84 0.9 0.94 100
Wwinter,Ssummer,Minminimum,MaxMaximum,MALmaximum allowable concentration for drinking (WHO2011)
Q1: 1st quartile (25% of samples); Q2: 2nd quartile (50% of samples); Q3: 3rd quartile (75% of samples). Passed %: the percent of samples acceptable for drinking *HCO3acceptable value (in Zidi et al.2017)
**SAR acceptable value (after Richards1954)
Table 2Descriptive statistics of the measured heavy metals (μg/l) in comparison with drinking and irrigation standards
Parameter Season Min Max Mean Q1 Q2 Q3 MAL1 Pass1% MAL2 Pass2%
Pb W 163 202 183 ± 9.4 175 182 189 10 0 5000 100
S 193 402 287.9 ± 57.3 239 289.5 332 0 100
Cr W 1.7 62.9 23.1 ± 13.8 15.3 19.6 30.6 50 93.3 100 100
S 63 467 288.2 ± 97 224.8 307.0 349 0 3.3
Cu W bdl 110 31.7 ± 34.1 0 25.0 50 2000 100 200 100
S bdl 170 40.7 ± 54.6 0 0 70 100 100
Cd W bdl 4 2.0 ± 1.1 1.3 2.0 3 3 93.3 10 100
S 1 5 3.1 ± 1.0 2.3 3.0 4 70 100
As W bdl 3086 322.6 ± 698.3 0 0 228 10 63.3 100 70
S bdl 2380 375.4 ± 653.6 0 0 356 63.3 66.7
Zn W 50 280 136.3 ± 48.4 102.5 130.0 160 3000 100 2000 100
S 60 700 218 ± 149.5 140 170.0 220 100 100
bdlbelow detection limit,MAL1maximum allowable concentration for drinking,Pass1%the percent of samples acceptable for drinking,MAL2maximum allowable
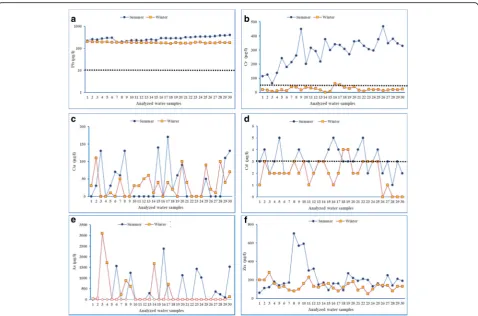
concentration during the winter season compared to the summer season (Fig.3a) may result from the human ac-tivities during summer such as navigation, traffic, waste-water effluents, and urban runoff. The spill of fuel and traffic exhaust can produce a considerable concentration of Pb (Elnazer et al.2015). The Pb was detected as a pol-lutant for the River Nile from several decades, where 24μg/l was recorded in 1987 (Lasheen1987) and about
and sewage effluents discharge to the water courses con-tributed to the Cd load in this season.
Arsenic was detected only in about 36.7% of the stud-ied samples. These results support the anthropogenic source of As in the study area water. The highest con-centrations were recorded in Qena city (samples 8, 9, and 10), in agricultural drains (samples 14, 24, and 30), and at navigation sites (samples 4 and 20). The increase of As during summer than winter (Fig.3e) might be due to the high and intensive activities during summer than winter such as navigation. The marked variation in As concentrations proposed intermixed sources in the study area including, to great extent, the role of human activ-ities and to a limited extent the role of the natural process, especially the occasionally storms, which carry considerable amounts of sediments from the Eastern Desert mountains, where some rocks in the Eastern Des-ert contain up to 75 mg/kg of As (Sadek et al.2015).
The mostly affected metal with seasonal variation was Cr; its concentration (Table 2) during summer (288.2μg/l) was 12 times its concentration during winter (23.1 μg/l). The observed higher concentration of Cr during summer was mainly carried from the Ethiopian lands with water as a result of the dissolution of ferro-magnesian minerals by rains in the Ethiopian mafic/
ultramafic rocks (Omer, 1996). Copper was not detect-able in > 50% of the samples collected during summer and 30% of the samples collected during winter. The re-ports show that sites with a low concentration of Cu had high Ca levels (Suresh 2008); this is supported by the negative correlation between Ca and Cu during the current study (Fig. 4) as a result of ion-exchange. The absence of Cu from about 50% of the studied samples during summer could be attributed to the high flow rate and volume of water, which led to the low interaction between sediments and water.
Fig. 3Spatial and temporal variation inaPb,bCr,cCu,dCd,eAs, andfZn concentrations (dashed line = allowable limits according to WHO 2011)
The recorded low concentrations of Zn can be attrib-uted to its absorbance by bottom sediment (Singh2005, Kabata-Pendias and Mukherjee 2007). The higher Zn concentration in summer than winter (Fig.4f) might re-sult from the small water column and slow flow-rate during winter, where Zn is mainly absorbed on the min-eral grains. Also, lower pH values during summer than winter enhance the solubility of Zn (Singh 2005). Other sources of Zn into aquatic ecosystems include urban runoff, fertilizers, and municipal sewage (Kabata-Pendias and Mukherjee2007, Damodharan 2013). Generally, the variation in the concentrations of the studied elements from site to another is mostly related to human activities (industrial, agricultural, urban runoff, traffic, etc.), which differentiate from location to another and also from win-ter to summer.
Evaluation of water for drinking
The results indicated the suitability of water for drinking purposes with respect to pH, TDS, Ca, Mg, Na, HCO3,
SO4, Cl, NO3, Cu, and Zn was within the permissible
limits of WHO (2011) during the two seasons (Tables1 and 2). Also, most of the studied samples contain ac-ceptable levels of As (19 samples in winter and 19 sam-ples in summer), Cd (28 samsam-ples in winter and 21 samples in summer), and Cr (28 samples in winter). On the other hand, the water samples contained unaccept-able concentrations Pb (during winter and summer) and Cr (during summer).
The presence of the unacceptable concentrations of some metals in the River Nile water might cause health problems, because in Egypt, there are two types of water treatment plants (conventional and compact). The main step in the two types is the use of alum as a coagulant (Donia 2007). Unfortunately, the use of alum as coagu-lant had led to the appearance of high Al (the major component value in alum) concentrations in the domes-tic tap water (DWAF1996). The presence of Al in water may cause Alzheimer’s disease and carcinogenic effects. In addition, the percentage removal of the metals from raw water samples increased with mg/l dosage of coagu-lant. The efficiency of removal for As, Cd, Cr, Cu, Mn, Ni, and Zn was 3.7, 5.88, 85.42, 4.63, and 47.37%, re-spectively, at 10 mg/l dose of Al2(SO4)3 (Fatoki and
Ogunfowokan 2002). This indicates that till after treat-ment process toxic levels of metals may reach the end consumers of water causing many health problems. Therefore, more attention should be given to the pres-ence and sources of these elements in drinking water by the governmental authorities.
Evaluation of water for irrigation
All the samples collected during this study had TDS < 500 ppm and considered excellent for irrigation without
any detrimental effect according to Richards (1954). Also, all the samples collected during this study had SAR < 10 (Table1) and can be used safely for all types of soil based on Richards (1954) classification of SAR. In addition, the studied water samples contain acceptable concentrations of the studied metals, except the recorded As (during win-ter and summer) and Cr (during summer only) in com-parison with NAS-NAE (1972) allowable levels of HMs.
Conclusion
The River Nile water is fresh water with TDS < 500 ppm, with acceptable concentrations of the different ions. The main problem comes from the pollution of water mainly with Pb and to some extents with Cd, Cr, and As. The increased human activities during summer season had led to the increase of Ca, Cl, Cd, Cu, Pb, Cr, and Zn concentrations than the winter season. On the other hand, the slow flow rate and shallow water column during winter were caused the increase in the concentra-tions of pH, TDS, Mg, Na, K, HCO3, SO4, and NO3.
Acknowledgements
The authors would like to thank the Geological Sciences Dept., National Research Centre, and Geology Dept. Al-Azhar Univ. (Assiut Branch) for their facilitates during this work.
Authors’contributions
All authors contributed equally in all article steps. All authors read and approved the final manuscript.
Ethics approval and consent to participate
Accepted
Consent for publication
Accepted
Competing interests
The authors declare that they have no competing interests.
Publisher’s Note
Springer Nature remains neutral with regard to jurisdictional claims in published maps and institutional affiliations.
Author details
1Geological Sciences Department, National Research Centre, POB: 12622, 33
El Bohouth St. (former El Tahrir St.)- Dokki, Giza, Egypt.2Geology Department, Faculty of Science, Al Azhar University, Assuit Branch, Cairo, Egypt.3Quarries Administration, Sohag, Sohag Governorate, Egypt.
Received: 9 June 2018 Accepted: 8 August 2018
References
Abdelsalam MG, Liégeois JP, Stern RJ (2002) The Saharan Metacraton. J Afr Earth Sci 34:119–136
Abu El Ella EM, Elnazer AA, Salman SA (2017) The effect of human activities on the pollution of water in Southwest Giza area, Egypt. Water Sci Technol Water Supply 17(5):1368–1376
Ahipathy MV, Puttaiah ET (2006) Ecological characteristics of Vrishabhavathy River in Bangalore (INDIA). Environ Geol 49(8):1217–1222
Ali SM, Sabae SZ, Fayez M, Monib M, Hegazi NA (2011) The influence of agro-industrial effluents on River Nile pollution. J Adv Res 2:85–95
Damodharan U (2013) Bioaccumulation of heavy metal in contaminated river Water - Uppanar, Cuddalore South East coast of India. In: Dar IA (ed) Perspectives in Water Pollution. IntechOpen, pp 23–34 doi.org/10.5772/53374 Donia N. Survey of Potable Water Quality Problems in Egypt. The 11thIntern. Water
Tech. Conf., 15–18 March, IWTC11 Sharm El-Sheikh, Egypt, 2007: 1049–1058 DWAF (1996) South Africa water quality guidelines for domestic uses (2ndedn.).
Department of Water Affairs and Forestry, Pretoria
Elnazer AA, Salman SA, Seleem EM, Abu El Ella EM (2015) Assessment of some heavy metals pollution and bioavailability in roadside soil of Alexandria-Marsa Matruh highway, Egypt. Intern. J. Ecol Article ID 689420:7.https://doi. org/10.1155/2015/689420
El-Sheekh M (2009) River Nile pollutants and their effect on life forms and water quality. In: Dumont HJ (ed) The Nile: origin, environments, limnology and human use. Series: Monographiae Biologicae 89. Springer, Dordrecht, pp 395–406 Fatoki OS, Ogunfowokan AO (2002) Effect of coagulant treatment on the metal
composition of raw water. Water SA 28(3):293–297
Garzanti E, Ando S, Padoan M, Vezzoli G, El Kammar A (2015) The modern Nile sediment system: processes and products. Quaternary Sci Rev 130:9–56 Goher ME, Farhat HI, Abdo MH, Salem SG (2014) Metal pollution assessment in
the surface sediment of Lake Nasser, Egypt. Egypt J Aquat Res 40:213–224 Ipeaiyeda AR, Umo NS, Okojevoh GE (2012) Environmental pollution induced by an
aluminium smelting plant in Nigeria. Global J Sci Frontier Res Chem 12(1):59–71 Kabata-Pendias A, Mukherjee AB (2007) Trace elements from soil to human.
Springer Berlin Heidelberg New York, p 550
Lasheen R (1987) The distribution of trace metals in Aswan High Dam Reservoir and River Nile ecosystem. In: Hutchinson TC, Means KM (eds) Lead, mercury, cadmium and arsenic in the environment, SCOPE. John wily and ltd, pp 235–354 Lawson EO (2011) Physico-chemical parameters and heavy metal contents of
water from the mangrove swamps of Lagos Lagoon, Lagos, Nigeria. Adv Biolo Res 5:8–21
Melegy AA, Shaban AM, Hassaan MM, Salman SA (2014) Geochemical mobilization of some heavy metals in water resources and their impact on human health in Sohag governorate, Egypt. Arab J of Geosci 7:4541–4552 Mohanta T, Goel S (2014) Assessment of water quality of three different aquatic
environments over three seasons. 1st Inter. Congress Environ., Biotechnology Chemistry Eng. IPCBEE 64(10):49–53
NAS-NAE (National Academy of Science and National Academy of Engineering) (1972) Water quality criteria. Report prepared by committee of water quality on request of U.S. Environmental Protection Agency, Washington, D.C., USA, p 594 Omer AAM. Geological, mineralogical and geochemical studies on the Neogene and Quaternary Nile basin deposits, Qena- Assiut stretch, Egypt. Ph.D. Thesis, Geol. Dept., Fac. Sci., South Valley Univ 1996
Reza R, Singh G (2010) Heavy metal contamination and it indexing approach for river water. Inter J Environ Sci Tech 7:785–792
Richards LA (1954) Diagnosis and improvement of saline and alkali soils, USDA Agric. Handb. 60. USDA, Washington, DC
Sadek MF, Ali-Bik MW, Hassan SM (2015) Late Neoproterozoic basement rocks of Kadabora-Suwayqat area, Central Eastern Desert, Egypt: geochemical and remote sensing characterization. Arab J Geosci 8:10459–10479 Singh VP (2005) Toxic metals and environmental issues. Sarup and Sons, New
Delhi, p 362
Suresh CR (2008) Monitoring metal containing particulates distribution on college campus using dandelion (Taraxacum offinale) leaves as receptors, M. Sc. Thesis, the faculty of the Department of Chemistry, East Tennessee State University, p 125
Toufeek MEF (2011) Distribution of cadmium and lead in Aswan Reservoir and River Nile water at Aswan. World App Sci J 13(2):369–375
Uqab B, Singh A, Mudasir S (2017) Impact of sewage on physico-chemical water quality of Tawi River in Jammu city. Environ. Risk Assess Remediat 1(2):56–61 WHO (World Health Organization) (2011) Guideline for drinking water quality.
Recommendations, 4th edn. World Health Organization, Geneva Zaki R, Ismail EA, Mohamed WS, Ali AK (2015) Impact of surface water and
groundwater pollutions on irrigated soil, El Minia Province, Northern Upper Egypt. J Water Reso Protec 7:1467–1472
Zeitoun MM, Mehana EE (2014) Impact of water pollution with heavy metals on fish health: overview and updates. Global Veterinaria 12(2):219–231 Zidi C, Jamrah A, Issai L (2017) Assessment of groundwater quality in