Journal of Environmental Management 87 (2008) 364–372
Matrix based fertilizers reduce nitrogen and phosphorus leaching
in three soils
James A. Entry
, R.E. Sojka
USDA Agricultural Research Service, Northwest Irrigation and Soils Research Laboratory, 3793 North 3600 East, Kimberly, ID 83443, USA
Received 14 April 2006; received in revised form 27 October 2006; accepted 16 January 2007 Available online 26 June 2007
Abstract
We compared the efficacy of matrix based fertilizers (MBFs) formulated to reduce NO
3, NH
þ
4, and total phosphorus (TP) leaching, with Osmocoates 14-14-14, a conventional commercial slow release fertilizer (SRF) and an unamended control in three different soil
textures in a greenhouse column study. The MBFs covered a range of inorganic N and P in compounds that are relatively loosely bound (MBF 1) to more moderately bound (MBF 2) and more tightly bound compounds (MBF 3) mixed with Al(SO4)3H2O and/or Fe2(SO4)3
and with high ionic exchange compounds starch, chitosan and lignin. When N and P are released, the chemicals containing these nutrients in the MBF bind N and P to a Al(SO4)3H2O and/or Fe2(SO4)3starch–chitosan–lignin matrix. One milligram (8000 spores) of
Glomus intradiceswas added to all formulations to enhance nutrient uptake. In all three soil textures the SRF leachate contained a higher amount of NHþ
4, NO
3 and TP than leachate from all other fertilizers. In all three soils there were no consistent differences in the amount of NHþ
4, NO
3 and TP in the MBF leachates compared to the control leachate. Plants growing in soils receiving SRF had greater shoot, root and total biomass than all MBFs regardless of Al(SO4)3H2O or Fe2(SO4)3additions. Arbuscular mycorrhizal infection in plant roots
did not consistently differ among plants growing in soil receiving SRF, MBFs and control treatments. Although the MBFs resulted in less plant growth in this experiment they may be applied to soils growing plants in areas that are at high risk for nutrient leaching to surface waters.
r2007 Elsevier Ltd. All rights reserved.
Keywords:Starch; Chitosan; Lignin; Mycorrhizae; Aluminum sulfate; Iron sulfate
1. Introduction
Nitrogen (N) and phosphorus (P) are the two soil nutrients that most often limit plant growth. When N and P fertilizers are added to the soil overall N and P use efficiency is low because only the soluble fraction of these
nutrients can be taken up by plants (Vassilev and Vassileva,
2003). Land managers and home owners commonly apply
soluble forms of N and P as inorganic fertilizers in quantities greater than plants can assimilate, leading to leaching and often surface and ground water
contamina-tion (Vitousek et al., 1997; David and Gentry, 2000;
Edwards et al., 2000; Sharpley et al., 2000).
Transport of P from agricultural soils to surface waters has been linked to eutrophication in fresh water and
estuaries (Bush and Austin, 2001; Broesch et al., 2001;
Daniel et al., 1998). Nitrogen and P accumulation in fresh or brackish water can overstimulate the growth of algae creating conditions that interfere with the health and diversity of indigenous plant and animal populations (Tveite, 1994; Pohle et al., 1991). Nonpoint N sources were responsible for more than 90% of N inputs to more than half of the 86 rivers studied in United States. Nonpoint P sources contributed over 90% of the P in a third of these rivers. Along the coastline of the North Atlantic Ocean nonpoint sources of N are some 9-fold greater than inputs from wastewater treatment plants (Bricker et al., 1999). Eutrophication is also widespread and rapidly expanding in most temperate lake, stream and coastal ecosystems. The incidence of harmful algal blooms
has dramatically increased in recent years (Bricker et al.,
www.elsevier.com/locate/jenvman
0301-4797/$ - see front matterr2007 Elsevier Ltd. All rights reserved. doi:10.1016/j.jenvman.2007.01.044
Corresponding author. Tel.: +1 208 423 6553; fax: +1 334 423 6555.
E-mail addresses:jentry@kimberly.ars.pn.usbr.gov (J.A. Entry),
1999). This increase is linked to eutrophication and other factors, such as changes in food webs that may increase decomposition and nutrient recycling or reduce popula-tions of algae-grazing fish.
Fertilizer regimens could greatly benefit from more effective time release technologies that can better protect surface and ground water. We developed matrix based
fertilizers (MBFs) that may reduce NH4, NO3and total P
(TP) leaching. The MBFs cover a range of inorganic N and P in compounds that are relatively loosely bound (MBF 1) to more moderately bound (MBF 2) and more tightly
bound compounds (MBF 3) mixed with Al(SO4)3H2O
and/or Fe2(SO4)3 and with the high ionic exchange
compounds starch, chitosan and lignin. We addedGlomus
interadicies, a species of arbuscular mycorrhizal fungal spores that will form mycorrhizae in high nutrient environments, in the MBF formulations to increase plant nutrient uptake. Our objective was to determine if MBFs combined with arbuscular mycorrhizae would reduce N and P leaching compared to a slow release fertilizer (SRF) in sand, sandy loam and loam textured soils in a green-house column study.
2. Materials and methods
2.1. Fertilizer treatments
The MBF formulations in our study cover a range of common inorganic nutrient compounds combined with
Al(SO4)3H2O and/or Fe2(SO4)3. Starch, chitosan and lignin
were chosen because of their high concentration of ionic exchange sites and their decomposition characteristics.
Nutrients bound to the Al(SO4)3H2O and/or Fe2(SO4)3
starch–chitosan–lignin matrix become increasingly avail-able to plants as the organic components in the matrix
degrade. The organic components in the matrix should
degrade starch4chitosan4lignin in the order of more to
less rapid. The matrix based formulations can be made to bind inorganic nutrients relatively loosely (MBF 1) to more tightly (MBF 3) by increasing the concentration of
Al(SO4)3H2O and/or Fe2(SO4)3 and by varying the
amounts of starch, chitosan and lignin in the matrix. When the matrix is applied to soil the soil microorganisms will degrade the starch in the matrix comparatively rapidly while chitosan will degrade less rapidly. Lignin is expected degrade the slowest and should retain most of its ionic exchange sites for a longer time in most soil environments. The MBF formulations are comprised of inorganic chemicals combined with starch, chitosan and lignin (Sigma, St. Louis, MO). Treatment 1 was a control; no
fertilizer was applied to the columns (Table 1). Treatment 2
was 5.0 g of the Osmocotes
(14-14-14) SRF which was
equal to 345mg N and 344mg P per column and
167:7 kg N ha1and 166:9 kg N ha1(Table 1). Osmocotes
(14-14-14) has a 3–4 month nutrient release pattern at
70C. Treatment 3 was MBF 1 which received 313:0mg N
and 164:0mg P per column and was equal to 152 kg N ha1
and 80 kg P ha1. Treatment 4 was MBF 2 which received
249mg N and 181mg P per column and was equal to
121 kg N ha1 and 88 kg P ha1. Treatment 5 was MBF 3
which received 60mg N and 294mg P per column and was
equal to 29 kg N ha1 and 143 kg P ha1. We added
treatments 6–8 to determine the effect of Al(SO4)3H2O
and Fe2(SO4)3 on N and P leaching in the columns.
Treatment 6 was MBF 3þAlFe which MBF 3 was
placed over 0.488 g Al(SO4)3H2O without Fe2(SO4)3.
MBF 3þAlFe received 60:0mg N and 294:0mg P per
column and was equal to 29 kg N ha1 and 143 kg P ha1.
Treatment 7 was MBF 3AlþFe placed over 1.600 g
Fe2(SO4)3 without Al(SO4)3H2O. MBF 3AlþFe
Table 1
Chemical compounds used to comprise three different matrix based fertilizers in mg N and P in each columna
Treatment 1 2 3 4 5 6 7 8
Compound CONT SRF MBF 1 MBF 2 MBF 3 MBF 3 MBF 3 MBF 3
þAlFe AlþFe AlþFe
NH4NO3 0.000 0.210 0.000 0.000 0.000 0.000 0.000 0.000
P2O5 0.000 0.200 0.000 0.000 0.000 0.000 0.000 0.000
K2O 0.000 0.180 0.180 0.180 0.180 0.180 0.180 0.180
Ca(NO3)24H2O 0.000 0.000 0.472 0.472 0.236 0.236 0.236 0.236
Al(NO3)39H2O 0.000 0.000 0.750 0.750 0.000 0.000 0.000 0.000
NH4(H2PO4) 0.000 0.000 0.230 0.230 0.115 0.115 0.115 0.115
Ca(H2PO4)2 0.000 0.000 0.468 0.468 0.234 0.234 0.234 0.234
Fe(P2O7) 0.000 0.000 0.334 0.334 1.490 1.490 1.490 1.490
Al(PO4)3 0.000 0.000 0.360 0.360 0.000 0.000 0.000 0.000
Al(SO4)3H2O 0.000 0.000 0.488 0.366 0.000 0.488 0.000 0.000
Fe2(SO4)3 0.000 0.000 0.400 0.800 1.600 0.000 1.600 0.000
Starch 0.000 0.000 1.000 1.000 1.000 1.000 1.000 1.000
Chitosan 0.000 0.000 1.000 1.000 1.000 1.000 1.000 1.000
Lignin 0.000 0.000 1.000 1.000 1.000 1.000 1.000 1.000
a(mg compound in each column) MBF 1 is matrix based fertilizer formulation 1
¼152 kg N ha1and 80 kg P ha1; MBF 2 is matrix based fertilizer
formulation 2¼121 kg N ha1and 88 kg P ha1; MBF 3 is matrix based fertilizer formulation 3
¼29 kg N ha1and 143 kg P ha1. SRF
received 60:0mg N and 294:0mg P per column and was
equal to 29 kg N ha1 and 143 kg P ha1. Treatment 8 was
MBF 3AlFe MBF 3AlþFe which was MBF 3
without Al(SO4)3H2O or Fe2(SO4)3which received 60:0mg
N and 294:0mg P per column and was equal to 29 kg N ha1
and 143 kg P ha1. We added the 8000 spores of
G. interadicies in 1.00 ml of reverse osmosis water to all MBF treatments (per column) to increase plant nutrient uptake.
2.2. Column description
A 2.0 mm wire screen was cut into squares ð125
125 mmÞ and secured to the bottom of each
10:0 cm diameter30 cm long polyvinyl chloride cylinder
(Fig. 1). A 14 cm diameter funnel was placed below each column in the rack and secured. Three kilograms of soil were placed in each column (columns were filled to 25 cm) leaving a 5 cm space at the top of each column. Soil in columns was loosely packed and then repeatedly washed with reverse osmosis water to flush nutrients that could be loosely held to soil particles. Columns were allowed to
drain for 1 h prior to the start of leachate collection as described below.
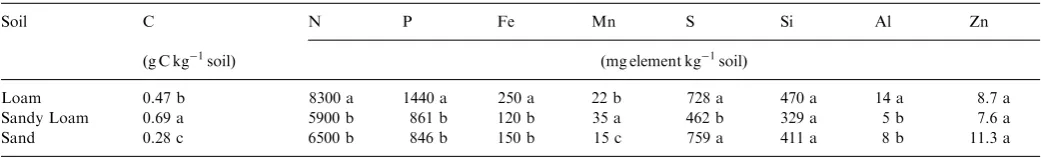
2.3. Soil descriptions
Soils having three different textures were used to determine the effectiveness of the fertilizers to reduce leaching over a range of soil types. The Brown’s Creek soil was a loam and was classified as a fine, montmorillonitic, mesic Xerollic Haplargid. The Simco soil was a coarse-loamy sand and classified as a mixed non-acid, mesic Xeric Torriorthents. The Kuna soil is a sandy loam and classified
as a mixed, mesic lithic Xerollic Camborthids (Collett,
1982). Soil physical and microbiological properties are
presented in Entry et al. (2002, 2004). Soil chemical
concentrations are presented inTable 2.
2.4. Experimental design
The experiment was arranged in a completely
rando-mized design (Kirk, 1982) with eight fertilizer treatments
three soil textures with three replications. There were a
total of 72 columns and 360 leachate measurements. Plants were given 100 ml reverse osmosis water each day for 16
weeks. Samples were measured for NH4, NO3, and TP in
leachate at 21, 42, 63, 84 and 112 days.
2.5. Fertilizer placement and growing conditions
We placed the above stated amounts of Fe2(SO4)3and/or
Al(SO4)3H2O at a depth of 5 cm in columns receiving MBF
treatments 6–8. The MBF formulations were placed
directly above the Fe2(SO4)3 and/or Al(SO4)3H2O. The
slow release Osmocotes
14-14-14 fertilizer not receiving
additional Fe2(SO4)3and/or Al(SO4)3H2O was mixed into
the top 5 cm of soil. We then placed 0.5 g of white soft
spring wheat (Triticum aestivumL.cv. Frame) seed on top
of each column. Seeds were covered with 0.5 cm of soil. Seeds were watered with 100 ml of water daily to maintain field capacity of the soil. Leachate did not flow through columns when 100 ml water was applied. We collected leachate 21, 42, 63, 84 and 112 days after fertilizer placement (start of the experiment) by giving plants 500 ml reverse osmosis water on the above stated days in lieu of the 100 ml daily reverse osmosis water. On each sampling day approximately 200 ml leachate was collected
from each column. Subsamples were analyzed for NO
3 and
NHþ
4 and TP as described below. Throughout the
experiment plants were exposed to light having a
photo-synthetic active radiation of 400–700mmol m2S1 and a
14–16 h photoperiod.
2.6. Harvesting and arbuscular mycorrhizae assessment
After 112 days, plants were removed from the columns and separated into roots and shoots. Roots were washed in reverse osmosis water until all visible soil particles were removed. Three g of roots were randomly selected from each plant and placed in a solution of 2.5% (w/v) KOH. The roots in the KOH solution were then placed in an autoclave for 5 min and then rinsed in 2% HCl for 24 h. Roots were then placed in 0.05% (w/v) trypan blue in
acidic glycerol for 24 h (Koske and Gemma, 1989). Roots
were observed for hyphal colonization under a 200
microscope by the cross hair intersection method (
McGo-nigle et al., 1990). Approximately 100 intersections were scored and used to determine percent of root length infected. Root tissue excluding roots examined for
mycor-rhizal infection and shoot tissue was dried at 80C for 48 h
and weighed for shoot and root biomass.
2.7. Chemical analysis
Nitrate and NHþ4 were determined using a Lachat
Automated Ion Analyzer (Quickchem 8000 Systems,
Milwaukee, WI) using the method as described by
Green-berg et al. (1992). Total P in leachate was determined by digesting 25 ml aliquots in an autoclave at 103.5 kPa and
121C for 60 min with 4.0 ml acidified ammonium
persul-fate (Greenberg et al., 1992). Three soil samples from each
soil type were dried at 651C for 72 h and passed through a
2 mm sieve. Total C was estimated by dry ashing at 5251C
and assuming C equal to 50% of loss on ignition (Nelson
and Sommers, 1996). Total N was determined using
standard microkjeldahl procedures modified for NO3
(Bremmner, 1996). A 2 g subsample of soil was extracted
with 10 ml 1 N ammonium acetate (Sims, 1989) and
analyzed for Mn, Fe, Al, Si, S and Zn were determined using inductively coupled plasma emission spectrometry (ICP). At harvest, plant root and shoot material were weighed then ground to pass a 1 mm mesh. A 0.50 g subsample was analyzed for total N with a LECO CHN-600 nitrogen analyzer (St. Joseph, Michigan). A 0.25 g
subsample was ashed at 5001C, dissolved in 25 ml of 1.0 M
HCl, brought to 50 ml volume with reverse osmosis water and analyzed for P, K, Ca, Mg, Mn, Fe, Cu, B and Zn using a inductively coupled plasma emission spectrometer (Perkin-Elmer, Boston, MA).
2.8. Statistical analysis
Nitrate, NHþ
4 and TP values were tested for normal
distribution. Data were then analyzed using general linear models (GLM) procedures for a completely random design
with Statistical Analysis Systems (SAS Institute Inc., 1996).
In all analyses, residuals were equally distributed with constant variances. Differences reported throughout are
significant at pp0:05, as determined by the least-squares
means test.
3. Results
The GLM of leached nutrients for soil type
fertilizerssample day, soil typefertilizers, and soil
Table 2
Extractable nutrient concentration in a loam, sand, and loamy sand soilsa
Soil C N P Fe Mn S Si Al Zn
ðg C kg1soilÞ ðmg element kg1soilÞ
Loam 0.47 b 8300 a 1440 a 250 a 22 b 728 a 470 a 14 a 8.7 a
Sandy Loam 0.69 a 5900 b 861 b 120 b 35 a 462 b 329 a 5 b 7.6 a
Sand 0.28 c 6500 b 846 b 150 b 15 c 759 a 411 a 8 b 11.3 a
a
typesample day were not significant, therefore,
statis-tical comparisons of NHþ
4, NO
3 and total P are presented
for fertilizer treatments because GLM showed these
interactions were significant at pp0:05 (Snedecor and
Cochran, 1980).
After 112 days, SRF leachate contained a greater
amount of NHþ4, NO3 and TP than leachate from all
other fertilizers (Figs. 2–4). In all three soils, MBFs
reduced NHþ4 in leachate by a minimum of 50%, NO3
leachate by a minimum of 46% and TP in leachate by a minimum of 200%. In all three soils there were no
consistent differences in the amount of NHþ4 NO3 and
TP in the MBF leachates than in the control leachate. Plants growing in soils receiving SRF had greater head weight, shoot, root and total biomass than all fertilizer
formulations (Table 3). All fertilizer formulations and SRF
plants had greater head weight, shoot, root and total biomass than plants growing in soils receiving no fertilizer (control). Arbuscular mycorrhazal infection in plant roots did not consistently differ among plants growing in soil receiving SRF and all MBF formulations and plants growing in soils receiving no fertilizer (control). Plants growing in the loam soil receiving SRF treatment had greater shoot and root N concentrations than all MBF formulations except for the MBF 1 shoot N concentration. Plants growing in the sand and sandy loam soils receiving SRF treatment had greater shoot N concentrations than all
0 50 100 150 200 250
NO
3
(µg)
CTRL SRF MBF1 MBF2 MBF3 MBF3 +Al-Fe
MBF3-Al+Fe
MBF3 -Al-Fe Fertilizer Type
a
bc b
c
b b
bc bc
Fig. 3. Total amount of NO3leached from soil columns growing wheat over 112 days. Treatment 1 was a control; no fertilizer applied to the column (CONT). Treatment 2 was a slow release fertilizer (SRF). Treatment 3 was matrix based fertilizer formulation 1 (MBF 1). Treatment 4 was matrix based fertilizer formulation 2 (MBF 2). Treatment 5 was matrix based fertilizer formulation 3 (MBF 3). Treatment 6 was matrix based fertilizer 3 without Al(SO4)3H2O and without Fe2(SO4)3 (MBF 3þAlFe). Treatment 7 was matrix based fertilizer formulation 3 with 0.488 g Al(SO4)3H2O and without Fe2(SO4)3 (MBF 3Alþ
Fe). Treatment 8 was matrix based fertilizer formulation 3 without Al(SO4)3H2O and Fe2(SO4)3(MBF 3AlFe). Bars having same letter are not significantly different as determined by the least-square means test
ðpp0:05Þ;n¼360.
0 10 20 30 40 50 60
TP (µg)
CTRL SRF MBF1 MBF2 MBF3 MBF3 +Al-Fe
MBF3 -Al+Fe
MBF3 -Al-Fe Fertilizer Type
a
b b
b b b b b
Fig. 4. Total amount of total phosphorus (TP) leached from soil columns growing wheat over 112 days. Treatment 1 was a control; no fertilizer applied to the column (CONT). Treatment 2 was a slow release fertilizer (SRF). Treatment 3 was matrix based fertilizer formulation 1 (MBF 1). Treatment 4 was matrix based fertilizer formulation 2 (MBF 2). Treatment 5 was matrix based fertilizer formulation 3 (MBF 3). Treatment 6 was matrix based fertilizer 3 without Al(SO4)3H2O and without Fe2(SO4)3 (MBF 3þAlFe). Treatment 7 was matrix based fertilizer formulation 3 with 0.488 g Al(SO4)3H2O and without Fe2(SO4)3 (MBF 3Alþ
Fe). Treatment 8 was matrix based fertilizer formulation 3 without Al(SO4)3H2O and Fe2(SO4)3(MBF 3AlFe). Bars having same letter are not significantly different as determined by the least square means test
ðpp0:05Þ;n¼360.
0 1 2 3 4 5 6 7
NH
4 (
µ
g)
CTRL SRF MBF1 MBF2 MBF3 MBF3
+Al-FeMBF3 -Al+FeMBF3 -Al-Fe Fertilizer Type
a
bc
c
c bc
c c
b
Fig. 2. Total amount of NH4leached from soil columns growing wheat over 112 days. Treatment 1 was a control; no fertilizer applied to the column (CONT). Treatment 2 was a slow release fertilizer (SRF). Treatment 3 was matrix based fertilizer formulation 1 (MBF 1). Treatment 4 was matrix based fertilizer formulation 2 (MBF 2). Treatment 5 was matrix based fertilizer formulation 3 (MBF 3). Treatment 6 was matrix based fertilizer 3 without Al(SO4)3H2O and without Fe2(SO4)3 (MBF 3þAlFe). Treatment 7 was matrix based fertilizer formulation 3 with 0.488 g Al(SO4)3H2O and without Fe2(SO4)3 (MBF 3Alþ
Fe). Treatment 8 was matrix based fertilizer formulation 3 without Al(SO4)3H2O and Fe2(SO4)3(MBF 3AlFe). Bars having same letter are not significantly different as determined by the least-square means test
MBF formulations. Plants growing in soils receiving SRF had greater shoot P content than all MBF formulations. All fertilizer and SRF plants had greater shoot P content than plants growing in soils receiving no fertilizer (control). The concentration of K, Ca, Mg, Mn, Fe, Cu, B and Zn in
root and shoot tissue did not differ ðpp0:05Þ among
treatments (data not shown) (Fig. 5,Table 2).
4. Discussion
We found that 70–86% of the NHþ
4, 75–84% of the NO
3 and 84% of the total P was leached from the soil columns
in the first 63 days after the Osmocotes
(14-14-14) SRF was applied (data not shown). Plants growing in soils receiving SRF had greater plant biomass (growth) shoot and root N and P content than all MBF formulations
regardless of Al(SO4)3H2O or Fe2(SO4)3additions. Plants
growing in soils receiving SRF had 15–55% greater plant biomass than those growing in MBF formulations 112 days after application. The growth rate of plants in soils receiving SRF was greater than those growing in soil receiving MBF formulations in the 112 day time period, presumably because in soils receiving SRF, the nutrients were more available to the plant. Shoot biomass, shoot N and P, and head weight were greater in plants given SRF than the MBF formulations. The MBF formulations contained more N and P than the SRF, but a significant
amount of the nutrients were bound to the Al(SO4)3H2O,
or Fe2(SO4)3, starch, chitosan and lignin exchange matrix
and more slowly available to plants. A small fraction of N and P is probably immobilized in the matrix and only available to plants over months or years. Future studies should include a fertilizer rate study to determine the amount of the MBFs that can be applied to soils to increase plant growth equal to plant growth obtained by
0 5 10 15 20 25 30
Plant Biomass (g)
CTRL SRF MBF1 MBF2 MBF3 MBF3 +Al
MBF3 +Fe
MBF2 -Al
Fertilizer Type a
b b
c
b b
b b
-Al
Fig. 5. Total amount of plant biomass from soil columns growing wheat over 112 days.
Table 3
Wheat height, biomass, and head weight after 112 days growth in a loam, sand, and loamy sand soil in greenhouse conditionsa,b
Soil Treatment Height Head weight
Shoot biomass
Root biomass
Plant biomass
Mycorrhizal infection
Shoot N Shoot P Root N Root P
(cm) (g) (g) (g) (g) (arbuscules/mm) ðmg kg1Þ
Loam Control (no fertilizer) 44.0 c 6.5 c 11.5 d 12.7 c 24.2 c 3.7 b 8300 b 168.2 c 5333 b 3553 c SRF 49.0 b 17.2 a 26.9 a 29.5 a 56.4 a 40.9 a 16060 a 732.6 a 7833 a 8567 a MBF 1 57.9 a 12.6 b 21.8 b 24.0 b 40.0 b 20.6 a 10700 ab 278.2 b 5200 b 4123 bc MBF 2 57.6 a 12.6 b 21.0 b 23.1 b 44.2 b 27.7 a 8300 b 304.6 b 4300 b 3806 bc MBF 3 56.8 a 9.7 b 16.4 c 18.1 b 34.5 b 13.0 ab 7333 b 235.9 b 3933 b 4367 b MBF 3þAlFe 54.3 a 9.4 b 16.2 c 17.8 b 33.9 b 15.6 ab 7633 b 282.7 b 4800 b 5373 b MBF 3AlþFe 50.4 a 8.6 b 15.0 c 16.5 b 31.5 b 43.3 a 8467 b 221.0 b 4000 b 4123 bc MBF 2AlFe 55.9 a 11.7 b 19.2 bc 21.1 b 34.2 b 19.6 ab 8530 b 276.6 b 4333 b 4553 b
Sand Control (no fertilizer) 24.8 b 0.8 c 1.7 c 1.9 c 3.6 c 16.9 a 5900 c 14.6 c 4800 b 3563 c SRF 51.9 a 17.3 a 28.0 a 30.9 a 58.9 a 20.3 a 13733 a 614.0 a 7800 a 6073 ab MBF 1 50.3 a 7.7 b 15.4 b 16.9 b 38.8 b 8.0 ab 8666 b 134.7 b 5800 b 6226 ab MBF 2 51.7 a 8.9 b 15.9 b 17.5 b 33.4 b 21.0 a 7566 b 197.4 b 4900 b 4280 b MBF 3 47.6 a 6.0 b 10.1 b 12.1 b 23.1 b 28.3 a 7033 b 153.7 b 4566 b 4120 bc MBF 3þAlFe 51.4 a 6.4 b 11.7 b 12.8 b 24.5 b 6.1 b 7433 b 193.8 b 4200 b 5617 b MBF 3AlþFe 47.1 a 6.9 b 12.4 b 13.7 b 26.1 b 5.1 b 7100 b 151.6 b 4833 b 3687 b MBF 2AlFe 52.7 a 8.6 b 16.3 b 17.9 b 34.2 b 20.9 a 7666 b 180.2 b 4500 b 3390 b
Sandy Control (no fertilizer) 39.5 b 2.8 c 5.9 c 6.4 c 12.4 c 26.3 a 6466 c 47.2 c 5400 b 3300 c Loam SRF 48.0 a 18.1 a 28.7 a 31.6 a 60.3 a 24.1 a 15833 a 586.9 a 7400 a 5806 a MBF 1 56.9 a 10.6 b 20.0 b 22.0 b 41.9 b 35.2 a 7166 b 194.8 b 5100 b 3912 bc MBF 2 54.0 a 10.3 b 18.4 b 20.3 b 38.7 b 15.4 a 8300 b 257.8 b 4066 b 5247 b MBF 3 53.0 a 9.6 b 17.8 b 19.5 b 37.3 b 17.6 a 7600 b 210.7 b 4133 b 4346 b MBF 3þAlFe 52.0 a 9.1 b 16.5 b 18.1 b 34.6 b 24.3 a 9500 b 191.6 b 3900 b 5246 b MBF 3AlþFe 50.9 a 8.7 b 16.3 b 17.9 b 34.2 b 29.6 a 9833 b 161.2 b 4800 b 5183 b MBF 2AlFe 50.1 a 8.9 b 16.2 b 17.8 b 34.0 b 26.3 a 7566 b 182.5 b 4133 b 4057 b
aIn each column and soil, values followed by the same letter are not significantly different as determined by the least-square means test
ðpp0:05;n¼9Þ. bMBF 1 is matrix based fertilizer formulation 1
¼152 kg N ha1and 80 kg P ha1; MBF 2 is matrix based fertilizer formulation 2¼121 kg N ha1and
88 kg P ha1; MBF 3 is matrix based fertilizer formulation 3
fertilization with the SRF while still reducing N and P leaching.
Direct losses of P from fertilizer leaching or runoff usually result when fertilizer application is coincident with
heavy rain events (Haygarth and Jarvis, 1999). We found
84% of the total P was leached from these columns in the first 43 days after treatments commenced. Our results imply that, even if the SRFs available on the market today were applied at rates to meet crop or turf P nutrition over a growing season and plants grew at their maximum potential, it would be difficult for them to take up a sufficient amount of fertilizer P to prevent leaching. Therefore, even if agricultural and turfgrass operators were to apply nutrients in amounts anticipated to meet plant requirements over the growing season, substantial amounts of N and P could be leached. The problem is made more severe because some turfgrass operators and homeowners often apply nutrients in quantities exceeding
plant requirements (Hart et al., 2003). Several studies
indicated that sediment bound P concentrations in runoff generally increase as soil P concentrations increase (Sharpley et al., 1993; Pote et al., 1999; Cox and Hendricks,
2000). Long-term overfertilization of soils is recognized as
potentially contributing to eutrophication of surface waters (Sims, 1993; Frossard et al., 2000).
Conventional fertilizers formulations such as single
super phosphate (SSP), monoammonium phosphate
(MAP) and diammonium phosphate (DAP) were devel-oped with the goal of minimizing the production costs per unit of soluble P. The study of SSP, MAP and DAP modification to reduce susceptibility to P runoff and
leaching has been limited (Hart et al., 2003). SRFs have
been employed to reduce direct fertilizer runoff losses. Nutrient leaching from SRFs is reduced through degrada-tion of an organic or inorganic coating around a core of
inorganic fertilizer. Quin et al. (2003) describe coating a
DAP with a slurry of elemental sulfur which provides a short-term barrier to water. Field trials demonstrated an approximately 40% reduction of P runoff during the first
runoff event after application.Nash et al. (2003)conducted
laboratory dissolution studies comparing SSP and a dry sulfur-coated superphosphate, in which sulfate of ammonia was the binding agent. The authors found that the water-extractable P was greater from the coated superphosphate fertilizer treatments (6.6%) compared to 4.8% from superphosphate treatments. The rapid dissolution of the S-coated superphosphate resulted from the rapid solubili-zation of the sulfate of ammonia in the extraction procedure, and with it removal of the sulfur coat and protection against P dissolution in the granules (Hart et al., 2004).
Commercial SRFs can be classified into two basic groups: low solubility and polymer coated water soluble fertilizers (Blaylock et al., 2005). The polymer coated SRFs are water soluble and can exhibit consistent nutrient release rates. However, average soil temperature and moisture need to be known. The fertilizers are characterized by one
or more polymeric resins surrounding the fertilizer. The duration of nutrient release is controlled by the porosity of the resin coating. A more porous coating results in quicker release. When polymer coated SRFs are applied to the soil, the water in the soil enters the fertilizer granule through micropores which dissolves the nutrients. Nutrients are then steadily released through the pores. The rates of nutrient release of polymer coated SRFs are influenced by soil temperature, the higher the soil temperature, the
greater the release rate (Blaylock et al., 2005). Release rate
is hypothesized to be not significantly influenced by microbiological decomposition, soil moisture, soil type or pH. However, all polymers eventually degrade in soil (Basfar et al., 2003; Bonhomme et al., 2003; Lehmann et al., 2000, 1998) and the degradation rate influences nutrient release from the polymer.
The MBF formulations in our study cover a range of common inorganic nutrient compounds combined with
Al(SO4)3H2O and/or Fe2(SO4)3 and the high ionic
ex-change compounds starch, chitosan and lignin. These
formulations allow nutrients to bind with the Al(SO4)3H2O
and/or Fe2(SO4)3–lignin–chitosan matrix substantially
reducing leaching (Entry and Sojka, 2007). Nutrient
ions having become bound to the Al(SO4)3H2O and/or
Fe2(SO4)3–lignin–chitosan matrix will slowly become
available to most plants over several growing seasons. These matrix based formulations cover a range of inorganic N and P in compounds that are relatively loosely bound (MBF 1) to more moderately bound (MBF 2) and more tightly bound compounds (MBF 3) mixed with
Al(SO4)3H2O and/or Fe2(SO4)3 and with the high ionic
exchange compounds starch, chitosan and lignin. When N and P are released from the chemicals containing these
nutrients the MBFs likely bind N and P to a Al(SO4)3H2O
and/or Fe2(SO4)3starch–chitosan–lignin matrix. After the
starch–chitosan–lignin matrix with Al(SO4)3H2O and/or
Fe2(SO4)3 is applied to soil the soil microorganisms will
degrade the starch in the matrix comparatively rapidly and will create some ionic exchange sites. The chitosan will degrade less rapidly than starch but more rapidly than lignin and is expected to retain most of its ionic exchange sites for at least one year in most soil environments. The lignin component in the matrix will degrade more slowly than starch and chitosan and is expected to retain its ionic exchange sites for several years in most soil environments. Nutrient availability and leaching is expected to be controlled to a large degree by varying the relative amounts
of starch–chitosan–lignin matrix with Al(SO4)3H2O and/or
Fe2(SO4)3in the mixture. The MBFs bind nutrients to the
Al(SO4)3H2O and/or Fe2(SO4)3 starch–chitosan–lignin
matrix and application rates are based on the amount of nutrients released to meet plant growth, therefore their application rates will necessarily not be comparable to conventional or SRFs, which release nutrients based on the amount of nutrient applied.
with or without Al(SO4)3H2O and/or Fe2(SO4)3. Mycor-rhizal colonization was assessed at the termination of the experiment when roots were growing throughout the soil.
The mycorrhizal associations withG. interadiciesprobably
formed in the first few weeks of the experiment and subsequently, as roots grew and suberized, the
coloniza-tions at that location in the root diminished.G. interadicies
is an arbuscular mycorrhizal fungi species that will form associations with a broad range of host plants in soils containing high concentrations of nitrogen and
phos-phorus.G. interadicieswas added to the matrix to enhance
plant uptake of N and P.
The impact of MBF to reduce N and P leaching in the field may not be readily apparent in most cases, especially in agricultural soils. Fertilization on the same soils for years will result in N and P sorption on clay and organic
matter ionic exchange sites (D’Angelo, 2005; McDowell et
al., 2005; Bird et al., 2002, 2003; Devevre and Horwath,
2001). Fertilizer N and P will also have become
incorpo-rated into organic matter complexes which will result in these nutrients being released as organic matter is
decom-posed (Bird et al., 2003, 2002; Entry and Emmingham,
1995) . The efficacy of MBF to reduce N and P input to
surface and ground water should be more apparent on highly leached sandy soils than soils containing high concentrations of silt, clay or organic matter. The use of 15
N and31P labeled chemical components in MBF may be
the most accurate method to determine the quantities of these nutrients leached from the fertilizer in most soils.
5. Conclusions
These new fertilizer formulations do not depend on organic or inorganic coatings to reduce N and P leaching and with further testing and development could be more effective than commercial fertilizers. Although further greenhouse and field testing are called for, results of this initial investigation are promising. Cost estimates of these
MBF has been calculated to be $0.03–0:08 kg1 above the
cost of conventional fertilizers. One of the main goals of future research should be to reduce the cost of MBF production. MBFs initially may be economically feasible for use by homeowners on their lawns, turfgrass operators such as golf course managers and growers of high value agricultural crops. The MBF formulations could prove important in soils whose water flow drains into nutrient-affected waters such as Chesapeake Bay, Florida Ever-glades and rivers flowing into the Great Lakes.
As nutrients are applied to a soil they can accumulate to the maximum retention capacity of the soil, which is controlled by soil physical and chemical properties, the resident biota and the rate of nutrient uptake by vegeta-tion. Continual excessive application of any fertilizer eventually will load soil beyond its maximum retention capacity. Nutrients added to the soil above that limit via any mode of application (e.g. natural and anthropogenic aerial deposition, application of fertilizer) eventually can be
released to water flowing over and/or through the soil. Improved technology cannot substitute fully for adhering to sound land management practices. In the long-term N and P contamination of water can be prevented only by applying nutrients in quantities relative to the inherent capacity of the soil to retain nutrients and the quantities removed via harvest. However, new MBF formulations that release nutrients at a rate comparable to plant uptake can reduce nutrient leaching and ultimately eutrophication.
References
Basfar, A.A., Idriss Ali, K.M., Mofti, S.M., 2003. UV stability and radiation-crosslinking on linear low density polyethylene and low density polyethylene for greenhouse applications. Polymer Degrada-tion and Stability 82, 229–234.
Bird, J.A., van Kessel, C., Horwath, W.R., 2002. Nitrogen dynamics in humic fractions under alternative straw management in temperate rice. Soil Science Society of America Journal 66, 478–488.
Bird, J.A., van Kessel, C., Horwath, W.R., 2003. Stabilization of13 C-carbon and immobilization of15N-nitrogen from rice straw in humic fractions. Soil Science Society of America Journal 67, 806–816. Blaylock, A.D., Kaufmann, J., Dowbenko, R.D., 2005. Nitrogen
fertilizers technologies. Western Nutritional Management 6, 8–13. Bonhomme, S., Cuer, A., Delort, A.-M., Lemaire, J., Sancelme, M., Scott,
G., 2003. Environmental degradation of polyethylene. Polymer Degradation and Stability 81, 441–452.
Bremmner, H.M., 1996. Nitrogen-total. In: Sparks, D.L. (Ed.), Methods of Soil Analysis, Part 3: Chemical Methods. American Society of Agronomy, Madison, WI, pp. 1085–1122.
Bricker, S.B., Clement, C.G., Pirhalla, D.E., Orlando, S.P., Farrow, D.R.G., 1999. National estuarine eutrophication assessment: effects of nutrient enrichment in the nations estuaries. NOAA, National Ocean Service, Special Projects Office and the Centers for Coastal Ocean Science, Silver Spring, MD, 71pp.
Broesch, D.F., Brinsfield, R.B., Magnien, R.E., 2001. Chesapeake Bay eutrophication: scientific understanding, ecosystem restoration and challenges for agriculture. Journal of Environment Quality 30, 303–320.
Bush, B.J., Austin, N.R., 2001. Timing of phosphorus fertilizer applica-tion within an irrigaapplica-tion cycle of perennial pasture. Journal of Environmental Quality 30, 939–946.
Collett, R.A. 1982. Soil Survey of Ada County. U.S. Department of Agriculture, Natural Resources Conservation Service, U.S. Govern-ment Printing Office, Washington, DC.
Cox, F.R., Hendricks, S.E., 2000. Soil test phosphorus and clay content effects on runoff water quality. Journal of Environmental Quality 29, 1582–1586.
D’Angelo, E.M., 2005. Phosphorus sorption capacity and exchange by soils from mitigated and late successional bottomland forest wetlands. Wetlands 25, 297–305.
Daniel, T.C., Sharpley, A.N., Lemunyon, J.L., 1998. Agricultural phosphorus and eutrophication: a symposium overview. Journal of Environmental Quality 27, 257–271.
David, M.B., Gentry, L.E., 2000. Anthropogenic inputs of Nitrogen and phosphorus and riverine export for Illinois, USA. Journal of Environmental Quality 29, 494–508.
Devevre, O.C., Horwath, W.R., 2001. Stabilization of fertilizer nitrogen-15 into humic substances in aerobic vs. waterlogged soil following straw incorporation. Soil Science Society of America Journal 65, 499–510.
Entry, J.A., Emmingham, W.H., 1995. Influence of forest age on nutrient availability and storage in coniferous soils of the Oregon Coast Range. Canadian Journal of Forest Research 25, 114–120.
Entry, J.A., Sojka, R.E, Shewmaker, G., 2002. Management of irrigated agriculture to increase carbon storage in soils. Soil Science Society of America Journal 66, 1957–1964.
Entry, J.A., Sojka, R.E., 2007. Matrix based fertilizes with arbuscular mycorrhizae reduce nitrogen and phosphorus leaching in greenhouse column studies. Water, Air and Soil Pollution 180, 283–292. Entry, J.A., Fuhrmann, J.F., Sojka, R.E., Shewmaker, G.A., 2004.
Influence of irrigated agriculture on soil carbon and microbial community structure. Environmental Management 33 (Suppl. 1), S363–S373.
Frossard, E., Condron, L.M., Oberson, A., Sinaj, S., Fardeau, J.C., 2000. Processes governing phosphorus availability in temperate soils. Journal of Environmental Quality 29, 15–23.
Greenberg, A.F., Clescerl, L.S., Eaton, A.D. (Eds.), 1992. Standard Methods for the Examination of Water and Wastewater. 18th ed. American Public Health Association, Washington, DC, 2005. Hart, M.R., Quin, B.F., Nguyen, M.L., 2003. Phosphorus runoff from
agricultural land and direct fertilizer effects. Journal of Environmental Quality 33, 1954–1972.
Haygarth, P.M., Jarvis, S.C., 1999. Transfer of phosphorus from agricultural soils. Advances in Agronomy 66, 19–249.
Kirk, R.E., 1982. Experimental Design: Procedures for the Behavioral Sciences, second ed. Brooks Cole Publishing Co, Belmont, CA. Koske, R.E., Gemma, J.N., 1989. A modified staining procedure for
staining roots to detect V—A mycorrhizae. Mycological Research 92, 486–488.
Lehmann, R.G., Miller, J.R., Xu, S., Singh, U.B., Reece, C.F., 1998. Degradation of silicone polymer at different soil moistures. Environ-mental Science Technology 32, 1260–1264.
Lehmann, R.G., Miller, J.R., Kozerski, G.E., 2000. Degradation of silicon polymer in field soil under natural conditions. Chemosphere 41, 743–749.
McDowell, R.W., Condron, L.M., Stewart, I., Cave, V., 2005. Chemical nature and diversity of phosphorus in New Zealand pasture soils using 31P nuclear magnetic resonance spectroscopy and sequential fractiona-tion. Nutrient Cycling in Agroecosystems 72, 241–254.
McGonigle, T.P., Miller, M.H., Evans, D.G., Fairchild, G.L., Swan, J.A., 1990. A new method which gives an objective measure of colonization of roots by vesicular arbuscular mycorrhizal fungi. New Phytologist 115, 495–501.
Nash, D., Hannah, M., Clemow, L., Halliwell, D., Webb, B., Chapman, D., 2003. A laboratory study of phosphorus mobilization from
commercial fertilizers. Australian Journal of Soil Research 41, 1201–1212.
Nelson, D.W., Sommers, L.E., 1996. Total carbon, organic carbon and organic matter. In: Bigham, J.M. (Ed.), Methods of Soil Analysis, Part 3: Chemical and Microbiological Properties. ASA, CSSA, SAAJ, Madison, WI, pp. 961–1010.
Pohle, D.G., Bricelj, V.M., Garcia-Esquivel, G., 1991. The eelgrass canopy, Sn above bottom refuge from benthic predators for juvenile bay scallops Argopectn irradens. Marine Ecology Progress Series 74, 47–59.
Pote, D.H., Daniel, T.C., Nichols, D.J., Sharpley, A.N., Moore Jr., P.A., Miller, D.M., Edwards, D.R., 1999. Relationship between phosphorus levels in three ultisols and phosphorus concentrations in runoff. Journal of Environmental Quality 28, 170–175.
Quin, B.F., Braithwaite, A., Nguyen, L., Blennerhassett, J., Watson, C.J., 2003. The modification of commodity P and N fertilisers to reduce nutrient loss to the environment. In: Currie, L.D., Hanly, J.A. (Eds.), Tools for Nutrient and Pollutant Management: Applications to Agriculture and Environmental Quality. Occasional Report 17. Fertilizer and Lime Research Centre, Massey University, Palmerston North, New Zealand, pp. 115–121.
SAS Institute Inc., 1996. SAS User’s Guide: Statistics—Version 6.03 Edition. Statistical Analysis System (SAS) Institute Inc., Cary, NC. Sims, J.T., 1989. Comparison of Mehlich 1 and Mehlich 3 techniques for
extractants for P, K, Ca, Mg, Mn, Cu and Zn in Atlantic coastal soils. Communications in Soil Science and Plant Analysis 20, 1707–1726. Sims, J.T., 1993. Environmental soil testing for phosphorus. Journal of
Production Agriculture 6, 501–507.
Snedecor, W.G., Cochran, W.G., 1980. Statistical methods, seventh ed. Iowa State University Press, Ames, Iowa.
Sharpley, A.N., Daniel, T.C., Edwards, D.R., 1993. Phosphorus move-ment in the landscape. Journal of Production Agriculture 6, 492–500. Sharpley, A.N., Foy, B., Withers, P., 2000. Practical and innovative measures for the control of agricultural phosphorus losses to water: an overview. Journal of Environmental Quality 29, 1–9.
Tveite, S., 1994. 0-group cod investigations on the Norwegian Skagerrak coast. In: Dhal, E. (Ed.), The Propagation of CodGadus morhuaL. Institute of Marine Research, Bergen, Norway, pp. 581–590. Vassilev, N., Vassileva, M., 2003. Biotechnical solubilization of rock
phosphate on media containing agro-industrial wastes. Applied Microbiology and Biotechnology 61, 435–440.