ORIGINAL ARTICLE
Methods to Evaluate and Measure Power
of Pneumatic System and Their Applications
Yan Shi
1,2, Maolin Cai
1, Weiqing Xu
1*and Yixuan Wang
1Abstract
Pneumatic system has been widely used throughout industry, and it consumes more than billions kW h of electric-ity one year all over the world. So as to improve the efficiency of pneumatic system, its power evaluation as well as measurement methods should be proposed, and their applicability should be validated. In this paper, firstly, power evaluation and measurement methods of pneumatic system were introduced for the first time. Secondly, based on the proposed methods, power distributions in pneumatic system was analyzed. Thirdly, through the analysis on pneumatic efficiencies of typical compressors and pneumatic components, the applicability of the proposed meth-ods were validated. It can be concluded that, first of all, the proposed methmeth-ods to evaluation and measurement the power of pneumatic system were efficient. Furthermore, the pneumatic power efficiencies of pneumatic system in the air production and cleaning procedure are respectively about 35%–75% and 85%–90%. Moreover, the pneumatic power efficiencies of pneumatic system in the transmission and consumption procedures are about 70%–85% and 10%–35%. And the total pneumatic power efficiency of pneumatic system is about 2%–20%, which varies largely with the system configuration. This paper provides a method to analyze and measure the power of pneumatic system, lay a foundation for the optimization and energy-saving design of pneumatic system.
Keywords: Pneumatic system, Compressed air, Energy assessment, Measurement, Power evaluation
© The Author(s) 2019. This article is distributed under the terms of the Creative Commons Attribution 4.0 International License (http://creat iveco mmons .org/licen ses/by/4.0/), which permits unrestricted use, distribution, and reproduction in any medium, provided you give appropriate credit to the original author(s) and the source, provide a link to the Creative Commons license, and indicate if changes were made.
1 Introduction
In pneumatic system, power is transmitted and con-trolled through compressed air within a circuit. Due to its advantages, such as the low price of its components, easy maintenance of the system, pneumatic system has been widely used throughout industries [1–3]. And now, pneumatic system has become a main energy consump-tion system all over the world [4, 5].
Energy consumption in Europe of pneumatic system accounts for probably 10% of total industrial power con-sumption [6]. The energy consumption of pneumatic system in the United States is about 9% of the whole elec-tricity consumption [7]. What is more, in China, pneu-matic system consumes about 9% of the whole electricity consumption, up to 320 billion kW·h in 2009 [8].
However, the efficiency of pneumatic system is very limited as a result of improper use, poor management and low efficiency of pneumatic components, about 30% [9, 10]. To increase the efficiency of pneumatic systems as well as the implied components, the methods to evalu-ate and measure the power of compressed air should be established.
Nowadays, the air volume or its rate of flow is applied to represent the air consumption [11]. But, the amount of power which is lost in supply lines or provided to actua-tors cannot be clarified, and that is considered extremely important for energy savings. Furthermore, fluid power in hydraulics can be expressed by multiplying the pres-sure of gauge as well as the volumetric flow rate of the fluid [12–14]. However, due to the compressibility of air, fluid power is unfeasible for compressed air [9].
Therefore, to evaluate the energy consumption as well as the loss of pneumatic system, and optimize the design of pneumatic components, it is necessary to propose methods to evaluate and measure power of pneumatic system.
Open Access
*Correspondence: [email protected]
1 School of Automation Science and Electrical Engineering, Beihang University, Beijing 100191, China
Through more than ten years’ research [15], we have proposed methods to evaluate and measure the power of pneumatic system. The proposed methods have been employed to analyze the energy loss in different pneu-matic system and components [16–18], and several energy-saving system and components have been devel-oped [19–21]. What is more, dimensionless optimiza-tions on the pneumatic system are also carried on [22, 23].
Wang has studied the optimization method of the pneumatic system in a hybrid power vehicle [24], he also tried the same optimizing method in the efficiency study of engine [25], and finally he summarized a frontier tech-nology in the energy-saving techtech-nology. In addition, the dimensionless methods have been also applied in the researches of pneumatic system in Wang’s works [26, 27], and the principle of efficiency calculating has great refer-ence value.
Moreover, the proposed methods have been proposed to international standard organization as a new work item proposal.
In this paper, firstly, the methods to evaluate and meas-ure the power of pneumatic system were introduced. Sec-ondly, the test installation and method were proposed. Furthermore, an application case of the proposed evalu-ation and measurement methods was introduced, and power distributions in pneumatic system were illustrated.
This research can be referred in efficiency measure-ment, analysis and the optimization of pneumatic system and components.
2 Definitions and Symbols
The methods to evaluate and measure the power of pneu-matic system, which can be used to analyze pneupneu-matic system energy distribution, and guide the appliers to take the reasonable energy-saving technologies to promote the efficiency of pneumatic system as well as pneumatic components.
2.1 Definitions
In this paper, the terms and definitions given in GB/T 17446 are adopted.
(1) Available Pneumatic Energy E
Potential of compressed air to output mechani-cal work at the atmospheric state because it goes through a reversible process from a given state to an atmospheric state since all the pneumatic systems and equipment are working at the atmospheric state. Energy conversion in pneumatic system, ideal
for compressed air production and consumption are given in authors’ previous work [6].
(2) Pneumatic Transmission Energy Et
Addresses the energy used to push the air down-stream, which is the energy transmitted from the upstream to the downstream. This energy is not included in the internal energy of air.
(3) Pneumatic Expansion Energy Ee
Addresses the maximum energy extracted to do mechanical work under atmospheric conditions by means of air expansion. This energy is included in the internal energy of air.
(4) Pneumatic Power P
Pneumatic power P is defined as the flow of aerody-namic available energy that can be extracted from flowing air. The definition, character and appli-cation of cases of pneumatic power are given in authors’ previous work [8].
(5) Pneumatic Transmission Power Pt and Pneumatic Expansion Power Pe
Pneumatic transmission power Pt means the flow of pneumatic transmission energy which is able to be extracted from the flowing air.
Pneumatic expansion power Pe is treated as the flow of pneumatic expansion energy which is extracted from the flowing air.
2.2 Symbols and Units
The symbols and units used throughout this paper are shown in Table 1.
The numerals used as subscripts and the asterisk (*) used as a superscript to the symbols listed in Table 1 are as specified in Table 2.
3 Assessment and Calculation of Pneumatic Energy
3.1 Pneumatic Available Energy
The consumed energy with a volume of air consump-tion and the supplied energy with a volume of air supply should be determined to be pneumatic available energy of the consumed air or the supplied air. As given in authors’ previous work [9], the available aerodynamic energy con-sists of two parts: pneumatic transmission energy and pneumatic expansion energy. They can be calculated as follows by Eqs. (1), (2) and (3).
where (1)
E=Et+Ee=pV
ln p
pa
+ κ
κ−1
T−Ta
Ta
−ln T
Ta
,
(2)
Et=(p−pa)V,
(3)
Ee=pV
ln p
pa + κ
κ−1 T−T
a
Ta
−ln T
Ta
−
1−pa
p
3.2 Pneumatic Power
The consumed power with a consumption of flowing air and the supplied power with a supply of flowing air can be determined to be pneumatic power of consumed air flow or supplied air flow. As given in authors’ previous work [9], pneumatic power consists of pneumatic transmission power and pneumatic expansion power, and thy is able to be gotten as follows by Eqs. (4), (5) and (6).
where
When air temperature and the atmosphere temperature are the same, pneumatic power can be given as:
(4) P=Pt+Pe=pqv
ln p
pa
+ κ
κ−1
T−Ta
Ta
−ln T Ta
,
(5)
Pt=(p−pa)qv,
(6) Pe=pqv
ln p
pa+ κ κ−1
T−Ta
Ta −ln T Ta
−
1−pa
p
.
(7)
P =pqvln p pa . Table 1 Symbols and units
(1) M = mass; L = length; T = time; Θ = temperature
(2) 1 Pa = 1 N/m2
(3)R= 287 J/(kg·K)
(4)κ= 1.4
Description Symbol Dimension(1) Practical units
Pneumatic available energy per unit mass of air e L2T−2 J/kg
Pneumatic available energy E ML2T−2 J
Enthalpy per unit mass of air h L2T−2 J/kg
Pneumatic power P ML−1T−2 W
Air mass m M kg
Absolute pressure (equal to the relative pressure plus the
atmospheric pressure) p ML
−1T−2 Pa(2)
Pressure drop Δp ML−1T−2 Pa
Mass flow-rate qm MT−1 kg/s
Volume flow-rate at standard conditions qv L3T−1 m3/s
Gas constant (for a perfect gas) R(3) L2T−2Θ−1 J/(kg·K)
Entropy per unit mass of air s L2T−2Θ−1 J/(kg·K)
Thermodynamic temperature T Θ K
Velocity u LT−1 m/s
Volume V L3 m3
Mechanical work W ML2T−2 J
Isobaric specific heat cp L2T−2Θ−1 J/(kg·K)
Specific heat ratio κ(4) Dimensionless parameter
Efficiency η Dimensionless parameter
Table 2 Subscripts and superscripts
Superscript Subscript Meaning
* Ideal process
a The atmosphere
e Pneumatic expansion energy or power i Manufacturing process of compressed air o Consumption process of compressed air 1 Import; input
2 Export; output s Air supply
t Pneumatic transmission energy or power k Kinetic power of air
p Isobaric total Total cp Air compressor dy Refrigeration dryer fl Filter
pi Pipeline
lk Leak
3.3 Evaluation Formula of Atmospheric Temperature 3.3.1 Pneumatic Available Power
As given in authors’ previous work [9], pneumatic avail-able power can be obtained by:
3.3.2 Pneumatic Invalid Power
The power which is lost when the air temperature is cooled down till the atmosphere temperature is defined as pneumatic invalid power [9], which can be given by:
3.3.3 Pneumatic Power Factor
In this standard, the ratio of pneumatic available power and pneumatic power is defined as pneumatic power factor [9], and it is calculated as shown of the following equations:
3.4 Kinetic Power
Kinetic power of flowing air is one kind of mechanical power, which belongs to available power. Kinetic power can be converted into pneumatic power, and it is calcu-lated as shown of the following equations:
where Pk is the kinetic power (W), d means diameter of
pipe line (m).
4 Test Installation
Figures 1, 2, and 3 illustrate basic circuits that do not include all the safety devices necessary to prevent dam-age in case of component failure. Because of the safety of personnel and equipment, it is important that those responsible for the testing are responsible.
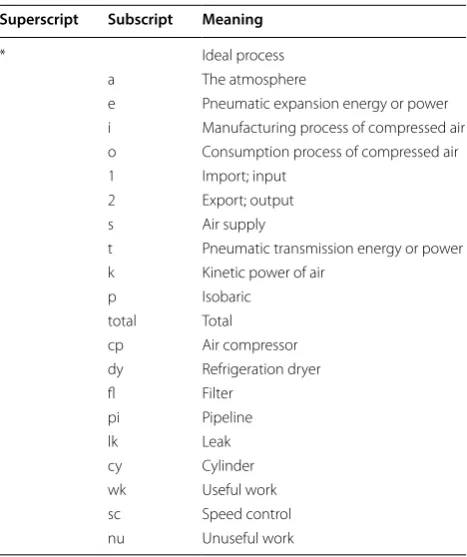
4.1 Test Circuit for Pipe Line Test
If the pneumatic power of air in pipe line is tested, a suit-able test circuit which is shown in Figure 1 should be applied. And Figure 1(a) shall be used especially when flow, temperature and pressure are measured solely. When integrated instrument, which is composed of flow meter, temperature-measuring instrument and pressure gauge or transduce, is adopted, Figure 1(b) shall be used. It should be noted that Table 3 is the key to test circuit components.
(8)
P=paqvaln
p pa
.
(9)
P=pqv
ln p pa
+ κ
κ−1 T−T
a Ta
−lnT Ta
−paqvaln p pa
.
(10) ϕ=1−
Talnpap
T
lnpap + κ κ−1
T
Ta−1−ln T Ta
.
(11) Pk=
8(paqva)3 RT(pπd2)2,
4.2 Test Circuit for In‑Line Test
If the piezometer is connected to both upstream and downstream sides of the element under test, the cor-responding test circuit shall be used as shown in Fig-ure 2. By the way, Table 3 is the key to test circuit components.
4.3 Test Circuit for Exhaust‑to‑Atmosphere Test
If the component under test, which exhausts directly to atmosphere on its downstream side, a suitable test circuit which is shown in Figure 3 shall be applied. By the way, Table 3 is the key to test circuit components.
4.4 General Requirements
The components to be tested shall be installed and oper-ated in the test circuit in accordance with the manufac-turer’s operating instructions. A filter should be installed which provides a standard of filtration specified by the manufacturer of the component under test.
A test circuit shall be constructed from the items listed in Table 3. Items A to N inclusive are required, and the remaining item O shall be chosen in accordance with Section 4.5.
All connections for pressure measurement shall be arranged in such a manner that no entrained liquid can be trapped or retained, and a drain may be provided. All connections for pressure measurement shall be arranged in such a manner that no entrained liquid can be trapped or retained, and a drain may be provided.
a
b
During the test, pressure drop of flow meter should be no more than 30 kPa.
When temperature of the compressed air is lower than the temperature of the atmosphere by 3 °C, temperature-measuring instrument could not be installed.
4.5 Other Requirements
1. If the component under test has ports that are different from those described above in structure or size, con-nectors shall be used for connection with rectifier tubes.
Figure 2 Circuit which is used for exhaust-to-atmosphere test
Figure 3 Test circuit for exhaust-to-atmosphere test
Table 3 Keys of testing the circuit components
Items A to M are essential and the remaining N, O are chosen by the person conducting the test to suit the prevailing conditions
Reference letter Relevant subclause (s) Description Comments
A – Adjustable pressure regulator
B – Shut-off valve Preferably with straight flow path
C – Upstream flow meter
D 6.5 Upstream temperature-measuring tube
E – Upstream temperature-measuring instrument Sensor located on axis of D at distance > 3d upstream of the end of D
F 6.5 Transition connector upstream side G – Upstream pressure gauge or transducer
H – Component under test
I – Downstream gauge meter or transducer
J 6.5 Transition connector downstream side
K – Downstream temperature-measuring instrument L 6.5 Downstream temperature-measuring tube
M – Downstream flow meter
N – Flow control valve With a flow-rate capacity greater
2. When the inlet and outlet ports of the component under test are different from each other in structure or size, rectifier tubes and pressure-measuring con-nectors that suited to the relevant ports shall be used. 3. When the pressure-measuring connector interferes
with the body of component under test or an adja-cent connector, a special pressure-measuring con-nector similar to those shown in Figures 4, 5, 6 of ISO 6358-2 shall be connected to the component under test using a bent tube or similar mechanism, as shown in Figure 4. And Table 3 is the key to test circuit components.
4. All special requirements shall be recorded in the test report.
5 Application of the Methods: Power Distributions in Pneumatic System
Because of the proposal of pneumatic power, it is no longer difficult to calculate efficiency of pneumatic equipment and analyze energy distribution in pneumatic system. Besides, classic pneumatic equipment and components, such as compressor, filter, dryer, pipe line, and cylinder,
etc. can be measured. This part proposes an application of power distribution in a classic pneumatic system.
The typical pneumatic system which is shown in Fig-ure 5 is divided to 4 parts including production, clean, transport and air consume. Next, efficiencies of typical equipment in these 4 parts are discussed respectively. Meanwhile, the methods to analyze the energy losses and efficiencies of typical pneumatic equipment are introduced.
5.1 In Air Production
Common types of compressors are screw type, piston type, vane type and centrifugal type. Compressors are generally driven by electric motors, which are powered by electricity. The efficiency of the electric motor is gen-erally between 80% and 96%. Smaller motors (< 10 kW) are generally less efficient.
For the power supply of compression mechanism, energy loss will be caused by mechanical friction and mixture, air leakage, insufficient cooling and other rea-sons. The total of these losses accounted for the lion’s share of all losses. Typically, these losses account for 20%–40% and are different with compressor type and cooling conditions.
Comprehensive efficiency is an important index to evaluate compressor energy conversion. The overall com-pressor efficiency should be proposed as the following equation:
where the input energy is the total electricity which is supplied to the compressor and the intercooler, and energy output is the output of pneumatic power. The total efficiency as defined above includes the total loss of
(12)
ηcp=(P2/P1)×100%, Figure 4 Connection of component under test to
pressure-measuring connector using a bent tube or similar mechanism
Figure 5 A typical compressed air system
20 30 40 50 60 70 80
1 10 100 1000 10000
Motor power (kW)
The overall efficiency
η
cp
(%
)
Screw, 1-stage Piston, 1-stage Piston, 2-stage Turbo, 1-stage Turbo, 2-stage
the compressor. User evaluation of compressor perfor-mance is a simple and practical index.
Figure 6 shows the data of some typical compressors in the market. As shown in Figure 6, the overall efficiency of compressor is within the range of 35% to 50% when the motor power is less than 10 kW, 40%–60% when motor power is 10–100 kW and 51% to 70% when the motor power is higher than 100 kW.
In ISO 1217—Displacement Compressors Accept-ance Tests, specific energy which is defined as the ratio of required motor power and air output volume, is pre-scribed as an energy performance index. The mini-mum specific energy for compressing air to 0.8 MPa is 0.06 kW·h/m3. In practice, however, only large piston
compressors approach this number. A well-organized installation is more likely to consume 0.08 to 0.12 kW·h/ m3.
In Table 4, it is the picture of actual values for some typical compressors. Considering that the motor power only accounts for 90% of the whole power consumption, then the total efficiency can be calculated. Compared with specific energy, the overall efficiency is necessary condition to evaluate the efficiency of the whole pneu-matic system.
5.2 In Air Cleaning
The commonly used compressor types are screw, piston, vane and centrifugal type. Generally, after produced, the compressed air should be sent to the pipe network before the first air dryer and filter purification.
Refrigeration dryer is applied to cool air to the range of 0 to 10 °C. According to Eq. (7), the aerodynamic power loss through the dryer can also be ignored due to the small internal pressure loss and air leakage. However, power is needed to power the refrigerator and internal cooling fans.
When discussing the efficiency of the entire pneumatic system, this power consumption should be added to the power consumption of the compressor. The following coefficient Kdy is recommended:
where Ė1e is the dryer electricity, Ė2 is output pneumatic
power, ηovr is the whole system efficiency. As is shown in
Table 5, they are actual values of some refrigeration dry-ers in market.
In the pipe network, the commonly used air purifi-cation equipment is a filter. People invented all kinds of filters to remove different kinds of pollutants, such as water, oil, dust and so on. When the compressed air flows through the filter, the power loss is determined by the pressure loss of the filter. In general, the relationship between flow and pressure loss is given in the product catalog. According to this figure, the energy transfer effi-ciency of the filter is as follows:
where ΔPfl refers the pressure loss. Figure 7 shows an
example of a calculation. By computation efficiency of the filter in the market condition of maximum flow rate, concluded that filters the main pipe is always higher than 99%, and a filter performance under 5 μm terminal equipment is about 95%.
5.3 In Air Transmission
In pipeline transmission, pressure loss and air leakage are two factors that cause aerodynamic power loss.
Pressure losses occur at piping and joints. It can be approximately calculated:
However, in an actual investigation, it is hard to deter-mine coefficient K as well as the average velocity ω because in factories the pipe network is complicated and
(13)
Kdy=
1
ηcp·(P1e/P2)+1 ,
(14) ηovr=ηovr·Kdy,
(15)
ηfl= P2
P1
×100%= ln((P1
−�Pfl)/Pa)
ln(P1/Pa)
×100%,
(16)
�Ppp= 1
2Kρω
2.
Table 4 Some typical compressor features
Type Capacity (N·L/s)
(0.8 MPa) Specific energy (kW·h/m3) ηcp (%)
Piston < 20 0.133 39.6
20–200 0.095 55.4
200–2000 0.072 73.1
Vane < 20 0.125 42.1
20–200 0.100 52.7
Screw < 20 0.116 45.4
20–200 0.100 52.7
200–2000 0.092 57.2
Centrifugal 400–1000 0.091 57.9
1000–2000 0.083 63.4
Table 5 Kdy of some refrigeration dryer
Type A B C D
Applicable compressor (kW) 2.2 15 75 370
Assumed ηcp (%) 40 50 50 60
the air flowing state is disordered. The results are com-pared with the theoretical results, and the measurement Suggestions are given. ΔPpp is applied as the measured pressure loss, and the power loss is as follows:
When air is not used, a gradual loss of pressure in the system means there is an air leak. Although the allow-able amount of air leakage in industrial devices should be 5% or less, in factories, the proportion is as high as 10%–40%.
Leaks occur frequently in pipes, hose fittings, valves, fittings, and terminal equipment. There are several ways to check for leaks. When there are no users on the sys-tem, the flow meter in the water supply pipe can be used to check the total leakage of the system. Qlka is given as
the flow rate of leaks, and the power being lost is:
The above discussion gives the calculation method of air transmission power loss. Since these power losses vary greatly with system configuration and operating conditions, it seems impossible to display their general data.
5.4 In Air Consumption
It is well known that most of the compressed air is con-sumed by nozzles and cylinders.
The efficiency and energy distribution of the cylinder are discussed in this paper. For a cycle drive, the energy input can be made up of the following equation:
(17) Ppp=PaQaln
P1
P1−Ppp .
(18) Plk=PaQlkaln
P1 Pa .
(19)
Ecyi=PaValn Ps Pa
,
where Va is air volume consumption of one cycle
actua-tion, and Ps is the supply pressure. Wwk is given as the
mechanical work output, and the efficiency is calculated:
In the meter-out and the meter-in circuit, the velocity controller is used to make the piston speed converge. The speed controller inevitably loses some energy because it restricts the discharge or filling of air in order to keep the air pressure in the cylinder constant. This part of energy can be considered the energy used for velocity control, and represented by Wsc in this paper.
Besides Wwk and Wsc, a mount of supplied energy is
exhausted to atmosphere without any application. Wnu if
given as this part of energy, when there is no internal fric-tion in the cylinder, the piston moves at a constant speed and the air state isothermal changes under the ideal drive of an external circulation of meters, the energy distribu-tion is shown in Figure 8.
Figure 8 shows that about half of the power supply is effectively used for mechanical work and piston speed control. Since the energy consumed by non-use is expan-sion energy, the reuse of expanexpan-sion energy is the key to energy saving of gas cylinders.
For the actual drive, the energy assigned to internal friction, piston acceleration and heat transfer is very small compared with the above three parts. Figure 8 can approximately describe the energy distribution in the actual drive.
5.5 Power Flow in Pneumatic Systems
Based on the above analysis, the efficiencies of the four parts can be summed up as shown in Table 6. The total efficiency of a pneumatic system is less than 20%.
(20) ηcy= Wwk
Ecyi
×100%.
Figure 7 Picture of filter pressure loss and energy efficiency
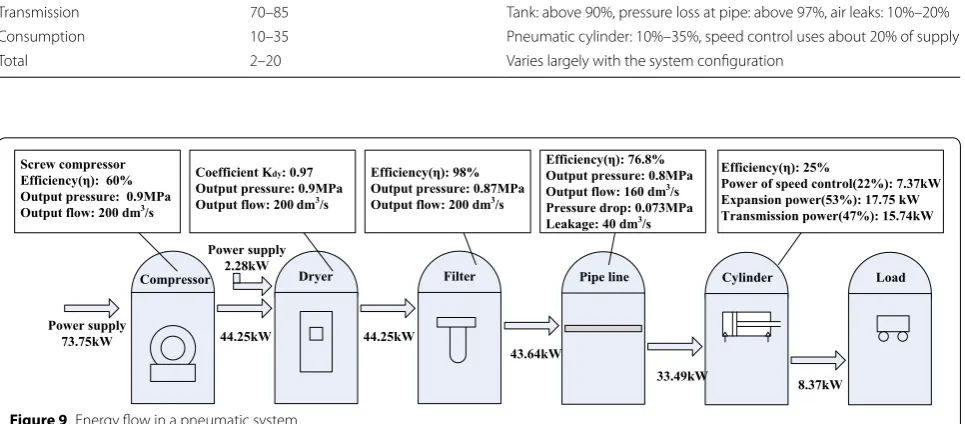
Take a simple practical pneumatic system as an exam-ple, pneumatic power is used to analyze efficiency of some components and energy flow in the system, which is shown in Figure 9. Table 7 shows the related details of power flow minutely for reference.
6 Conclusions
In this paper, methods to evaluate and measure the power of pneumatic system were introduced. With the methods, power distributions in pneumatic system were analyzed. Through this paper, it can be concluded that:
1. The methods to evaluate and measure power of pneumatic system are proposed, which lays a founda-Table 6 Power flow in pneumatic cylinder actuating systems
Part Efficiency (%) Detail
Production 35–75 ≤ 10 kW: 35%–50%, 10‒100 kW: 40–60, > 100 kW: 50%–70%
Cleaning 85–90 After-cooler: 99%, dryer: 90%–96%, filter: 95%
Transmission 70–85 Tank: above 90%, pressure loss at pipe: above 97%, air leaks: 10%–20% Consumption 10–35 Pneumatic cylinder: 10%–35%, speed control uses about 20% of supply Total 2–20 Varies largely with the system configuration
Dryer Compressor
Power supply
73.75kW 44.25kW Power supply
2.28kW
Filter
44.25kW
Pipe line
43.64kW
Cylinder
33.49kW
Load
8.37kW Screw compressor
Efficiency(η): 60% Output pressure: 0.9MPa Output flow: 200 dm3/s
Coefficient Kdy: 0.97
Output pressure: 0.9MPa Output flow: 200 dm3/s
Efficiency(η): 98% Output pressure: 0.87MPa Output flow: 200 dm3/s
Efficiency(η): 76.8% Output pressure: 0.8MPa Output flow: 160 dm3/s
Pressure drop: 0.073MPa Leakage: 40 dm3/s
Efficiency(η): 25%
Power of speed control(22%): 7.37kW Expansion power(53%): 17.75 kW Transmission power(47%): 15.74kW
Figure 9 Energy flow in a pneumatic system
Table 7 Analysis of energy flow in a pneumatic system
(1) Total efficiency is equal to product of efficiencies of all components
(2) Output power of compressor here is available power
(3) Because pipe line between compressor, refrigeration dryer and filter is relatively short, pressure drop along the way and leak can be neglected, effect summation of which is considered in pipe line
Components Absolute
pressure (MPa)
Volume flow‑rate (dm3/s)
Input power (kW)
Output power (kW)
Efficiency(1) Remarks
Compressor Export: 0.9 200 73.75 44.25(2) 60% Screw type, rated power: 75 kW
Refrigeration dryer(3) 0.9 → 0.9 200 → 200 44.25 44.25 K
dy= 0.97 Power consumption: 2.28 kW
Filter 0.9 → 0.873 200 → 200 44.25 43.64 98% – Pipe line, connector,
control valve, etc. 0.873 → 0.8 200 → 160 43.64 33.49 76.8% Leakage (20%): 40 dm
3/s, pressure drop along the way
(8.36%): 0.073 MPa
tion for development of the energy-saving pneumatic technologies and components.
2. Consider that motor power accounts for only 90% of the total power consumption, the overall pneumatic power efficiencies of piston compressor, vane com-pressor, screw compressor and centrifugal compres-sor are about 39.6%–73.1%, 42.1%–52.7%, 45.4%– 57.2% and 59.9%–63.4%.
3. The pneumatic power efficiency of pneumatic system in the cleaning procedure is 85%–90% approximately, and the pneumatic power efficiencies of after-cooler, dryer and filter are about 99%, 90%–96% and 95%, respectively.
4. The pneumatic power efficiencies of pneumatic sys-tem in the transmission and consumption proce-dures are about 70%–85% respectively.
5. The total pneumatic power efficiency of pneumatic system is about 2%–20%, which varies largely with the system configuration.
Therefore, the ways to improve the efficiency of pneu-matic system are: isothermal compression of compressor, partial pressure supply of pipeline network, reduction of pressure loss and compressed air leakage, and so on. Authors’ Contributions
YS was in charge of the whole trial; YS also wrote the whole manuscript; WX assisted with sampling and laboratory analyses. All authors read and approved the final manuscript.
Author Details
1 School of Automation Science and Electrical Engineering, Beihang University, Beijing 100191, China. 2 The State Key Laboratory of Fluid Power and Mechatronic Systems, Zhejiang University, Hangzhou 310058, China.
Authors’ Information
Yan Shi is a professor at School of Automation Science and Electrical Engineer-ing, Beihang University, China. In addition, he obtained his doctoral degree in mechanical engineering from Beihang University, China. He is major in intelligent medical devices, pneumatic control system and energy-saving of pneumatic systems.
Maolin Cai is a professor at School of Automation Science and Electrical Engineering, Beihang University, China. He got his doctor degree from Tokyo Institute of Technology, Japan. He is specialized in intelligent medical devices, technology of high efficiency and large scale compressed air energy storage.
Weiqing Xu is a lecturer at School of Automation Science and Electrical Engineering, Beihang University, China. He got his doctor degree in mechanical engineering from Beihang University, China. His research interests include intel-ligent mechanical devices and high efficient compressed air energy storage technologies.
Yixuan Wang received his B.E degree from School of Automation Science and Electrical Engineering, Beihang University, in 2015. He is currently a Ph.D. candidate at Beihang University, China. His research interests include fuel and power systems of UAV, fluid control, measurement and control system.
Competing Interests
The authors declare that they have no competing interests.
Funding
Supported by National Natural Science Foundation of China (Grants Nos. 51675020, 51375028) and Open Foundation of the State Key Laboratory of Fluid Power and Mechatronic Systems.
Received: 2 July 2017 Accepted: 17 April 2019
References
[1] S W Mei, J J Wang, F Tian, et al. Design and engineering implementation of non-supplementary fired compressed air energy storage system: TICC-500. Science China Technological Sciences, 2015, 58(4): 600-611.
[2] M Saadat, F A Shirazi, P Y Li. Modeling and control of an open accumula-tor Compressed Air Energy Saccumula-torage (CAES) system for wind turbines. Applied Energy, 2015, 137: 603-616.
[3] Sun X Q, L Chen, S H Wang, et al. Vehicle height control of electronic air suspension system based on mixed logical dynamical modelling. Science China Technological Sciences, 2015, 58(11): 1894-1904.
[4] Y Shi, M Cai. Dimensionless study on output flow characteristics of expansion energy used pneumatic pressure booster. Journal of Dynamic Systems, Measurement and Control, 2013, 135(2): 021007.
[5] D Wolf, M Budt. LTA-CAES–A low-temperature approach to adiabatic compressed air energy storage. Applied Energy, 2014, 125: 158-164. [6] P Radgen. Efficiency through compressed air energy audits. Energy Audit
Conference, 2006.
[7] A P Senniappan. Baselining a compressed air system—an expert systems approach. Morgantown: West Virginia University, USA, 2004.
[8] H B Qin, A McKane. Improving energy efficiency of compressed air system based on system audit. Shanghai: Lawrence Berkeley National Laboratory, 2008.
[9] M L Cai, K Kawashima, T Kagawa. Power assessment of flowing com-pressed air. Journal of Fluids Engineering, 2006, 128(2): 402-405.
[10] Dutch National Team, “Compressed Air: Savings of 30% Are Quite Normal”, CADDET Energy Efficiency, Newsletter, 1999(3): 14-16.
[11] S Chen, C Youn, T Kagawa, et al. Transmission and consumption of air power in pneumatic system. Energy and Power Engineering, 2014, 6(13): 487.
[12] C J Cargo, A J Hillis, A R Plummer. Strategies for active tuning of wave energy converter hydraulic power take-off mechanisms. Renewable Energy, 2016, 94: 32-47.
[13] G Yang, J Jiang. Power characteristics of a variable hydraulic transformer. Chinese Journal of Aeronautics, 2015, 28(3): 914-931.
[14] Y Lin, J Bao, H Liu, et al. Review of hydraulic transmission technologies for wave power generation. Renewable and Sustainable Energy Reviews, 2015, 50: 194-203.
[15] M L Cai, T Kagawa. Energy consumption assessment of pneumatic actuating systems including compressor. Proceedings of International Conference on Compressors and Their Systems, 2001: 381-390.
[16] Y Shi, M L Cai. Working characteristics of two kinds of air-driven boosters. Energy Conversion and Management, 2011, 52(12): 3399-3407.
[17] Y Shi, T C Wu, M L Cai, et al. Energy conversion characteristics of a hydro-pneumatic transformer in a sustainable-energy vehicle. Applied Energy, 2016, 171: 77-85.
[18] Y Shi, T C Wu, M L Cai, et al. Modelling and study on the output flow characteristics of expansion energy used hydropneumatic transformer. Journal of Mechanical Science and Technology, 2016, 30(3): 1163-1170. [19] P P Liao, M L Cai, Y Shi, et al. Compressed air leak detection based on
time delay estimation using a portable multi-sensor ultrasonic detector. Measurement Science and Technology, 2013, 24(5): 055102.
[20] Q Xu, M L Cai, Y Shi. Dynamic heat transfer model for temperature drop analysis and heat exchange system design of the air-powered engine system. Energy, 2014, 68: 877-885.
[21] Q Y Xu, Y Shi, Q H Yu, et al. Virtual prototype modeling and performance analysis of the air-powered engine. Proceedings of the Institution of Mechanical Engineers, Part C: Journal of Mechanical Engineering Science, 2014, 228(14): 2642-2651.
[22] Q H Yu, M L Cai, Y Shi, et al. Dimensionless study on efficiency and speed characteristics of a compressed air engine. Journal of Energy Resources Technology, 2014, 137(4): 2181-2193.
[24] Y Shi, Y X Wang, M L Cai, et al. Power characteristics of a new kind of air‐powered vehicle. International Journal of Energy Research, 2016, 40(8): 1112-1121.
[25] Y X Wang, Y Shi, M L Cai, et al. Efficiency optimized fuel supply strategy of aircraft engine based on air-fuel ratio control. Chinese Journal of Aeronaut-ics, 2019, 32(2): 489-498.
[26] D K Shen, Q L Chen, Y X Wang. Dimensionless energy conversion charac-teristics of an air-powered hydraulic vehicle. Applied Sciences, 2018, 8(3): 347.