DOI: 10.5958/2230-732X.2017.00050.X ©2017New Delhi Publishers. All rights reserved
BIOTECHNOLOGY
Stability Performance of Bread Wheat Genotype for Grain
Yield, Zinc and Iron Concentrations
Baldeep Singh*, G.S. Mavi, Akhil Malhotra, Neerja Sood, Ramandeeep Kaur Jhinjer,
Binder Kaur, Indu Bhagat, Vineet Kumar and V.S. Sohu
Department of Plant Breeding and Genetics, Punjab Agricultural University, Ludhiana, Punjab, India *Corresponding author: [email protected]
Paper No. 595 Received: 15-4-2017 Accepted: 2-7-2017
ABSTRACT
The primary aim of plant breeding is to improve stability in yield and to obtain varieties with good quality. For this reason, a study of wheat genotypes was conducted at three different locations: Bathinda, Gurdaspur and Ludhiana during 2015-16 in Punjab (India). Grain yield and its components with quality traits were assessed in 21 wheat genotypes with 3 checks using analysis of variance and regression analysis. The combined analysis of variance for environment (E), genotype (G) and (G×E) interaction was highly significant for all studied traits, suggesting differential responses of the genotypes and the need to stability analysis. Results revealed that high yielding genotypes can also be stable. The check HD 3086 and PBW 725 and genotypes BWL 6003, BWL 6065, BWL 6066, BWL 6068 and BWL 6069 for grain yield/ plot had desired performance in term of high mean, unit regression coefficient (bi) and least deviation from regression (S2d), indicating the role of linear portion of GxE interaction and average stability in the performance of these genotype. The value of regression coefficient (bi) of genotypes BWL 6008, BWL 6011 and checks HD 3086, PBW 725 for grain Fe concentration; genotypes BWL 6006, BWL 6007, BWL 6013 and BWL 6062 for grain Zn concentration were have high mean, unit regression coefficient (bi) and least deviation from regression (S2d), indicating that these genotypes were considered specially adopted to unfavorable environments
Highlights
• The check HD 3086 and PBW 725 and genotypes BWL 6003, BWL 6065, BWL 6066, BWL 6068 and BWL 6069 for grain yield/plot was stable across environment.
• BWL 1007 and BWL 1008 had significant grain Iron and Zinc concentrations across three environment. Keywords: Wheat, stability, regression coefficient, Fe, Zn, grain yield
Wheat (Triticum aestivum L.) is one of the most important crops of India, and improvement in its productivity has played a key role in making the country self-sufficient in food production. It is grown on a fairly wide range of soil and climatic conditions. The area available for wheat cultivation is becoming increasingly limited, but the demand for wheat continues to grow. For this reason, wheat breeders have recently emphasized the planting of varieties at their optimum times and location for maximum yield production. Planting wheat in its
same under diverse agro-ecological conditions (Ali
et al. 2003). Some genotypes may perform well in certain environments, but, fail in several others. The basic cause of differences between genotypes in their yield stability is the wide occurrence of Genotype
× Environment (GE) interactions. Genotype-environment interactions are extremely important in the development and evaluation of plant varieties because they reduce the genotypic-stability values under diverse environments (Hebert et al. 1995). Therefore, In the development of the cultivars, G×E
interactions are the primary factors that concern plant breeders. For breeders, stability of quality attributes is also important in terms of changing ranks of genotypes across environments and affects selection efficiency. The principal objective of plant breeding is to improve stability in yield and to develop varieties of good quality. The concept of stability has been defined in several ways and several biometrical methods including univariate and multivariate ones have been developed to assess stability (Lin et al. 1986; Becker and Leon 1988; Crossa 1990). The most widely used one is the regression method, based on regressing mean value of each genotype on the environmental index or marginal means of environments (Romagosa and Fox 1993; Tesemma et al. 1998). A good method to measure stability was previously proposed (Finlay and Wilkinson, 1963) and was later improved (Eberhart and Russell, 1966). The stability of varieties was defined by high mean yield and regression coefficient (bi = 1.0) and deviations from regression as small as possible (s2
di = 0). The stability was
defined as adaptation of varieties to unpredictable and transient environmental conditions and the technique has been used to select stable genotypes unaffected by environmental changes (Allard and Bradshaw 1964). The stability parameters are useful in characterizing genotypes according to their relative performance across locations.
Grain yield stability is one of the most important needs of agriculture. The ideal wheat (Triticum aestivum L.) genotype should be high yielding under any environmental conditions. But as genetic effects are not independent of environmental effects, most genotypes do not perform satisfactorily in all environments (Carvalho et al. 1983). When interaction between genotype and environment occurs, the relative ranking of cultivars for yield
often differs when genotypes are compared over a series of environments and/or years. This poses a serious problem for selecting genotypes significantly superior in grain yield (Stafford 1982).
Various statistical techniques have been developed to identify systematic variation in individual genotypic responses. Among these, Eberhart and Russell (1966) model has been widely used in studies of adaptability and stability of plant materials (Carvalho et al. 1983, and Espitia-Rangel
et al. 1999). The effectiveness of each method depends on the proportion of the genotype by environment interaction that each analysis can explain (Shorter et al. 1991). Therefore, the choice of an adequate model to measure the stability of different genotypes is a question to be resolved by researchers. According to Crossa et al. (1988), the selection of superior genotypes in a plant-breeding program is based mainly on their yield potential and stable performance over a range of environmental conditions.
The objectives of this study were to estimate genotype × environment (GE) interaction effects and testing stability of their performance and range of adaptations to determine the stable bread wheat (Triticum aestivum L.) genotypes for grain yield and its components with reference to Fe and Zn in different areas of Punjab (India). Where, development of any crop genotypes with wider adaptation is one of most important goal of breeding program.
MATERIALS AND METHODS
Plant material
Zn concentration, 1000 grain weight (gm) and grain yield (kg/plot).
Grain analysis
The concentration of elements Fe and Zn in wheat grains was determined using a bench-top, non-destructive, energy-dispersive X-ray fluorescence spectrometry (EDXRF) instrument (model X-Supreme 8000, Oxford Instruments plc, Abingdon, UK), previously standardized for high throughput screening of Zn and Fe in whole wheat grain (Paltridge et al. 2012).
Data analysis
Combined analysis of variance (ANOVA) was calculated by Randomized Block Design analysis on multiple environment trials to evaluate the significance of the differences between genotypes. Two stability parameters were applied to assess stability performance of genotypes and to identify superior genotypes; bi, the linear regression of the phenotypic values on environmental index (Finlay and Wilkinson, 1963) and S2d, the deviation mean square from regression (Eberhart and Russell, 1966), all analysis were performed using the statistical software OPSTAT for ANOVA and for stability statistics. To predict stability, a genotype was considered stable for grain yield if it appeared stable in two (out of three) stability analysis. Genotypes that proved to be stable for most stability analysis were then selected as the best. One way analysis of variance was used to evaluate the significant difference for the studied
genotypes and the genotype and environment interaction. The differences in the means of yield of the genotypes were determined for each location based on the overall average. Stability values were estimated from the quadratic mean of the regression deviation (Eberhart and Russell 1966). To define genotypic stability, a genotype which had higher or equal mean grain yield than grand mean yield as a precondition was considered stable for grain yield.
RESULTS AND DISCUSSION
Effects of environments, genotypes and their interaction on grain yield
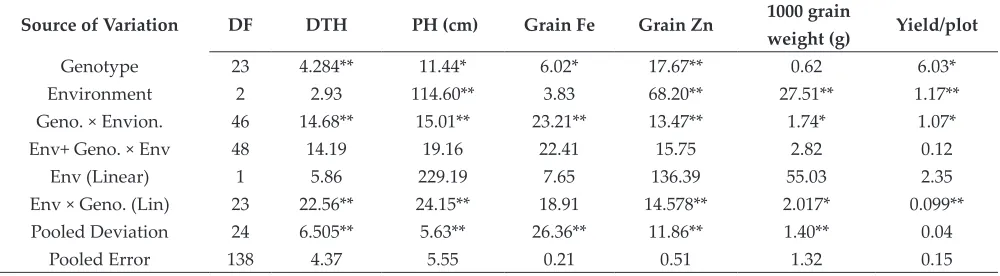
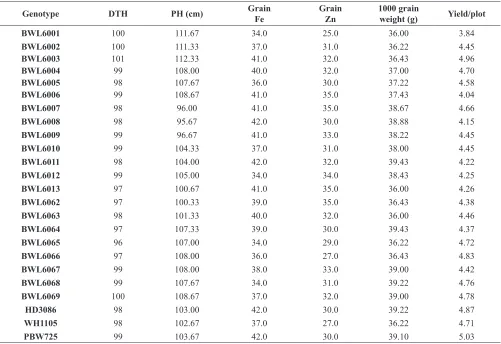
The results of the combined analysis of variance are given in Table 1. An analysis of variance revealed significant (p<0.01) differences for grain yield among genotypes and environments. This reveals not only the amount of variability that existed among environments but also the presence of genetic variability among the genotypes. For genotype × environment and genotype × environment (linear) interaction significant difference were observed. Thus it signifies unit change in environmental index for each unit change in the environmental conditions. These results also reported in many previous studies on bread and durum wheat (Marti and Slafer 2014) and (Menshawy 2007). The mean grain yield was observed from 21 wheat genotypes with 3 checks across three environments and ranged from 2.92 kg to 3.73 kg/plot and the highest grain yield was obtained from genotypes BWL 6003 and BWL 6066, which is at par as compare to checks
Table 1: Pooled Analysis of variance of different characters in different genotypes of Bread Wheat
Source of Variation DF DTH PH (cm) Grain Fe Grain Zn 1000 grain
weight (g) Yield/plot
Genotype 23 4.284** 11.44* 6.02* 17.67** 0.62 6.03*
Environment 2 2.93 114.60** 3.83 68.20** 27.51** 1.17**
Geno. × Envion. 46 14.68** 15.01** 23.21** 13.47** 1.74* 1.07*
Env+ Geno. × Env 48 14.19 19.16 22.41 15.75 2.82 0.12
Env (Linear) 1 5.86 229.19 7.65 136.39 55.03 2.35
Env × Geno. (Lin) 23 22.56** 24.15** 18.91 14.578** 2.017* 0.099**
Pooled Deviation 24 6.505** 5.63** 26.36** 11.86** 1.40** 0.04
Pooled Error 138 4.37 5.55 0.21 0.51 1.32 0.15
*, ** significant at P=0.05 and 0.01, respectively.
(Table 2). It was emphasized that both linear (bi) and non-linear (s2d
i) components of GE interactions
are necessary for judging the stability of a genotype (Eberhart and Russell 1966). A regression coefficient (bi) approximating 1 coupled with an s2d
i of zero
indicates average stability (Eberhart and Russell 1966). Regression values above 1 describe genotypes with higher sensitivity to environmental change (below average stability) and greater specificity of adaptability to high yielding environments. A regression coefficient below 1.0 provides a measurement of greater resistance to environmental change (above average stability), and thus increases the specificity of adaptability to low yielding environments (Wachira et al. 2002). Linear regression for the average grain yield of a single genotype on the average yield of all genotypes in each environment resulted in regression coefficients (b
i
values) ranging from -0.75 to 3.00 for grain yield. This large variation in regression coefficients indicates different responses of genotypes to
environmental changes (Table 4, Fig. 1). As regard of grain yield genotypes and environment interaction was significant, indicating that adequate amount of genetic difference among genotypes for environmental response. Genotype BWL 6003, BWL 6065, BWL 6069 and checks HD3086, PBW 725 have regression coefficient (bi) values close to unity (0.9 and 1.0, respectively) with small deviation from regression (s2d
i) and above average yield and thus
possessed fair stability and wider adaptation over different environment. Genotypes with high mean yield, a regression coefficient equal to the unity (bi = 1) and small deviations from regression (s2d
i
= 0) are considered stable (Finlay and Wilkinson, 1963; Eberhart and Russell 1966). Similar findings reported by Mohtasham et al. (2012), Mohammadi
et al. (2012) and Hamlabad (2012). In contrast, genotype BWL 6003, BWL 6002, BWL 6001 and check WH1105 had regression coefficients greater than 1, and so were regarded as sensitive to environmental changes for grain yield.
Table 2: Pooled mean DTH, PH, grain Fe, grain Zn, 1000 grain weight (g) and Seed yield/plot of bread wheat genotypes tested over three environments
Genotype DTH PH (cm) GrainFe GrainZn 1000 grainweight (g) Yield/plot
BWL6001 100 111.67 34.0 25.0 36.00 3.84
BWL6002 100 111.33 37.0 31.0 36.22 4.45
BWL6003 101 112.33 41.0 32.0 36.43 4.96
BWL6004 99 108.00 40.0 32.0 37.00 4.70
BWL6005 98 107.67 36.0 30.0 37.22 4.58
BWL6006 99 108.67 41.0 35.0 37.43 4.04
BWL6007 98 96.00 41.0 35.0 38.67 4.66
BWL6008 98 95.67 42.0 30.0 38.88 4.15
BWL6009 99 96.67 41.0 33.0 38.22 4.45
BWL6010 99 104.33 37.0 31.0 38.00 4.45
BWL6011 98 104.00 42.0 32.0 39.43 4.22
BWL6012 99 105.00 34.0 34.0 38.43 4.25
BWL6013 97 100.67 41.0 35.0 36.00 4.26
BWL6062 97 100.33 39.0 35.0 36.43 4.38
BWL6063 98 101.33 40.0 32.0 36.00 4.46
BWL6064 97 107.33 39.0 30.0 39.43 4.37
BWL6065 96 107.00 34.0 29.0 36.22 4.72
BWL6066 97 108.00 36.0 27.0 36.43 4.83
BWL6067 99 108.00 38.0 33.0 39.00 4.42
BWL6068 99 107.67 34.0 31.0 39.22 4.76
BWL6069 100 108.67 37.0 32.0 39.00 4.78
HD3086 98 103.00 42.0 30.0 39.22 4.87
WH1105 98 102.67 37.0 27.0 36.22 4.71
Relationship between the regression coefficients and mean grain yield
-1.00 0.00 1.00 2.00 3.00 4.00 5.00 6.00
0 5 10 15 20 25 30
Mean Grain yield/plot Regression coefficient
Fig. 1
Fig. 1 shows the genotype and regression coefficients plotted against the means of grain yield. Genotypes BWL 6001, BWL 6006, BWL 6008 and check WH1105 had regression coefficients greater than unity for grain yields with at par grain yield i.e. 3 kg/ plot. Therefore, these genotypes are sensitive to environmental changes and can be recommended for cultivation under favorable conditions. Genotype BWL 6003, BWL 6065, BWL 6066, BWL 6068, BWL 6069 and checks HD3086, PBW 725 have regression
coefficient (bi) values close to unity. Therefore, these genotypes are resistant to environmental changes
and can be recommended for cultivation under
unfavorable conditions.
Effects of environments, genotypes and their interaction on grain iron and zinc concentration
The pooled analysis of variance (Table 1) was carried out after ascertaining the homogeneity of error variance using the Eberhart and Russell model. G × E interactions were found to be significant (at P≤0.01) for both the micronutrients. Grain Fe expressed higher G × E interaction in comparison to grain Zn concentration. Similar finding was reported in maize (Chakraborti et al. 2011). The ANOVA for stability using Eberhart Russel model revealed variation due to G × E (linear) non significant for grain Fe and significant for grain Zn concentration.
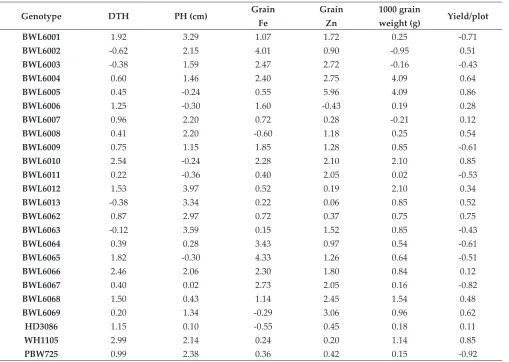
Table 3: Deviation from regression S2d
i (Eberhart and Russell 1966), stability parameters for 21+3 checks in bread
wheat genotypes across three environments
Genotype DTH PH (cm) Grain
Fe
Grain Zn
1000 grain
weight (g) Yield/plot
BWL6001 1.92 3.29 1.07 1.72 0.25 -0.71
BWL6002 -0.62 2.15 4.01 0.90 -0.95 0.51
BWL6003 -0.38 1.59 2.47 2.72 -0.16 -0.43
BWL6004 0.60 1.46 2.40 2.75 4.09 0.64
BWL6005 0.45 -0.24 0.55 5.96 4.09 0.86
BWL6006 1.25 -0.30 1.60 -0.43 0.19 0.28
BWL6007 0.96 2.20 0.72 0.28 -0.21 0.12
BWL6008 0.41 2.20 -0.60 1.18 0.25 0.54
BWL6009 0.75 1.15 1.85 1.28 0.85 -0.61
BWL6010 2.54 -0.24 2.28 2.10 2.10 0.85
BWL6011 0.22 -0.36 0.40 2.05 0.02 -0.53
BWL6012 1.53 3.97 0.52 0.19 2.10 0.34
BWL6013 -0.38 3.34 0.22 0.06 0.85 0.52
BWL6062 0.87 2.97 0.72 0.37 0.75 0.75
BWL6063 -0.12 3.59 0.15 1.52 0.85 -0.43
BWL6064 0.39 0.28 3.43 0.97 0.54 -0.61
BWL6065 1.82 -0.30 4.33 1.26 0.64 -0.51
BWL6066 2.46 2.06 2.30 1.80 0.84 0.12
BWL6067 0.40 0.02 2.73 2.05 0.16 -0.82
BWL6068 1.50 0.43 1.14 2.45 1.54 0.48
BWL6069 0.20 1.34 -0.29 3.06 0.96 0.62
HD3086 1.15 0.10 -0.55 0.45 0.18 0.11
WH1105 2.99 2.14 0.24 0.20 1.14 0.85
Despite various factors affecting grain micronutrient status including differential behavior of genotypes in locations, this study was successful in identifying promising wheat genotypes based on mean value of genotypes, regression values and deviations from regression. Thirteen wheat genotypes viz., BWL 6008, BWL 6011 and checks HD 3086, PBW 725 for grain Fe concentration; genotypes BWL 6006, BWL 6007, BWL 6013 and BWL 6062 were identified as stable genotype for grain Zn concentration (Table 4). The study indicated higher sensitivity of grain Fe to environmental fluctuations.
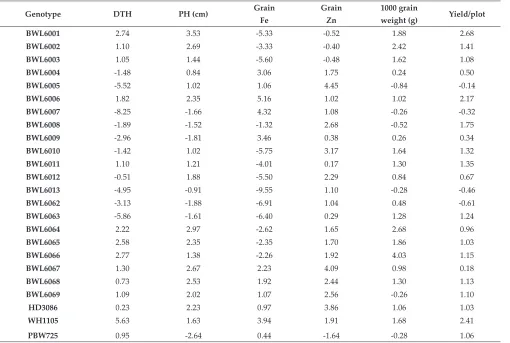
The value of regression coefficient (bi) of genotypes BWL 6002, BWL 6003, BWL 60011 and BWL 6069 for days to heading; genotypes BWL 6005 and BWL 6010 for plant height: genotypes BWL 6006, BWL 6067 and HD 3086 for 1000 grain weight were close/ equal to unitindicating that these genotypes were considered specially adopted to unfavorable environments. Meanwhile, the value of regression
coefficient of genotypes BWL 6001, BWL 6006, BWL 6065, BWL 6066 and check WH 1105 for days to heading; BWL 6001, BWL 6002, BWL 6064 and check HD 3086, WH 1105 for plant height; genotypes BWL 6005, BWL 6007, BWL 6067 and check PBW 725, WH 1105 for grain Fe concentration; BWL 6006, BWL 6010, BWL 6067, BWL 6069 and check HD 3086 for grain Zn concentration; BWL 6001, BWL 6002, BWL 6065, BWL 6066 and check WH 1105 for 1000 grain weight and genotypes BWL 6001, BWL 6002, BWL 6006, BWL 6008 and check WH 1105 had bi values more than unity (bi>1) and could be greater specificity of adaptability to optimum environment.
CONCLUSION
Only genotype BWL 6003 showed higher grain yield than both checks HD3086 and WH1105 and its regression coefficient was close to unity. This variety was considered the best in terms of adaptation to all environments with lowest deviations from
Table 4: Regression coefficient bi (Eberhart and Russell 1966), stability parameters for 21+3 checks in bread wheat genotypes across three environments
Genotype DTH PH (cm) Grain
Fe
Grain Zn
1000 grain
weight (g) Yield/plot
BWL6001 2.74 3.53 -5.33 -0.52 1.88 2.68
BWL6002 1.10 2.69 -3.33 -0.40 2.42 1.41
BWL6003 1.05 1.44 -5.60 -0.48 1.62 1.08
BWL6004 -1.48 0.84 3.06 1.75 0.24 0.50
BWL6005 -5.52 1.02 1.06 4.45 -0.84 -0.14
BWL6006 1.82 2.35 5.16 1.02 1.02 2.17
BWL6007 -8.25 -1.66 4.32 1.08 -0.26 -0.32
BWL6008 -1.89 -1.52 -1.32 2.68 -0.52 1.75
BWL6009 -2.96 -1.81 3.46 0.38 0.26 0.34
BWL6010 -1.42 1.02 -5.75 3.17 1.64 1.32
BWL6011 1.10 1.21 -4.01 0.17 1.30 1.35
BWL6012 -0.51 1.88 -5.50 2.29 0.84 0.67
BWL6013 -4.95 -0.91 -9.55 1.10 -0.28 -0.46
BWL6062 -3.13 -1.88 -6.91 1.04 0.48 -0.61
BWL6063 -5.86 -1.61 -6.40 0.29 1.28 1.24
BWL6064 2.22 2.97 -2.62 1.65 2.68 0.96
BWL6065 2.58 2.35 -2.35 1.70 1.86 1.03
BWL6066 2.77 1.38 -2.26 1.92 4.03 1.15
BWL6067 1.30 2.67 2.23 4.09 0.98 0.18
BWL6068 0.73 2.53 1.92 2.44 1.30 1.13
BWL6069 1.09 2.02 1.07 2.56 -0.26 1.10
HD3086 0.23 2.23 0.97 3.86 1.06 1.03
WH1105 5.63 1.63 3.94 1.91 1.68 2.41
regression (s2d
i= -0.43). Genotype BWL 6008, BWL
6011 for grain Fe concentration, BWL6006, 6007, 6013, 6062 for Zn concentration were suitable for unfavorable environments due to their regression coefficients equal to unity, above mean and low deviations from regression values.
REFERENCES
Ali, N., Javidfar, F. and Mirza, Y. 2003. Selection of stable rapeseed (Brassica napus L.) genotypes through regression analysis. Pak J Bot., 35: 175-183.
Allard, R. and Bradshaw, A.D. 1964. Implications of genotype environmental interactions in applied plant breeding.
Crop Sci., 4: 503-507.
Becker, H.B. and Leon, J. 1988. Stability analysis in plant breeding. Plant Breed, 101: 1-23.
Carvalho, F.I.F., Federizzi, L.C. and Nodari, R.O. 1983. Comparison among stability models in evaluating genotypes. Rev Bras Genet., 6(4): 667-691.
Comstock, R.E. and Moll, R.H. 1963. Genotype x Environment Interactions. Symposium on Statistical Genetics and Plant Breeding. National Academy Science National Research Council, Washington, DC, pp. 164-196.
Crossa, J. 1990. Statistical analysis of multi-location trials. Adv
Agron., 44: 55-85.
Crossa, J., Westcott, B.. and Gonzalez, C. 1988. The yield stability of maize genotypes across international environments: full season tropical maize. Exp Agric., 24(2): 253-263.
Eberhart, S.A. and Russell, W.A. 1966. Stability parameters for comparing varieties. Crop Sci., 6: 36-40.
Espitia-Rangel, E., Baenziger, P.S. and Graybosch, R.A. 1999. Agronomic performance and stability of 1A vs. 1AL.1RS genotypes derived from winter wheat ‘Nekota’. Crop Sci., 39: 643-648.
Hamlabad, H. 2012. Yield Stability of Promising Lines of Winter and Facultative Wheat in Different Climate of Iran. African J Agric Res., 7(15): 2304-2311.
Hebert, Y., Plomion, C. and Harzic, N. 1995. Genotypic x environment interaction for root traits in maize as analysed with factorial regression models. Euphytica, 81: 85-92.
Hintsa, G. and Abay, F. 2013. Evaluation of Bread wheat Genotypes for their Adaptability in wheat growing Areas of Tigray Region, northern Ethiopia Journal of Biodiversity and Endangered Species,1: 104.
Lin, C.S., Binns, M.R. and Lefkovitch, L.P. 1986. Stability analysis: Where do we stand? Crop Sci., 26: 894-900. Chakraborti, M., Hossain, F., Kumar, R., Gupta, H.S. and
Prasanna, B.M. 2011. Genetic evaluation of grain yield and kernel micronutrient traits in maize. Pusa Agri Science, 32: 11-16.
Marti, J. and Slafer, G.A. 2014. Bread and durum wheat yields under a wide range of environmental conditions. Field
Crops Res., 156: 258–271.
Menshawy, A.M.M. 2007. Evaluation of some early bread wheat genotypes under different sowing dates:1 Earliness characters. Fifth plant breeding conference (May). Egypt
J Plant Breed, 11(1): 25-40.
Mohammadi, M., Karimizadeh, R., Hooseinpou, T., Falahi, H.A., Khanzadeh, H., Sabaghnia, N., Mohammadi, P., Armion, M. and Hosni, M.H. 2012. Genotype × Environment Interaction and Stability Analysis of Seed Yield of Durum Wheat Genotypes in Dryland Conditions Not. Sci Biol., 4(3): 57- 64.
Mohtasham, M., Karimizadeh, R., Sabaghnia, N. and Shefazadeh, M.K. 2012. Genotype × Environment Interaction and Yield Stability Analysis of New Improved Bread Wheat Genotypes. Turkish J. Field Crop, 17(1): 67-73. Ouda, S.A., El-Marsafawy, S.M., El-Kholy, M.A. and Gaballah,
M.S. 2005. Simulation the effect of water stress and different sowing dates on wheat production. J App Sci
Res., 1: 28-276.
Paltridge, N.G., Milham, P.J., Ortiz-Monasterio, J.I., Velu, G., Yasmin, Z., Palmer, L.J., Guild, G.E. and Stangoulis, J.C.R. 2012. Energy-dispersive X-ray fluorescence spectrometry as a tool for zinc, iron and selenium analysis in whole grain wheat. Plant Soil.,361(1–2): 261–269.
Romagosa, I. and Fox, P.N. 1993. Genotype-environment interactions and adaptation. In M.D. Hayward, N.O. Bosenmark and Romagosa (Ed.) Plant Breeding: Principles and Prospects, pp. 373-390.
Shorter, R., Lawn, R.J. and Hammer, G.L. 1991. Improving genotypic adaptation in crops- A role for breeders, physiologists and modelers. Exp Agric.,27(2): 155-175. Stafford, R.E. 1982. Yield stability of guar breeding lines and
cultivars. Crop Sci.,2(5): 1009-1011.