International Journal of Agriculture, Environment and Biotechnology Citation: IJAEB: 10(5): 553-563, October 2017
DOI: 10.5958/2230-732X.2017.00068.7 ©2017New Delhi Publishers. All rights reserved
BIOCHEMISTRY
Optimization of Ultrasonic Assisted Extraction of Bioactive
components from different Parts of Pineapple Waste
Kaavya Rathnakumar*, Anil Kumar Anal and Kalpana Lakshmi
Asian Institute of Technology, Department of food and Bioprocess Technology, Khlong Luang, Thailand, 12120 *Corresponding author: [email protected]
Paper No. 613 Received: 24-6-2017 Accepted: 19-9-2017
ABSTRACT
Waste accumulation is a serious problem in recent times as they cause serious effects to the environment. Pineapple waste is one among them and it includes the peel, core, stem and crown, which is obtained after processing and various bioactive compounds such as polyphenols, antioxidants and the protein digesting enzyme bromelain, are also present in pineapple waste. In the present study, the extraction of bioactive compounds from the pineapple peel and core was done using Ultrasound assisted extraction(UAE). The extraction conditions was optimised using the Response surface methodology by using the variables time(min), amplitude (%) and ethanol concentration. Protein samples obtained were purified using acetone precipitation and dialysis to determine the bromelain activity and protein pattern along with activity staining to confirm presence of bromelain enzyme.
Highlights
• High amount of polyphenols and enzymes were obtained from the peel and core using the ultrasound assisted extraction.
Keywords: Pineapple waste, Ultrasound assisted extraction, optimized condition, bromelain activity, purification
Pineapple (Ananas comosus) is the most valuable fruit which is ubiquitous and it is prime member
of the family Bromeliaceae which is originated from
South America. The production is 18.7 million tons in 2014 as per FAO. Its most preferred juice around the world next after apple and oranges. The growth of the plant is about the height of 75-150 cm and wideness of 90-120 cm which is short, stout stump with narrow, fibrous and spiny leaves[23].
Development of the plant was from cone-shaped from juicy and fleshy fruit with crown at the top part. Thailand is one of the gargantuan exporter of canned pineapple all over the world the year 2008 produced about 2.5 million tons reported in FAO and most of which is exported in the form of canned pineapples and as juices.
In pineapple processing sector, before peeling the fruit they cut off the stem, crown and core is being
removed. Waste parts of pineapple before and
after processing include core, stem, peel, crown
which record commonly a 50% wastage of the whole pineapple weight. While the production of pineapple increasing day by day, the waste from the pineapple is also apparently increasing. The
waste possess a lot of value and it is a known fact that it is enriched with cellulose, hemicellulose,
carbohydrates, antioxidants, polyphenols and also the bromelain a protein digesting enzyme, is present
in the pineapple waste[7]. Bromelain enzyme is
Rathnakumar et al.
reducing the arthritis, gout haemorrhoids, menses pain, auto immune disorders and ulcerative colitis,[1]
of platelet clumping and blood clots in the blood
stream, especially in the arteries[26].
Ultrasound assisted extraction is a simple, innovative, cost less and efficient substitute to the conventional extraction process. The increase in extraction yield
using ultrasound is mainly put down due to the
effect of acoustic capitations created in the solvent
through which the ultrasound wave is passed
through. The mechanical effect produced in the
ultrasound helps in penetration of solvent into
the sample by increasing the surface area and the contact between the solid and liquid phase, this will result in quick movement of the solute from
solid phase to the solvent[18]. Ultrasound-assisted
extraction is more remarkable because there is
less chance chemical degradation in the targeted
bioactive[19].
Disposal of waste is an extending issue, as there is microbial spoilage acting on and that causes serious environmental issues. Waste from the food industry possess a lot of values and the pattern
of waste management and disposal in the food industry is an integrated approach in the scene of
recycling and reuse in the waste recovery. Pineapple waste would be an excellent source of proteolytic enzymes, phenolic antioxidants. Convention extraction technique such as maceration is more of
time consuming, and yield is less compared to other
novel techniques[8].
The objectives of this present research were to
investigate, the yield of protein, total phenolic
content, antioxidant power using the variables time(min), amplitude(%) and ethanol concentration (%) through UAE treatment. Further, the study
aimed to identify the optimum operating conditions
for the processing of peel and core by using the
response surface methodology and determine the
yield through the characteristics of the bioactive compounds.
MATERIALS AND METHODS
Raw materialsRaw materials used in this experiment is the pineapple peel and core obtained from the “Prime Products Industry Co. Ltd” Chonburi Province, Thailand, which is the prime areas for the pineapple
plantations. The factory produces various products such as canned pineapples which includes titbits,
chunk, slices, pieces and also fruit cocktail and
juices. Through these products, the company generates a waste of 13% percent which can be utilized efficiently.
Chemicals
All chemicals used were of analytical grade. Bradford dye reagent (PRD.0.ZQ5.10000050486), Sodium acetate, Glacial acetic acid (ARK2183), EDTA, HCl, Folin -ciocalteau reagent (Code No: -03870), Ferric Chloride, Gallic acid, TPTZ (2, 4, 6-tripyridyl-s-triazine), Potassium phosphate buffer, Glycerol, Ferric chloride, Methanol (CAS No: 67-56-1), Sodium carbonate (CAT No:463), Acetone, L-Tyrosine (CAS No:60-18-4), Casein (CAS No: 9000-71-9) , Sodium carbonate solution, Sodium acetate buffer, Calcium acetate buffer, L-cysteine (PUB chem 24901592), Trichloroacetic acid (PubChem CID 6421) Sodium dodecyl sulfate (PubChem CID 3423265), Hydrochloric acid (PubChem CID 313) Sodium hydroxide (PubChem CID 14798).
Methods
Preparation of the sample
The collection of Pineapple waste (peel and core) was done from the “Prime Products Industry Co. Ltd” The samples was cleaned with distilled water
and made into small pieces separately which was
dried in the hot air oven. The dried samples were grinded in a lab scale mechanical grinder into a made into a piece of fine powder and kept at 4 °C for further process.
Ultrasonic assisted extraction
Optimization of Ultrasonic Assisted Extraction of Bioactive components from different Parts of Pineapple Waste
of gap was there to make sure that probe doesn’t touch the beaker, although the probe is dipped in the beaker.
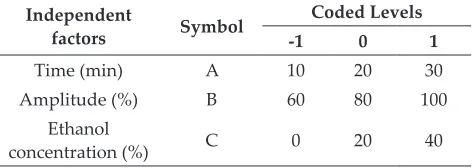
In this process of UAE, RSM was used to optimize and reduce the trial to 15 conditions to extract proteins, polyphenols and antioxidants from the pineapple peel and core. The independent factors were time (A: 10 min, 20 min and 30 min) Amplitude (B: 60%, 80% and 100%), and ethanol concentration (0, 20 and 40%) and responses were
total protein content, total phenolic content and
antioxidant activity. The above-mentioned factors to be optimized were coded at three levels −1, 0 and 1. The three-factor Box-Behnken data design reduced the number of experimental trials to 15. The interactions between the factors and responses were identified by using quantitative data. After the statistical analysis, the optimized extraction conditions were obtained.
Table 1: Independent factors with their coded and
actual values used for optimization of UAE Independent
factors Symbol
Coded Levels
-1 0 1
Time (min) A 10 20 30
Amplitude (%) B 60 80 100
Ethanol
concentration (%) C 0 20 40
Purification of protein by Acetone
Acetone precipitation was done to purify the
protein sample. Acetone was taken and cooled to (-20 °C). Protein sample obtained was added to the
cold acetone four times the volume of the protein
sample and vortexed thoroughly. Then the sample was incubated at - 20 °C for 60 minutes and then centrifugation at 13,000 g for a time interval 10 min. The supernatants after centrifugation were thrown and tubes which has pellet was in inverted direction for 15 min in order to remove acetone from the pellet which can be of excess. Re Dissolving of protein pellet was done in 0.01 mol/L phosphate buffer (pH 7.0). Then the solution was dialyzed against 0.01 mol/L phosphate buffer (pH 7.0) using a 1 kDa dialysis membrane for 14 h at 4 °C[11].
Proximate analysis
The dried pineapple (core and peel) powder was subjected to the determination of moisture content,
Ash content, Volatile content and fixed carbon content using thermogravimetric analyzer (TGA 701, LECO) was used using AOAC method.
Quantitative analysis
Total Protein content
To determine the protein present in the sample
Bradford standard was taken as reference and used
in the sample determination. BSA reagent was made by diluting the reagent with distilled water in the ratio of 1:4.100 μl. and 5 ml of Bradford dye was added to the sample solution. Then it was vortexed thoroughly and mixture was kept for incubation at ambient room temperature for 15 min and then absorbance was measured at 595nm[3] using UV
spectrophotometer (UV-UNICAM, ALVA,U.K).
Total phenolic content
Folin-Ciocalteau method [14] is a prominent method which was used to determine the amount of total
phenolic present in the sample. The sample of 1 ml was taken and diluted with 9 ml distilled water, from there 0.5ml of the diluted sample was taken and added with folins reagent of 2 ml which was freshly prepared at 1:10 ratio. And to the mixture 7.5% sodium carbonate of 4 ml was added and then kept for incubation for a time duration 30
minutes long and using the UV spectrophotometer
(UV-UNICAM, ALVA, U.K) the absorbance was measured at 765 nm.
Ferric reducing antioxidant power
Antioxidant activity of the crude extract sample was determined using the FRAP assay, using ferrous sulphate as the standard. Acetate buffer 300mM was used to prepare the frap reagent, then after 10 mM of TPTZ and 20 mM of ferric chloride was taken in the ratio (10:1:1). In 40 mM Hcl, 10 ml of 0.031 g TPTZ was dissolved in a water bath at 50°C. Ferric
chloride was therefore dissolved in distilled water
Rathnakumar et al.
DPPH radical scavenging activity
To determine the IC50 of the DPPH for optimized condition of the pineapple peel and core was done
by DPPH assay[25]. A software known as Graph
Pad prism (GPM6-1123456-ABCD-1234) was used
to determine the IC50 value using the equation 1/
Y2-weighted non-linear regression; log (inhibitor
concentration) vs. normalized response model with a variable slope DPPH is known to be a stable radical because of its paramagnetic property that is conferred by the odd electron. Through this property it has the ability of color change
in the solution from deep violet to yellow while
it is prepared with ethanol. This change can be determined by the absorbance at 515 nm using UV spectrometer. The sample to be tested for antioxidant activity was added to DPPH solution and which results in a pale violet, showing the effect of antioxidant. For testing the sample was diluted for at least five concentrations (two-fold dilutions) i.e. 1000, 500, 250, 125 and 62.5μl. And 6*10-5 M of
DPPH was prepared in absolute ethanol and then 1 ml of the sample was added with DPPH solution of 1 ml. The mixture was kept in the dark for 30 minutes incubation and measurement of absorbance was at 515 nm in the UV spectrophotometer (UV-UNICAM, ALVA, U.K)
DPPH scavenging (%) =
Absorbance of control Absorbance of sample *100
Absorbace of control
−
Electrophoresis Analysis: (Bio-Rad Laboratories, Inc., Richmond, CA, USA)
The molecular weight and protein pattern determination was determined using the SDS page.
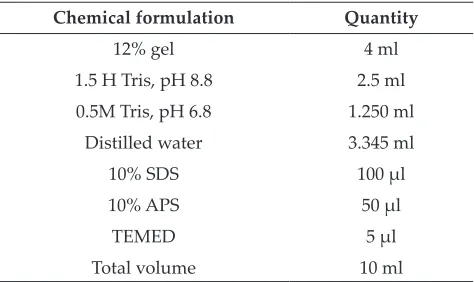
Table 2: SDS-PAGE (Polyacrylamide gel
electrophoresis) using the chemical formulation Chemical formulation Quantity
12% gel 4 ml
1.5 H Tris, pH 8.8 2.5 ml
0.5M Tris, pH 6.8 1.250 ml
Distilled water 3.345 ml
10% SDS 100 μl
10% APS 50 μl
TEMED 5 μl
Total volume 10 ml
The protein samples obtained from the optimized conditions of UAE was mixed with sample buffer and 15 μl was loaded into the gel and then it was subjected to electrophoresis (Bio-Rad Laboratories, Inc., Richmond, CA, USA)using the electrode buffer (glycine – 14.4 g, Tris – 3 g and SDS- 1 g which was made to 1 liter) at the current 15 mA/gel[13]. After when the separation was done the gel was put in a
stainer (Coomassie Brilliant Blue) and was left with slight shaking for 12 h and then it was taken and put in a destainer. After activity, staining was done to substantiate the bromelain using casein- substrate gel. The gel was completely merged in 50 ml of 2% casein 50mM phosphate buffer, for 45 mins with
constant agitation[9]. Then at 37 °C gel incubation
was done for 30 minutes to discern a clear zone on background of blue, which helped in confirmed the bromelain activity.
Protease assay for bromelain activity
The determination of bromelain activity was by done by casein digestion method by the presence of cysteine and EDTA (Murachi 1976) using casein as a substrate. The assay was of proteolytic hydrolysis in which the bromelain breaks up the smaller peptide bonds present and helps in releasing the amino acids which are free after hydrolyzing it with protein. In this case L-tyrosine was released from casein after hydrolysis with bromelain enzyme. Unhydrolyzed substrate was precipitated using TCA. The assay was mainly based on colorimetric method[27].
Optimization of Ultrasonic Assisted Extraction of Bioactive components from different Parts of Pineapple Waste
The enzyme activity was calculated using the equation:
Activity (CDU/ml) = Et Eb Es
− * concentration of standard Ltyrosine *Vr*Df
Tr Where,
Et - absorbance of enzyme sample; Eb - absorbance of enzyme blank; Es - absorbance standard L- tyrosine;
Df - dilution factor; Vr - reaction volume; tr - reaction time.
RESULTS AND DISCUSSION
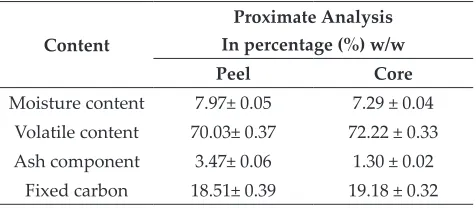
Proximate analysisThe proximate analysis of the pineapple peel and core was determined using the Thermo gravimetric analyser (TGA701, LECO) and the results were depicted.
Table 3: Proximate analysis of peel and core
Content
Proximate Analysis In percentage (%) w/w
Peel Core
Moisture content 7.97± 0.05 7.29 ± 0.04
Volatile content 70.03± 0.37 72.22 ± 0.33
Ash component 3.47± 0.06 1.30 ± 0.02 Fixed carbon 18.51± 0.39 19.18 ± 0.32 *Results are in means ± SD
The moisture content of the peel and core was found to be less and therefore the products with low moisture content, are not much subject to the effect of degradation by microbes and other chemical changes that occurs within the products.
Table 4: Range of Bioactive present obtained from the
Response surface analysis Treatment Sample Quadratic
model
Protein µg/g
TPC µg of GAE/g
FRAP µmol/g
Ultrasound Extraction
Peel 2979.4
-4526.82 3505.19 - 8208.36 18.55 - 153.02 R2 0.7136 0.8406 0.7763
Core 3581.69 -
6612.83 9340.26 - 24678.7 349.93 – 502.3 R2 0.6945 0.7091 0.7930
The volatile compounds are the ones that contribute to the aroma and the flavour as they are comprised
of many compounds such as esters, alcohols, aldehydes, ketones, lactones, terpenoids and
apocarotenoids. They also play special functions and also help the plant in preventing oxidative stresses. Both the peel and core has higher volatie content. The ash content of the sample determines the
amount of minerals present, therefore accordingly
the pineapple core has less minerals than the peel. Model fitting
Response surface analysis was used as a tool to optimize the extraction conditions for UAE treatment and using the responses, bioactive components were also analysed. The overall experimental design gave 15 runs and therefore
the regression analysis was also done for curve
fitting for the quadratic model and the significant difference from ANOVA was also obtained. Models summary statistics showed that the cubic models were found to have R2 values between 0.80 to 0.99,
indicating the regression models were suitable to explain the behavior of the model. In addition, the adj-R2 values (cubic model) for the total phenolic content and FRAP of the peel were found to be higher than 0.910, indicating that insignificant term have not been included in the model. However, the cubic model was found to be aliased signifying that the effects of each variable caused different signal to become indistinguishable[24].
Extraction of bioactive active components from peel of pineapple
The range of protein, TPC and FRAP given in Table 4. The protein content differs according to the purification and extraction techniques used. By means of membrane processing the protein content was found to (1.37 mg/ml)[21]. Therefore, the protein
content of the peel differs in every cultivars. The major polyphenols present in the pineapple peel
are the catechin, epicatechin, ferulic acid and gallic
acid Therefore phenolic content of the peels was found to be 31.98 mg gallic acid equivalents (GAE)/g extracts[15]. In regard with TPC[6] 9.1 mg GAE/g dry
TPC of pineapples and pineapple residues were found to be 2.75 mg GAE/g dry weight (DW). The other study[28] showed that pineapple peel
Rathnakumar et al.
– 170.93 μg/g) and further concentrated (14691.5 μg/g – 2788.6 μg/g) which was comparatively found
to possess less phenolic content from this present
study of the UAE treatment. Ferric reducing power assay shows the ability of the extract to donate electron to ferric ion, reducing it into ferrous ion. The ferulic acid present in the pineapple peel mainly contributed to the antioxidant[31]. FRAP value was
found to be (6.9μM TE/g) and (2.5 μM TE/g) using
solvent such as methanol: acetone and ethanol respectively[17]. The effect antioxidant activity may
differ according to the type and complexity of the sample used for study.
The ANOVA was also performed to get the significant difference between each variable on the protein, phenolic content and antioxidant from the extraction process. It showed that in case of
protein time, amplitude, ethanol concentration
used was not significant, and as the value for the model term was greater than 0.100 which showed it wasn’t significant. In extraction of TPC, there
was a significant difference in the amplitude
(p<0.05) where time and ethanol concentration has no significant difference. In the determination of antioxidant activity, there was no significant difference shown between the variables used and so is the model. But the lack of fit for the model
is significant. The optimised condition obtained was time 10 min, 100% amplitude and ethanol concentration 28% gave 4166.11 μg/g 8054.77 μg GAE/g 124.7388 μmol Fe(II)/g with desirability 0.837.
In the extraction process the interaction between the independent variable and the responses Time (A), Amplitude (B) and ethanol concentration (C) are given as multiple regression equation which represents an empirical relation is given below:
Y1= 4041.51 + 183.137 A + 320.011B + 165.169 C – 248.517 AB + 129.992 AC –10.705 BC – 101.062 A2 – 159.175 B2 – 62.065C2 …(1)
Y2 = 6264.88 – 243.705 A + 1180.41B + 542.853C – 600.603AB + 177.873AC + 542.853BC – 239.858 A2 – 251.408B2 – 699.549 C2 …(2)
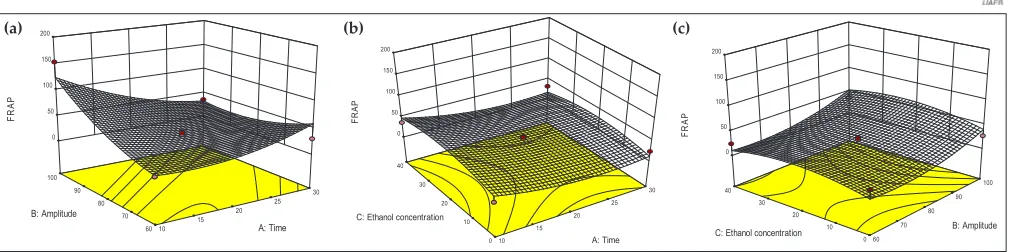
Y3= 35.5567 – 13.68A + 19.4075B + 4.4825C – 32.175AB – 2.075AC + 1.68BC …(3)
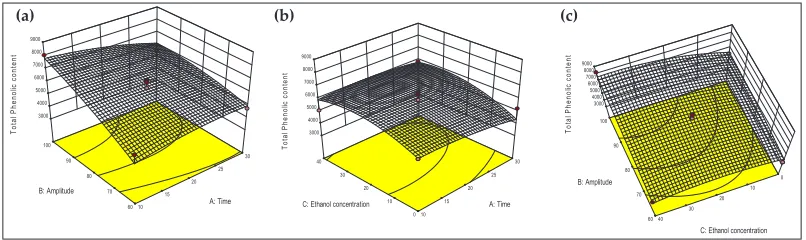
Here Y1,Y2,Y3 represent the protein content, phenolic
content and FRAP content of peel and A, B, C are the actual values of the independent variables. The optimised condition and the three-dimensional response graph was generated in which one variable is fixed and other two were varied to show the interactive effects. The plots are show in Fig. 1, 2 & 3. 60 70 80 90 100 10 15 20 25 30 2500 3000 3500 4000 4500 5000 pr ot ei n A: Time B: Amplitude 0 10 20 30 40 10 15 20 25 30 2500 3000 3500 4000 4500 5000 pr ot ei n A: Time
C: Ethanol concentration 0
10 20 30 40 60 70 80 90 100 2500 3000 3500 4000 4500 5000 pr ot ei n B: Amplitude C: Ethanol concentration
(a) (b) (c)
Fig. 1: Response surface plots showing effect of time (min), amplitude (%) and ethanol concentration (%) on protein content (µg/g of crude extract) from pineapple peel using UAE treatment (a) Time & amplitude (b) Ethanol concentration & time (c) Ethanol
concentration & amplitude
60 70 80 90 100 10 15 20 25 30 3000 4000 5000 6000 7000 8000 9000 Tot al P hen ol ic co nt en t A: Time B: Amplitude 0 10 20 30 40 10 15 20 25 30 3000 4000 5000 6000 7000 8000 9000 To ta l P henol ic cont ent A: Time C: Ethanol concentration
0 10 20 30 40 60 70 80 90 100 3000 4000 5000 6000 7000 8000 9000 To tal P henol ic cont ent B: Amplitude
C: Ethanol concentration
(a) (b) (c)
Optimization of Ultrasonic Assisted Extraction of Bioactive components from different Parts of Pineapple Waste
Extraction of bioactive active components from core of pineapple
In this study under UAE from the Table 4, the protein content ranged from 3581.69 – 6612.83 μg/g the core of the Nang Lae pineapple has a
protein content of 45.4mg/100g and Phu Lae has a
27.1mg/100 g[12]. The protein content depends on
the extraction buffer ph, temperature and strength of extraction buffer. Therefore the protein content was found to be 12.6mg/ml[4]. From Table 4, tpc
content was 9340.26 – 24678.7 μg GAE/g. Extracting the phenolic content in the core by using ethanol as solvent was nearly 10mg/g GAE[30]. Therefore from our study UAE treatment gave comparatively
higher phenolic content. This is because UAE uses sound waves at frequencies above the range audible to humans (=20 kHz) to disrupt the plant cell wall thereby enhancing solvent penetration into the plant material and facilitating the release of extract and giving higher extraction efficiency[16]. The FRAP
value of the pineapple core was found to be 2.01 mmol/100[10]. In our study the FRAP value ranged
from (349.93 – 502.3 μmol Fe(II)/g. The ferulic acid which is most abundant hydroxycinnamic acid is present in the plant cell walls has contributed a lot to the antioxidant activity.
The ANOVA portrayed that there was no significant difference on each variable such the time, amplitude
and ethanol concentration on the protein, phenolic
content and antioxidant content from the extraction
process, and so is the model and the lack of fit
as (p>0.05). The optimised condition of core for the maximum yield of protein 4860.58 μg/g, TPC 20192.19 μg GAE/g and 438.60 μmol Fe(II)/g for Time 16( min), amplitude 100%, ethanol concentration 36%.
Therefore, the predicted equation shows an empirical relation between the variables and responses is obtained using multiple regression equation
Y4= 4084.33 – 63.4663 A – 295.161B – 252.34C – 391.507AB – 108.585AC + 792.195BC – 124.384 A2 – 215.126 B2 – 325.239C2 …(4)
Y5 = 20565.3 + 1648.76A + 2784.71B + 1116.31 C + 738.046 AB – 612.15 AC + 1999.3 BC – 1738.66A2 – 2910.99B2 – 2835.91 C2 …(5)
Y6 = 425.493 – 26.5175A + 33.0587 B – 14.8438C + 17.4375AB + 8.6125 AC – 9.445BC –
11.9367 A2 – 17.5408B2 – 23.2492 * C2 …(6) Here Y4,Y5, Y6 represent the protein content, phenolic
content and FRAP content of core and A, B, C are the actual values of the independent variables.
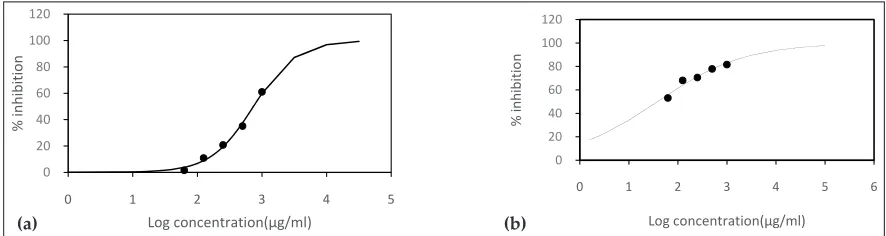
Determination of DPPH radical scavenging activity of the pineapple peel and core
The antioxidant capacity is a significant indicator as health promoter in many fruits and vegetables peels. It’s widely used to detect antiradical activity of different samples, due to its sensitivity to lower
concentrations of active principles from natural
source. Different concentration of each sample (1000 μg/ml, 500 μg/ml, 250 μg/ml and 125 μg/ml) was prepared and the % inhibition was determined. The IC50 value was determined using the 1/Y2-weighted non-linear regression; log (inhibitor concentration) vs. normalized response model with a variable slope. The Data analysis was obtained using Graph Pad Prism® version 6.01 (San Diego, US) is given in table below. The lower IC50 value exhibits a higher antioxidant potential, in our study the pineapple
core has lower IC50 value of 38.65 μg/ml which depicts higher antioxidant potential is present in the core compared to the peel.
60 70 80 90 100
10 15
20 25
30 0
50 100 150 200
FR
AP
A: Time B: Amplitude
0 10 20 30 40
10 15
20 25
30 0
50 100 150 200
FR
AP
A: Time C: Ethanol concentration
0 10 20 30 40
60 70
80 90
100 0
50 100 150 200
FR
AP
B: Amplitude C: Ethanol concentration
(a) (b) (c)
Rathnakumar et al. 60 70 80 90 100 10 15 20 25 30 3000 4000 5000 6000 7000 prot ei n A: Time
B: Amplitude 0
10 20 30 40 10 15 20 25 30 3000 4000 5000 6000 7000 pr ot ei n A: Time C: Ethanol concentration
0 10 20 30 40 60 70 80 90 100 3000 4000 5000 6000 7000 pr ot ei n B: Amplitude C: Ethanol concentration
(a) (b) (c)
Fig. 4: Response surface plots showing effect of time (min), amplitude (%) and ethanol concentration (%) on protein content (µg/g of crude extract) from pineapple core (a) Time & amplitude (b) Ethanol concentration & time (c) Ethanol concentration & amplitude
60 70 80 90 100 10 15 20 25 30 5000 10000 15000 20000 25000 TPC A: Time B: Amplitude 0 10 20 30 40 10 15 20 25 30 5000 10000 15000 20000 25000 TP C A: Time C: Ethanol concentration
0 10 20 30 40 60 70 80 90 100 5000 10000 15000 20000 25000 TP C B: Amplitude C: Ethanol concentration
(a) (b) (c)
Fig. 5: Response surface plots showing effect of time (min), amplitude (%) and ethanol concentration (%) on phenolic content (µg of GAE/g) from pineapple core using UAE treatment (a) Time & amplitude (b) Ethanol concentration & time (c) Ethanol
concentration & amplitude
60 70 80 90 100 10 15 20 25 30 300 350 400 450 500 550 FR AP A: Time B: Amplitude 0 10 20 30 40 10 15 20 25 30 300 350 400 450 500 550 FRA P A: Time C: Ethanol concentration
0 10 20 30 40 60 70 80 90 100 300 350 400 450 500 550 FR AP B: Amplitude C: Ethanol concentration
(a) (b) (c)
Fig. 6: Response surface plots showing effect of time (min), amplitude (%) and ethanol concentration (%) on antioxidant content (µg of GAE/g) from pineapple core using UAE treatment (a) Time & amplitude (b) Ethanol concentration & time (c) Ethanol
concentration & amplitude
0 20 40 60 80 100 120
0 1 2 3 4 5
% inhibition Log concentration(µg/ml) 0 20 40 60 80 100 120
0 1 2 3 4 5 6
% in hi bi tio n Log concentration(µg/ml) (a) (b)
Optimization of Ultrasonic Assisted Extraction of Bioactive components from different Parts of Pineapple Waste
UAE treatment is more significant in determining the antioxidant capacity this because of the strong disruption of the cells which helps in squeezing out the bioactive compounds from the cells efficiently. The estimated DPPH inhibition of peel and core
of pineapple at different concentrations, using nonlinear regression was depicted in the form of
graph.
Table 5 : IC50 value of peel and core
UAE treatment of
sample
IC 50
(µg/ml) Hill slope R 2
peel 738.3 1.311 (0.9870 -
1.634) 0.9918
core 38.65 0.4873 (0.2563
-0.7182) 0.9447
Determination of Bromelain activity
Bromelain activity was determined using casein
digestion method. From our study it was found that, after purification with acetone and dialysis the
bromelain activity and purification fold is given in Table 6. The enzyme activity was much dependent on the extractant solvent used and different varieties of pineapple gave different results[12] therefore for
the distilled water as solvent NL variety of peel gave a activity of 327.71(units/ml ) the same PL variety gave 443.66 units/ml. From our study using ethanol as extracting solvent the activity of peel and core was found to be 131 ± 0.025units/ml and 116.25 ±0.405 units/ml with a fold purification of 1.25 and 1.17 respectively. The bromelain activity depends on the extraction buffer, temperature and the purification techniques used, from the study
of[4] the activity of core bromelain ranged from 155
– 130 cdu/ml depending on the temperature 5 to 40 °C. And therefore the purification fold was in the range (2-5 folds) depending on the concentration of acetone used.
Protein patterns
The molecular weight of the protein of the crude waste mixture which contains (57% peel, 28%
Table 6: Bromelain activity for the optimised condition of the pineapple peel and core
Before purification After purification
Protein (mg/ml)
Bromelain
activity (unit/ml) activity (unit/Specific ml)
Bromelain activity (units/
ml)
Protein (mg/
ml) Specific activity
(unit/ml)
Fold purification
UAE peel 4.25± 0.005 94.20 ±0.05 22.14 131 ± 0.025 4.716 ± 0.022 27.78 1.25
UAE core 3.65 ± 0.009 93.13 ± 0.005 25.61 116.25 ±0.405 3.886 ± 0.043 29.85 1.17 Values are the means ± standard deviation (SD) obtained from the triplicate data; Specific Activity: total enzyme activity/ total protein; Fold Purification: Specific activity after purification/ initial specific activity after purification
1 2 3
14
24 23 kDa
29 36
45 66
Rathnakumar et al.
crown and 15 % core) has between 11.7 and 26.9
kDa[21]. The protein pattern of the peel from different
cultivars ranged from 23- 28 kDa[12]. From the Fig.
8, the protein pattern was found to be in the range of 23 kDA for both peel and core. Therefore, the
activity staining for the proteolytic activity was
positive and confirmed the presence of bromelain.
CONCLUSION
The Box–Behnken Design (BBD) was demonstrated to be an effective and reliable technique for investigating the extraction of bioactive compound. The bromelain activity for the optimized condition for the peel and core was found to be 94.20 ±0.05 (unit/ml) and 93.13 ±0.005 (unit/ml) for the pineapple peel and core respectively. Therefore, after purification, 131 ± 0.025 units/ml and 116.25 ±0.405 with specific activity of 27.78 and 29.85 with fold purification 1.25 and 1.17. The molecular weight of protein in both peel and core was found to be 23 KDa. Staining was done to confirm the presence of bromelain which depicted the result to be positive. I C50 value proved that core had higher
antioxidant potential than the peel. Therefore from
our study we can conclude that UAE is one of the
quickest method for obtaining the bioactives and the obtained bromelain can be applied in meat tenderization, baking process and also it can be used in various pharmaceutical industry.
ACKNOWLEDGMENTS
We would like to thank AIT and Bio lab for funding
the research and also ‘‘Prime industry ‘‘for giving
raw materials.
REFERENCES
1. Bhattacharyya, B.K. 2008. Bromelain: An overview. Indian Journal of Natural Products and Resources,7(4): 359–363. 2. Bitange, N.T., Wang, Z., Xu, S.Y. and Zhang, W. 2008.
Therapeutic application of pinapple protease (Bromelain): A Review. Pakistan Journal of Nutrition,7(4), 513–520. 3. Bradford, M.M. 1976. A rapid and sensitive method
for the quantitation of microgram quantities of protein utilizing the principle of protein-dye binding. Analytical
Biochemistry,72(1–2): 248–254.
4. Chaurasiya, R.S. and Umesh Hebbar, H. 2013. Extraction of bromelain from pineapple core and purification by RME and precipitation methods. Separation and Purification
Technology,111: 90–97.
5. da Silva, D.I.S., Nogueira, G.D.R., Duzzioni, A.G. and Barrozo, M.A.S. 2013. Changes of antioxidant constituents in pineapple (Ananas comosus) residue during drying process. Industrial Crops and Products,50: 557–562. 6. de Oliveira, A.C., Valentim, I.B., Silva, C.A., Bechara,
E.J.H., Barros, M.P. de, Mano, C.M. and Goulart, M.O.F. 2009. Total phenolic content and free radical scavenging activities of methanolic extract powders of tropical fruit residues. Food Chemistry,115(2): 469–475.
7. Dhanasekaran, D., Lawanya, S., Saha, S., Thajuddin, N. and Panneerselvam, A. 2011. Production of Single Cell Protein from Pineapple Waste. Innovative Romanian Food
Biotechnology,8: 26–32.
8. Dhanani, T., Shah, S., Gajbhiye, N.A. and Kumar, S. 2013. Effect of extraction methods on yield, phytochemical constituents and antioxidant activity of Withania somnifera. Arabian Journal of Chemistry.
9. García-Carreño, F.L., Dimes, L.E. and Haard, N.F. 1993. Substrate-gel electrophoresis for composition
and molecular weight of proteinases or proteinaceous
proteinase inhibitors. Analytical Biochemistry. https://doi. org/doi: 10.1006/abio.1993.1457
10. Guo, C., Yang, J., Wei, J., Li, Y., Xu, J. and Jiang, Y. 2003. Antioxidant activities of peel, pulp and seed fractions of common fruits as determined by FRAP assay. Nutrition Research,23(12): 1719–1726.
11. Jain, S. and Anal, A.K. 2016. Optimization of extraction
of functional protein hydrolysates from chicken egg
shell membrane (ESM) by ultrasonic assisted extraction (UAE) and enzymatic hydrolysis. LWT - Food Science and
Technology, 69: 295–302.
12. Ketnawa, S. 2011. Application of Bromelain Extract for Muscle Foods Tenderization. Food and Nutrition Sciences, 2: 393–401.
13. Ketnawa, S., Rawdkuen, S. and Chaiwut, P. 2010. Two phase partitioning and collagen hydrolysis of bromelain from pineapple peel Nang Lae cultivar. Biochemical Engineering Journal, 52(2–3): 205–211.
14. Kukrić, Z.Z., Topalić-Trivunović, L.N., Kukavica, B.M., Matoš, S.B., Pavičić, S.S., Boroja, M.M. and Savić, A.V. 2012. Characterization of antioxidant and antimicrobial activities of nettle leaves (Urtica dioica L.). Acta Periodica Technologica,43: 257–272.
15. Li, T., Shen, P., Liu, W., Liu, C., Liang, R., Yan, N. and Chen, J. 2014. Major Polyphenolics in Pineapple Peels and their Antioxidant Interactions. International Journal of Food Properties,17(8): 1805–1817.
16. Ma, Y.Q., Chen, J.C., Liu, D.H. and Ye, X.Q. 2009. Simultaneous extraction of phenolic compounds of citrus peel extracts: Effect of ultrasound. Ultrasonics
Sonochemistry,16(1): 57–62.
Optimization of Ultrasonic Assisted Extraction of Bioactive components from different Parts of Pineapple Waste
18. Mason, T.J., Paniwnyk, L. and Lorimer, J.P. 1996. The uses of ultrasound in food technology. Ultrasonics
Sonochemistry, 3(3): S253–S260.
19. Minjares-Fuentes, R., Femenia, A., Garau, M.C., Meza-Velázquez, J.A., Simal, S. and Rosselló, C. 2014. Ultrasound-assisted extraction of pectins from grape
pomace using citric acid: A response surface methodology
approach. Carbohydrate Polymers,106(1): 179–189. 20. Murachi, T. 1976. Part B: Proteolytic Enzymes. Methods in
Enzymology,45(1892): 475–485.
21. Nor, M.Z.M., Ramchandran, L., Duke, M. and Vasiljevic, T. 2015. Characteristic properties of crude pineapple waste extract for bromelain purification by membrane processing. Journal of Food Science and Technology,52(11): 7103–7112.
22. Phongthai, S., Lim, S.T. and Rawdkuen, S. 2016. Optimization of microwave-assisted extraction of rice bran protein and its hydrolysates properties. Journal of Cereal Science,70: 146–154.
23. Praveena, J. 2014. International Journal of Pharma and Bio Sciences ISSN comparative study of phytochemical screening and antioxidant capacities of vinegar made from peel and fruit of pineapple (Ananas comosus L .), 5(4): 394–403.
24. Qiu, P., Cui, M., Kang, K., Park, B., Son, Y., Khim, E., Jang, M., Khim, J., 2014. Application of Box–Behnken Design
with response surface methodology for modeling and
optimizing ultrasonic oxidation of arsenite with H2O2. Central Eur. J. Chem.,12: 164–172.
25. Rosario, R.M. Del, and Palmes, N.D. 2012. Antioxidative
Capacities of Phytochemicals in Selected Fruit Peels, 10: 35–46.
26. Secor, E.R., Carson IV, W.F., Singh, A., Pensa, M., Guernsey, L.A., Schramm, C.M. and Thrall, R.S. 2008. Oral bromelain attenuates inflammation in an ovalbumin-induced murine model of asthma. Evidence-Based Complementary and Alternative Medicine,5(1): 61–69.
27. Sigma. 2004. Technical bulletin ammonium sulfate solution, 4.1M, 1–4.
28. Singh, A., Sabally, K., Kubow, S., Donnelly, D.J., Gariepy, Y., Orsat, V. and Raghavan, G.S.V. 2011. Microwave-assisted extraction of phenolic antioxidants from potato peels. Molecules,
16(3): 2218–2232.
29. Sousa, B.A. and Correia, R.T.P. 2012. Phenolic content, antioxidant activity and antiamylolytic activity of extracts obtained from bioprocessed pineapple and guava wastes.
Brazilian Journal of Chemical Engineering,29(1): 25–30.
30. Upadhyay, A., Lama, J.P. and Tawata, S. 2013. Utilization of Pineapple Waste: A Review. Journal of Food Science and
Technology Nepal,6(2004): 10–18.