PhD thesis
Joshua Zonca
Gaze data reveal adaptive
mechanisms of strategy generation in
judgment and decision making
Advisor: Prof. Giorgio Coricelli
Co-advisor: Luca Polonio
Doctoral Program in Cognitive and Brain Sciences (31st cycle)
Dissemination of the experimental work included in this thesis
Study 1: Accepted in Journal of Experimental Psychology: Learning, Memory and Cognition as “Zonca J, Coricelli G, Polonio L. Gaze data reveal individual differences in relational representation processes”.
Study 2: Resubmitted to Judgment and Decision Making as “Zonca J, Coricelli G, Polonio L. Disclosing the link between cognitive reflection and sophistication in strategic interaction: the crucial role of game representation”.
Study 3: Accepted in Journal of the Economic Science Association as “Zonca J, Coricelli G, Polonio L. Does exposure to alternative decision rules change gaze patterns and behavioral strategies in games?”
Acknowledgments
Table of contents
Abstract. . . .7
1. General introduction. . . 9
2. Study 1: Gaze data reveal individual differences in relational representation processes. . .17
2.1. Introduction. . . 17
2.2. Experiment 1 . . . 21
2.2.1. Methods . . . 21
2.2.2. Hypotheses. . . .32
2.2.3. Results and discussion. . . .34
2.3. Experiment 2 . . . 44
2.3.1. Methods. . . 45
2.3.2. Hypotheses. . . .47
2.3.3. Results and discussion. . . .48
2.4. Experiment 3 . . . .54
2.4.1. Methods . . . .54
2.4.2. Hypotheses . . . 60
2.4.3. Results and discussion . . . .61
2.5. General discussion . . . 66
3. Study 2: Disclosing the link between cognitive reflection and sophistication in strategic interaction: the crucial role of game representation. . . . .71
3.1. Introduction. . . .71
3.2. Experiment 1 . . . 75
3.2.1. Methods . . . .75
3.2.2. Hypotheses. . . .80
3.2.3. Results. . . . . . . .82
3.2.4. Discussion . . . 95
3.3. Experiment 2. . . .96
3.3.1. Methods . . . .96
3.3.3. Results . . . .99
3.3.4. Discussion. . . .108
3.4. General discussion. . . .109
4. Study 3: Does exposure to alternative decision rules change gaze patterns and behavioral strategies in games? . . . .115
4.1. Introduction . . . 115
4.2. Methods. . . .117
4.3. Results . . . .121
4.4. Discussion . . . .125
5. Concluding Discussion . . . .127
6. References . . . .133
7. Appendices . . . .153
7.1. Study 1. . . .153
7.1.1. Experiment 1 . . . .153
7.1.2. Experiment 2 . . . .159
7.1.3. Experiment 3 . . . .162
7.2. Study 2 . . . .164
7.2.1. Experiment 1 . . . .164
7.2.2. Experiment 2 . . . .168
Abstract
1. General introduction
Information-processing and strategy generation in judgment and decision making
build an exhaustive representation of the set of potential actions and outcomes available to themselves. Individual differences in these information-processing functions may explain and predict a considerable part of the behavioral heterogeneity generally observed in judgment and decision making tasks. This perspective shifts the research focus on the exploration of the processes of encoding and representation of available information underlying deviations from normative models of reasoning and decision making (Ball, 2013a; Konovalov & Krajbich, 2016).
Strategy generation in interactive contexts
In several decision settings, the outcomes of our actions depend also on the choices of other agents who may be guided by different incentives and goals. These interactive decision settings have been
extensively studied using multi-player matrix games. Matrix games consist in a set of incentives (i.e.
payoffs) and a rule set for each player: the combination of players’ decisions therefore determines
their respective outcomes. In this context, it is important to understand others’ goals and intentions
them. These hierarchical models indeed offer an elegant description of the heterogeneity observed in interactive decisions, but do not provide a cognitive explanation about the drivers of this variability. For instance, it is not clear if agents applying few steps of strategic thinking do believe that the other players are bounded rational and therefore best-respond to this belief, or they are bounded rational themselves (Goodie et al., 2012; Grosskopf & Nagel 2008). In the former case, players would use a meta-cognitive selection rule that adapts to the predicted level of the counterpart(s), whereas in the latter case the level of strategic sophistication would be bounded by cognitive factors. Concerning this “cognitive” hypothesis, it must be acknowledged that interactive games are comparable to any other decision task where agents need to take into consideration several interrelated pieces of information to form an exhaustive representation of the contingencies in the environment. Specifically, agents should consider their own incentives, the ones of the counterpart(s), and integrate them in a comprehensive representation of the interactive problem. This process of generation of a representation of the interactive scenario sustains recursive reasoning mechanisms of evaluation and prediction of others’ actions and beliefs and constitutes the mean by which strategic actions are implemented (Hedden & Zhang, 2002). Coherently, if agents do not incorporate specific chunks of
strategies in absence of informative external cues. Importantly, as we will see in the next paragraph, both hypotheses can be interpreted in terms of inter-individual variability in cognitive abilities.
The cognitive factors underlying strategy generation
If individuals generate different representations and strategies in complex tasks, it is important to explore the potential sources of this heterogeneity. In particular, we may ask why some agents implement less sophisticated strategies and choices than others.
On the one hand, the psychology literature extensively relied on dual-process theories describing the existence of two different information-processing systems, one intuitive and one deliberative, often referred to as System 1 (intuition) and System 2 (deliberation) (Evans, 2003; Kahneman, 2003; Stanovich & West, 2000). The operations of System 1 are generally seen as automatic, fast, associative, implicit and effortless. System 2 is serial, slower, effortful, rule-governed and
deliberately controlled (Kahneman, 2003). Although behavior is generally determined by both
systems, decisions and judgments can be dominated by one system’s processes (Betsch & Kunz,
2008). For example, although System 2 is involved in some measure in all types of judgment, in some
instances of intuitive judgment it may be dominated by System 1. Several features of a decision
context may modulate the selection of intuitive or deliberative decision strategies (Hammond et al.,
1987). Moreover, it has been suggested that between-subject heterogeneity in the activation of
In line with this view, we can hypothesize that between-subject differences in information-processing strategies are rather malleable, meaning that the presence of some type of endogenous or exogenous cue providing meta-cognitive feedback about the efficacy of the current strategy may trigger the exploration of new alternative strategies. This interpretation is consistent with two-stage reasoning process theories (e.g. Evans, 1984, 2006) suggesting that differences in reasoning processes arise from the emergence of analytical and deliberative processing that overcomes initial intuitive strategies (Ball, 2013b).
On the other hand, we can hypothesize that the implementation of unsophisticated representations and strategies is driven by cognitive inability, which may reflect limitations in more stable cognitive traits such as fluid intelligence or working memory. In other words, the processes of information encoding and representation required to comprehensively understand the interactive nature of games may be overly complex or cognitively costly for some players, who may decide to decrease cognitive load and complexity by forming a simplified representation of the game structure. In line with this latter hypothesis, the presence of cues revealing the existence of better alternative strategies should not allow a successful switch towards more sophisticated behavior.
Using process-tracing to investigate strategy generation in judgment and decision making
advantage of these research paradigms concerns the ability to explore the dynamical properties of reasoning and decision processes, rather than treating them as static mechanisms (Konovalov & Krajbich, 2016). Using this approach, we can reach a deeper understanding of the process underlying the choice itself, by detecting the emergence of different reasoning steps characterizing the resolution procedure, or detecting temporal patterns in the process of information accumulation and manipulation underlying decisions. A second crucial benefit of process-tracing techniques concerns the capability of disclosing endogenous behavioral heterogeneity. For instance, we may observe the emergence of distinct strategies in the resolution of a task even if they lead to the same outcome. Another important feature of process-tracing research consist in the possibility to test reasoning and decision theories by comparing theory predictions and observed pattern of information acquisition during task resolution.
accuracy which piece of information is being processed in a specific time point (Ball, 2013a). Moreover, fixation duration provides a robust index of depth of information processing or cognitive effort, with longer durations indicating greater processing difficulty (Liversedge et al. 1998; Velichkovsky et al., 1999, 2002). Furthermore, saccades are generally thought to reflect a direct an obligatory consequence of overt attentional shifts (e.g., Deubel & Schneider, 1996; He & Kowler, 1992; Hoffman & Subramaniam, 1995). These top-down attentional shifts arise when the processing of the fixated item reaches some critical level (i.e. the item has been successfully encoded), signaling to the visual system the need to prepare a motor program enabling a saccade towards the new target (Ball, 2013a). In sum, extensive evidence suggests the existence of a tight coupling between eye movements and information processing, highlighting eye-tracking as a valid tool to explore fine-grained mechanisms underlying higher cognition.
The present work
2. Study 1: Gaze data reveal individual differences in relational
representation processes
2.1 Introduction
for responding optimally to every predictable environmental contingency. Although this behavioral difference is reminiscent of the distinctions between rule abstraction and memorization in category learning (McDaniel et al., 2014), proactive and reactive cognitive control (Braver, 2012), model-based and model-free learning (Daw et al., 2005, 2011; Konovalov & Krajbich, 2016) and problem-model and direct-translation strategies in problem-solving (Boote et al., 2016; Mayer & Hegarty, 1996), it is still unclear how agents build internal contingency models starting from available relational knowledge. In particular, we should understand whether distinct processes of relational representation do exist, as well as the cognitive sources of this heterogeneity. In order to explore these issues, we ran three different eye-tracking experiments.
relational set, since they do not aim to build a comprehensive model of the relational structure of the environment.
Results of a cluster analysis on early gaze data in the Representation phase confirmed the existence of two distinct groups of participants that respectively exhibited sophisticated and unsophisticated behaviors, and showed marked differences in task performance.
In order to explore the cognitive mechanisms driving heterogeneity in representation behavior, in Experiment 2 we collected data on a new pool of participants performing the Relational-inference task in two different sessions (pre- and post- treatment). In the pre-treatment session, participants performed the Relational-inference task with the same modalities of Experiment 1. At the beginning of the post-treatment session, the same participants were informed about the existence of sophisticated and unsophisticated strategies and their respective average efficiencies. Then they were asked to complete again the Relational-inference task in the way they preferred. We therefore compared the representation strategy implemented by participants in the two sessions. We found a notable strategy switch from the unsophisticated towards the sophisticated strategy, suggesting that the implementation of a specific strategy is not driven by cognitive capacity or motivation, but rather by strategy generation mechanisms.
encoding, integration and representation of relational information between hypothetical states of the world.
Cognitive drivers of sophisticated and unsophisticated representation processes
To date, we lack evidence about the contribution of cognitive abilities in modulating representation-building mechanisms. We can hypothesize that high working memory is necessary for the generation of sophisticated representations, since it constitutes the workspace where relational representations are constructed (Doumas et al., 2008; Halford et al., 2010), and guarantees that agents can build, retain and update representations (Oberauer et al., 2009). However, it is possible that working memory sustains active maintenance and manipulation of representations without directly determining the type of representation that is generated. To investigate the role of working memory in these processes, we collected four different working memory measures: digit span forward and backward (Wechsler, 2008) and the n-back task (in two versions of increasing difficulty, 2-back and 3-back, Kirchner et al., 1958). The forward version of the digit span assesses simple short-term maintenance and recall of elements in working memory, while the backward version requires the additional component of mental manipulation of digits (Baddeley, 1996; Monaco et al., 2013). The n-back task tests the ability to maintain and update a dynamic set of information, targeting processes related to cognitive control, such as inhibition and interference resolution (Kane, Conway, Miura, & Colflesh, 2007).
of fluid intelligence, we tested participants on the Raven Advanced Progressive Matrices Test (APM; Raven et al., 1998).
Finally, we investigated whether cognitive reflection, measured by the Cognitive Reflection Test (CRT; Frederick, 2005), could be a potential candidate to predict the existence of distinct representation processes. The CRT assesses the individual tendency to implement one of two types of cognitive process: those that are slower and more reflective and those executed rapidly with little conscious deliberation. In particular, a high cognitive reflection level reflects the ability to reason exhaustively about the characteristics of a problem, inhibiting intuitive but incorrect responses. Conversely, a low cognitive reflection level indicates an aptitude for generating heuristics on salient information at the expense of problem understanding (Toplak et al, 2011; 2014). In recent years, several studies underlined the relevance of the CRT beyond the classical deliberation-intuition trade-off (Baron et al., 2014; Mata et al., 2013; Szaszi et al., 2017). In particular, it has been linked to the tendency to use more thorough search processes (Cokely and Kelley, 2009; Cokely et al., 2009) and to the ability to accurately process and represent task-relevant information (Mata et al., 2014; Sirota et al., 2014). Furthermore, recent evidence pointed out that the CRT is related to analytical thinking (Hoppe & Kusterer, 2011), behavioral biases (Oechssler et al., 2009), probabilistic reasoning (Koehler & James, 2010; Liberali et al., 2012) and rule abstraction (Don et al., 2016), suggesting a broader involvement of cognitive reflection in intelligent behavior.
2.2 Experiment 1
2.2.1 Methods
Relational-inference task
state (e.g. B) upon the occurrence of another state (e.g. A). Importantly, conditional relations could be linked by transitive relations (for example, given the two conditionals “if A then B” and “if B then C”, you can conclude that “if A then C”). Henceforth, we will refer to the three conditional statements as C1, C2 and C3. Four abstract symbols (square, circle, triangle and cross) were used to represent states (Figure 1.1, left panel). Using this set of items, we created 80 different relational sets. From all the possible combinations of symbols and relations, we excluded those including a specific symbol simultaneously repeated in all three antecedents or in all three consequents of the conditionals. Each configuration could contain 0, 1, 2 or 3 transitive relations connecting conditionals in up-down or down-up direction.1
Each trial of the task consisted of two phases: Representation and Response. In the Representation phase (Figure 1.1, left panel), participants had 9 seconds to learn all the relevant pieces of information in a series, before their disappearance.2 In the Response phase, one of the symbols presented in the Representation phase (source state) was highlighted, meaning that that state had indeed occurred. Given this novel information and the conditional relations shown in the Representation phase, participants had to select all the states (i.e. symbols) that necessarily followed the occurrence of the source state (Figure 1.1, right panel). There was no delay between the two phases.
1 Up-down transitive relations linked, by transitive property, the antecedent of a conditional located in an upper line (C1
or C2) to the consequent of a conditional in a lower line (C2 or C3). Conversely, down-up transitive relations linked the
antecedent of a conditional located in a lower line (C2 or C3) to the consequent of a conditional in an upper line (C1 or
C2). This aspect was carefully explained to participants to make sure they did understand that transitive relations could
link conditionals both in up-down and down-up orders.
2 The choice of the actual length of the Representation phase (9 seconds) was based on previous pilot experiments in
which we tested and ensured that participants had sufficient time to encode and memorize relational information.
Moreover, participants performed a visual search task that could control for differences in visual processing speed in this
In the Response phase, each of the four symbols was paired with a specific response key. An intuitive interface supported the Response phase (Figure 1.1, right panel). Key-symbol associations remained stable along the entire experiment.3 Symbols could be pressed in any order. Participants had the opportunity to re-press the same response-key to de-select or re-select a specific symbol. Participants were instructed that de-selecting and re-selecting symbols would not have affected their score: in fact, final selection was confirmed by pressing the space bar, and only this response was taken into account for evaluation. In sum, a trial was classified as correct if participants selected all and only the states that necessarily followed the occurrence of the source state, and incorrect in all other cases. Participants had unlimited time in the Response phase, and they were instructed that reaction times would not influence their final score.
3 We checked for possible effects due to the position of symbols and corresponding keys in the response interface and we
did not find any effect of source state (see Table S1.1 in section 7.1.1, Appendices).
Figure 1.1. Relational-inference task. In the Representation phase (left panel), participants observed for 9
seconds three conditional statements (C1, C2, C3) connecting abstract symbols (states). In the Response
phase (right panel), they had to select all the states that necessarily followed the occurrence of one of the
symbols presented in the Representation phase (source state, highlighted by a red square and a red selection
mark). In the current example, participants should have chosen all three remaining symbols (circle, triangle
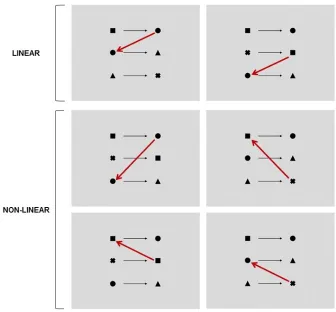
We created two different categories of relational set: linear and non-linear. In linear sets, the order of the presented triplet of conditionals was aligned with the latent relational structure (i.e. with the ordered sequence of concatenated events) (Figure 1.2, left panel). In non-linear sets, the underlying relational structure did not match with the order of the presented triplet of conditionals (Figure 1.2, right panel). The presence of inconsistent trials allowed us to disentangle sophisticated from unsophisticated representation processes: sophisticated participants should search for all possible relations between states in every potential direction and location, while unsophisticated participants should encode binary conditional rules independently of their higher-order relations.
All these aspects were carefully explained to participants with examples, control questions and training trials (we report full instructions and control questions section 7.4.1 in Appendices). In the control questions, participants were asked to make transitive inferences starting from a set of premises and a source state. In case of errors in the control questions, task and transitive properties of
Figure 1.2. Types of symbol configuration in the Relational-inference task. In linear trials (left panel), the
spatial order of conditionals (from up to down) matched the underlying relational structure (triangle à
square à cross à circle). In non-linear trials (right panel), this was not the case: in fact, the up-down
spatial order of conditionals did not match the current relational structure (triangle à square àcross à,
conditional inferences were re-explained to participants. After three consecutive errors in the control questions, participants were dismissed. Participants were provided with three 2-minute breaks (one every 20 trials). The order of trials was randomized across participants. Each trial was preceded by a fixation-point positioned in one of four possible locations outside the symbol space (Figure S1.1 in section 7.1.1, Appendices).
The task was made incentive-compatible by paying participants according to their proportion of correct responses (minimum 0, maximum 14 euros).
Visual search control task
The visual search task served as a control for individual differences in visual scan efficiency. In this task, participants had to detect a target among a variable number of distractors. They were instructed to be as accurate and fast as possible, and they were reimbursed based on a scoring formula combining accuracy and reaction times (see section 7.1.1 in Appendices)
Cognitive measures
Raven Advanced Progressive Matrices Test (APM). Participants performed the Raven Advanced Progressive Matrices Test (APM). In particular, we used a 20-minute timed version of the task, which has been shown to be an adequate predictor of the untimed APM score (Hamel & Schmittmann, 2006). Participants were paid according to the number of correct responses (20 cents for each correct response, maximum 7.20 euros).
Cognitive Reflection Test (CRT). Participants answered the three questions of the CRT without any time limit. The CRT score reflected the number of correct responses in the test.
letter matched the one observed two (in the 2-back task) or three (in the 3-back task) trials before. Each letter was presented for 1000 ms, followed by a blank screen for 1000 ms. At each trial, participants indicated their choice by pressing a response key for “match” or pressing nothing for “non-match”. In both tasks, participants were paid according to their proportion of correct responses (min 1 euro, max 3 euros for each task).
Forward and backward digit span: Participants were asked to repeat orally series of digits in the presented order (digit span forward) or in reversed order (digit span backward). They repeated increasingly long sequences of digits until they made two mistakes.
Participants and procedure
Participants were 50 students from the University of Trento, Italy (38 females, mean age 23.16, SD 2.80). The study was approved by the local ethics committee and all participants gave informed consent. Every participant took part in two experimental sessions on consecutive days. Participants performed the different experimental tasks in fixed order.
In the first experimental session, participants completed the Relational-inference task while their eye movements were registered. After completing the Relational-inference task, participants performed the Visual search control task.
Relational-inference task: eye-tracking analysis
Classification of transitions
To analyze eye movements, we defined six Regions of Interest (ROIs) in correspondence of the six symbols (see section 7.1.1 in Appendices). We classified transitions as eye movements from one ROI to the next.
We classified a transition as Transitive Transition (henceforth, Transitive-T) if it was suitable to detect a transitive relation within a relational set. More specifically, we decided to focus on those transitions connecting the consequent of a conditional relation to the antecedent of another conditional, since the compression in a single token of the repeated term allows premise integration in transitive inference (Sternberg, 1980).
We also divided transitive-Ts in linear transitive-Ts and non-linear transitive-Ts (Figure 1.3).
Representation-building and Representation-consolidation intervals
In order to individuate the type of representation process employed by each participant, we need to segregate processes purely related to the generation of representations from mechanisms associated with retention of information in working memory. In fact, within the Representation phase, we expect 1) a first stage more oriented to information acquisition, meant to build a representation of the current relational structure and 2) a second stage more dedicated to the consolidation of information in working memory, in view of the Response phase. These two stages should be marked by a peculiar difference in terms of cognitive load: the initial phase of information-search should require a lower memory load than the process of mnemonic consolidation of the final representation. Recent eye-tracking evidence highlighted a relation between computational load and fixation length: in particular, exploratory behavior is associated with short fixations, while higher-order processes are characterized by longer fixations (Graffeo et al., 2015; Velichkovsky et al., 1999, 2002). Moreover, several studies
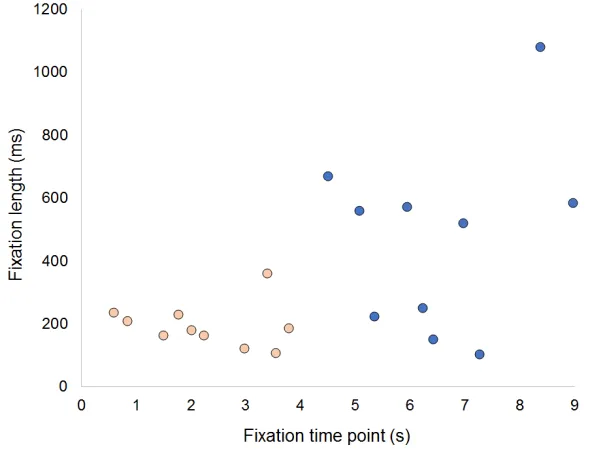
on gaze data revealed that exploratory behavior emerges in an initial phase of the visual analysis, while integration of information intervenes in a later stage (Castelhano et al., 2009; Unema et al., 2005). For these reasons, we expect the first stage to be characterized by shorter fixations compared to the second stage. Taking advantage of this property of gaze data, we performed several within-participant and within-trial cluster analyses using as variables of interest 1) the fixation length (ms) and 2) the time point of the fixation (ms).4 The cluster analysis should return, for each trial, an early cluster (first part of the trial) characterized by shorter fixations and a late cluster (second part of the trial) characterized by longer fixations. Datasets included data-points from single trials in individual participants. We used a k-means cluster analysis using an algorithm based on L1 (Manhattan) distance to individuate two clusters in each dataset.5 We performed 4000 (50 participants * 80 trials) different cluster analyses on 4000 different datasets, individuating in each trial two clusters of fixation events: an early set of fixation that we associated with the representation-building process and a later cluster of fixations related to representation-consolidation mechanisms (Figure 1.4). Henceforth, we will refer to these temporal phases as Representation-building and Representation-consolidation intervals. This method allowed us to individuate intervals based on actual eye data of single participant in single trials. This aspect is important because it allowed us 1) not to assume any arbitrary length of the two intervals, 2) to preserve between-subject variability (differences in interval lengths across participants) and 3) to maintain within-subject heterogeneity (differences in interval lengths across trial categories).
4 We used end of fixation instead of start of fixation as temporal indicator of fixation occurrence since it facilitates the
detection of the temporal switch from short to long fixations by the clustering algorithm.
5 We chose an algorithm based on L1 distance since it has been shown to be more robust to the influence of outliers
compared to higher-order distance metrics including Euclidean distance and Mahalanobis distance (Sidiropoulos, 1999;
Attentional indices
Once having isolated a time interval closely related to representation-building mechanisms (Representation-building interval), we investigated whether we could detect distinct information-search patterns expressing sophisticated and unsophisticated representation processes. We expect sophisticated participants to explore the relational space to detect higher-order transitive relations between conditionals, while unsophisticated participants should not search for transitive relations and should encode binary rules without exploring the underlying higher-order relational complexity. We therefore individuated three attentional indices that could express whether agents searched for relational information in the Representation-building interval.
These are the three indices of interest:
1) Relational Search (RS): An agent who aims to search for all possible relations in the environment should perform a considerable number of transitions in a short time window. The Relational Search
Figure 1.4. Example of cluster analysis on eye-tracking data from one trial of a single participant. Points
represent fixations, performed in precise time points within the trial (x axis) and characterized by specific
lengths (y axis). Colors of the points express the results of the cluster analysis: an early cluster of short
fixations (light orange dots, Representation-building interval) and a later set of longer fixations (blue dots,
index expresses the tendency to perform a high rate of transitions in the Representation-building interval.
We calculated individuals’ Relational Search indices dividing, for each trial, the total number of transitions by the duration of the respective representation-building interval. Then we calculated the average of these trial-by-trial search indices to obtain a single individual measure of Relational Search. The greater the index magnitude, the higher the rate of transitions carried out by the respective participant in the Representation-building interval.
2) Attentional Bias (AB): Since the relational structure of sets can be spatially expressed in different ways (e.g. linear and non-linear sets), searching for relations requires homogeneous distribution of attention in the entire relational space. Conversely, heterogeneous spread of attention might indicate a lack of purely exploratory behavior and suggest enhanced computation on the most-attended items, since agents tend to focus their attention on the elements they are processing (Devetag et al., 2016; Polonio et al., 2015). The Attentional Bias index reflects the ability to distribute attention homogeneously across ROIs during the Representation-building interval.
More specifically, the present index measures the magnitude of deviation from the perfect distribution of attention (1/6 of total fixation time for each of the 6 ROIs). The Attentional Bias index was generated by calculating, for each trial, the Euclidean distance from the expected homogeneous distribution of attention across the six ROIs to the actual distribution of fixations across the ROIs. We used the average of these trial-by-trial indices of attention to express individual indices of Attentional Bias across participants. The lower the index value, the lower the distance from perfectly homogenous distribution of attention.
Representation-building interval. The Relational Bias index expresses the ability to perform every type of transition to detect potential higher-order relations.
Since we individuated two types of linear transitive-Ts and four types of non-linear transitive-Ts (Figure 4), we calculated Relational Bias as the Euclidean distance between the actual ratio of non-linear transitive-Ts (over transitive-Ts) and the expected proportion of non-non-linear transitive-Ts (2/3 of the total number of transitive-Ts).6 The lower the index value, the lower the distance from the expected distribution of linear and non-linear transitive-Ts.
2.2.2 Hypotheses
Expected gaze patterns in sophisticated and unsophisticated participants
Sophisticated: We expect sophisticated participants to build a representation that explicitly expresses the underlying relational structure of the current relational set. In order to do this, they should search for every possible relation characterizing a specific relational set, showing a high rate of transitions in their Representation-building interval (high Relational Search), exhibiting a homogenous distribution of attention across ROIs, and implementing both linear and non-linear transitive-Ts (low Relational Bias).
Unsophisticated: In the Representation-building interval, participants implementing an unsophisticated representation process should not search for higher-order relations linking conditional rules. We expect them to acquire and memorize triplets of conditionals in sequential order, without trying to manipulate and rearrange them in a model that resembles the actual relational structure of the trial. Such lack of pure exploratory behavior in favor of a tendency to memorize non-integrated chunks of information should slow down acquisition of information, leading to a low rate
6 Number of transitive-Ts and of non-linear transitive-Ts were computed pooling data from all trials, since single trial
data in the representation-building stage contained few occurrences of transitive-Ts (especially non-linear). Using
of transitions in their representation-building phase (low Relational Search). Moreover, since sequences of only two to four digits at a time can be memorized (Cowan, 2012), they should spend a significant proportion of their representation-building phase on a subset of the six elements (high Attentional Bias). Finally, we do not predict them to perform non-linear transitive-Ts (high Relational Bias), since their strategy requires a simple up-down, left-right sequential and ordered scan path, as expected given western cultural propensity (Abed 1991; Chua et al. 2005; Ishii et al. 2011).
Performance in the Relational-inference task
In the Relational-inference task, we expect sophisticated participants to show higher average accuracy rates than unsophisticated participants, since their comprehensive model of the relational environment should allow them to respond to the occurrence of every possible state.
The performance drop of unsophisticated participants should be particularly pronounced in non-linear relational sets, since the mismatch between the latent relational structure and their internal representation should lead to a high error rate when applying transitive inference in the Response phase (Halford, 1984).
The role of working memory, fluid intelligence and cognitive reflection
cognitive measures. This would indicate that these constructs sustain correct recall of information and efficient update of information in the Response phase, when the source state is provided.
2.2.3 Results and discussion
Representation-building and Representation-consolidation intervals
To separate Representation-building and Representation-consolidation intervals, we run 4000 independent k-means cluster analyses on within-participant and within-trial fixation data using fixation length and time point of fixation as variables. On average, datasets included 22.5 data-points (fixations). The average time boundary between the two intervals was 4.37 seconds (SD = 0.23). Importantly, average fixation length in the Representation-building interval was significantly lower than the one in the Representation-consolidation interval (Representation-building, mean = 261.77 ms, SD = 53.92; Representation-consolidation, mean = 308.87 ms, SD = 92.06; Wilcoxon matched-pairs signed-rank test, z = 5.613, effect size (r) = 0.79, p < .001), suggesting that they express two distinct types of process.
Disclosing sophisticated and unsophisticated representation processes
In order to investigate the existence of two distinct representation processes, we conducted a between-subject k-means cluster analysis on our three attentional indices. To estimate the optimal number of clusters in our dataset, we computed the gap statistics (Giancarlo et al., 2008; Tibshirani et al., 2001). Results revealed that k = 2 was the best solution (Table S1.2 in section 7.1.1 in Appendices), suggesting that the heterogeneity in the three attentional indices was best explained by two types of behavior.
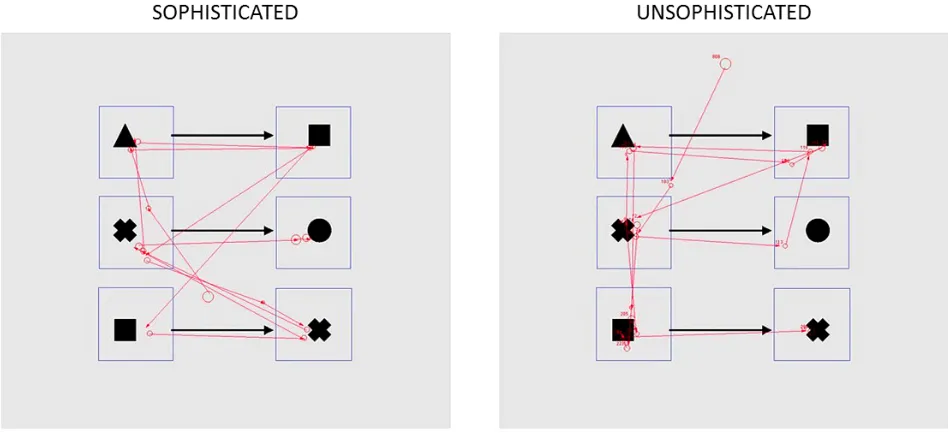
cluster-2 (N = 25) showed low Relational Search, high Attentional Bias and high Relational Bias, reflecting expected differences in the process of representation generation of sophisticated and unsophisticated agents. For this reason, we will refer to cluster-1 as the sophisticated group and to cluster-2 as the unsophisticated group. Examples of visual analyses of sophisticated and unsophisticated participants are shown in Figure 1.6.
We performed a k-fold cross validation analysis with Lasso estimation (Tibshirani, 1996) to verify that all three attentional parameters were significantly contributing to group clustering. Results indeed confirm that the model that best-explains the group classification is the one containing RS, AB and RB indices (Lasso coefficient: RS = 0.41; AB = -0.42; RB = -0.23).
Interestingly, subject classification was remarkably stable along the time course of the experiment: we ran two different cluster analyses for the first and second halves of the experiment, and we found that 88% of our participants were consistent in terms of strategy.
A possible alternative explanation of the observed differences in representation strategy concerns visual processing speed: in line with this hypothesis, participants in the unsophisticated group would show low Relational Search, high Attentional Bias and high Relational Bias simply due to low
Figure 1.6. Examples of visual analysis of sophisticated and unsophisticated participants in the
Representation-building interval. The sophisticated participant (left panel) performed a high number of
transitions (red arrows), distributed her fixations rather homogeneously across ROIs (red circles) and
performed both linear and non-linear transitive-Ts (as visible from the direction of arrows). The
unsophisticated participant (right panel) exhibited a lower number of transitions, her attention was more
efficiency in scanning the relational environment. We tested this hypothesis by comparing the two groups in the visual search task: if visual scan efficiency drove the eye-movement differences in the Relational-inference task, the sophisticated group would show higher performance in the visual search task. However, the two groups did not differ in any of the efficiency measures we collected (accuracy, reaction times, earnings; see Table S1.8 in section 7.1.1 in Appendices). These results suggest that the inter-group differences observed in the Relational-inference task were not related to general efficiency in scanning the environment.
Then we investigated whether the lookup patterns of sophisticated and unsophisticated participants changed along the time course of the trial depending on relational set type. We considered the proportion of non-linear transitive-Ts as measure of interest since its evolution in time should reflect the degree of understanding of the current relational structure. As shown in Figure 1.7, in non-linear sets, sophisticated participants accumulated evidence about the existence of non-linear transitive-Ts in the first part of the trial and, once they individuated them, maintained a stable ratio of non-linear transitive-Ts to favor consolidation of these relations in working memory. In linear sets, sophisticated agents maintained a low proportion of non-linear transitive-Ts, given their absence in this type of set. These results suggest that sophisticated agents were building a representation that explicitly expressed the relational structure of the environment. Conversely, unsophisticated participants did not show any difference in their proportion of non-linear transitive-Ts across relational sets in fact, they performed a low number of non-linear transitive-Ts along the entire trial in both linear and non-linear trials. This supports the hypothesis that unsophisticated participants were not searching for higher-order relations, and that they did not grasp the relational structure of the current environment.
Figure 1.7. Time course of proportion of non-linear transitive-Ts by trial category. We considered time
windows of 1 second. The first time window (0-1s) was discarded from the plot because of the extremely
low number of transitive-Ts in this time interval (0.004% of the total number of transitive-Ts). Filled areas
around lines represent standard error of the mean. Sophisticated participants show a higher proportion of
Performance in the Relational-inference task
We ran a mixed-design Anova with mean accuracy as dependent variable, group (sophisticated and unsophisticated) and relational set (linear and non-linear) as independent factors. Results show significant main effects of group (F (1, 48) = 18.20, p < .001) and category (F (1, 48) = 27.09, p < .001), and a significant interaction effect (F (1, 48) = 17.62, p < .001), indicating that the relation between performance in linear and non-linear sets differed across groups. Figure 1.8 shows that sophisticated groups show higher average accuracy than unsophisticated ones, who in turn exhibited a significant decrease in performance in non-linear relational sets. These results point out that sophisticated representation behavior is more optimal than unsophisticated processing, especially when the relational structure underlying the current environment is not explicit and easily recognizable.
Cognitive abilities, representation processes and performance
We tested whether sophisticated representation behavior was accompanied by higher abilities in cognitive reflection, fluid intelligence or working memory (Table 1.1). Tests of the six directional hypotheses (higher score for sophisticated participants in each cognitive test) were conducted using Bonferroni adjusted alpha levels of .008 per test (.05/6). The sophisticated group indeed showed higher CRT score than the unsophisticated group (one-tailed Mann Whitney U test, z = 2.508, effect size (r) = 0.35, p = .006), suggesting that cognitive reflection had an impact on the emergence of distinct representation processes. On the other hand, APM score and measures of working memory did not differ across groups (one–tailed Mann Whitney U test: APM, z = 0.20, p = .419; Forward digit span, z = 1.94, p = .026; Backward digit span, z = .253, p = 1.00; 2-back, z = -0.22, p = .412; 3-back task, z = 0.26, p = 0.397).
Group N. obs. CRT APM Forward span Backward span 2-back 3-back
Sophisticated 25 1.84 (1.07) 21.24 (3.71) 6.64 (1.08) 5.4 (1.15) 0.85 (0.09) 0.72 (0.09)
Unsophisticated 25 1.04 (1.06) 20.88 (4.36) 6 (1.12) 5.24 (1.13) 0.86 (0.06) 0.72 (0.08)
TOTAL 50 1.44 (1.13) 21.06 (4.01) 6.32 (1.13) 5.32 (1.13) 0.85 (0.08) 0.72 (0.09)
To corroborate these findings, we run a stepwise backward logistic regression (Draper & Smith, 1998; Efroymson, 1960; Hocking, 1976) with group as dependent variable and all the six cognitive measures as independent variables. A low Variance Inflation Factor (VIF, Marquaridt, 1970) of 1.38 indicated no collinearity between variables (see Table S1.3 in section 7.1.1 in the Appendices, for between-measure correlation table). Results confirmed that the CRT score was the only cognitive
Table 1.1. Summary statistics (average and standard deviation, in brackets) of the six cognitive tests
Overall accuracy B SE t p 95 % CI
Sophisticated group
APM 0.32 0.12 2.79 .011 0.08 0.56 Backward span 0.19 0.11 1.79 .087 - 0.03 0.41 3-back 0.20 0.10 1.94 .066 - 0.01 0.41
N. obs. 25
Unsophisticated group
APM 0.41 0.13 3.15 .005 0.14 0.69 Backward span 0.50 0.14 3.50 .002 0.20 0.80
N. obs. 25
Causal mediation analysis
In order to understand the interplay between the type of representation process and cognitive measures in explaining task performance, we used Causal Mediation Analysis to test whether representation behavior could serve as a mediator in explaining the effect of one or more of our cognitive measures on performance in the Relational-inference task. To obtain a single and continuous measure of representation behavior that could serve as a mediator factor, we standardized and averaged our three attentional indices in a unique index (Representation Index).7 Using the
7 We changed the sign of AB and RB indices in order to have a continuous index indicating sophisticated representation
behavior for positive values and unsophisticated representation behavior for negative values.
Table 1.2. Stepwise backward regression analyses of overall accuracy for sophisticated and
unsophisticated groups. Only cognitive measures surviving the limit for inclusion in the model (p < .1) are
reported. 2-back and 3-back measures were jointly considered for evaluation of inclusion in the model.
Variables excluded from the model (sophisticated group): CRT, p=.29; digit span forward, p=.39; 2-back,
p=.78. Variables excluded from the model (unsophisticated group): CRT, p=.29; digit span forward,
approach implemented in the “Mediation” R package (Imai et al., 2010), we first estimated a linear mediator model with Sophistication Index as dependent variable and our six cognitive measures as predictors. Only CRT score significantly predicted Sophistication Index (B = 0.40, p < .001, see Table S1.5 in section 7.1.1, Appendices). This finding is in line with the results previously reported (Table 1 in the main text, Table S1.4 in section 7.1.1, Appendices), indicating that cognitive reflection is the only measure differing across groups. The second step of the analysis consisted of estimating a linear outcome model with overall accuracy as dependent variable and Sophistication Index and the six cognitive measures as independent variables (Table S1.6 in section 7.1.1, Appendices). Sophistication Index (B = 0.56, p < .001), APM score (B = 0.29, p < .001) and Backward Span (B = 0.26, p = .015) significantly predicted overall accuracy, while CRT score did not predict accuracy (B = .11, p = .324). However, running a linear regression dropping Sophistication Index as predictor, CRT score significantly predicted accuracy (B = 0.33, p = .014, Table S1.7 in section 7.1.1, Appendices), suggesting complete mediation of Sophistication Index on the relation between cognitive reflection and performance.
Effect Estimated coefficient
95% CI lower bound
95% CI
upper bound p Average causal mediation effect
(ACME) 0.23 0.04 0.38 .02
Average direct effect
(ADE) 0.11 -0.13 0.37 .37
Total effect 0.33 -0.02 0.61 .05 Proportion mediated 0.68 0.38 7.13 .05
In sum, Causal Mediation Analysis revealed a remarkable effect of cognitive reflection on representation-building processing, which in turn highly predicted accuracy in the Relational-inference task. The relationship between cognitive reflection and performance was largely due to this mediating effect.
2.3 Experiment 2
In order to better understand the cognitive mechanisms underlying the emergence of sophisticated and unsophisticated representation processes, in Experiment 2 we ran two additional sessions of the Relational-inference task with a new pool of 56 participants. In session 1 (pre-treatment), participants completed the task with the same modalities of Experiment 1. In Session 2 (post-treatment), participants received additional information about the existence of the two strategies and their respective average performance rates. Then they were asked to repeat the Relational-inference task in the way they preferred. We compared pre- and post- treatment visual analyses to identify potential strategy switches that would indicate that unsophisticated representation behavior does not depend on cognitive ability or motivation, but rather on processes related to the spontaneous generation of sophisticated representation strategies.
Table 1.3. Results of Causal Mediation Analysis with Representation Index as a mediator, CRT score as
Although we report Experiment 2 right after Experiment 1 for continuity in terms of research question, we acknowledge that Experiment 2 was run after Experiment 3, to avoid any interference by the manipulation included in Experiment 2 on behavior in Experiment 3.
2.3.1 Method
Participants and procedure
Participants were 56 students from the University of Trento, Italy (43 females, mean age 24.16, SD 4.75). The study was approved by the local ethics committee and all participants gave informed consent. Every participant took part in two experimental sessions (pre- and post- treatment) on consecutive days, performing the experimental tasks in fixed order. In the pre-treatment session, participants completed a shortened-version of the Relational-inference task while their eye movements were registered.8 They were reimbursed according to their proportion of correct responses (minimum 0, maximum 9 euros). Instructions and control questions were the same as in Experiment 1. At the end of session 1, participants performed some of the cognitive tests we used in Experiment 1. In particular, we chose those tests that have been observed to impact on behavior in the Relational-inference task: APM, CRT and backward digit span. The modalities of administration of APM and backward digit span were identical to Experiment 1. Concerning the CRT, we used a recent multi-item version of the CRT (Primi et al., 2016) composed of six new multi-items. Multi-multi-item CRTs have been recently recommended to overcome limitations coming from familiarity and range restrictions, by decreasing the probability of previous exposure to the CRT’s items and floor or ceiling effects (see Bialek & Pennycook, 2017; Stieger & Reips, 2016; Toplak et al., 2014).
8 The new version consisted of 51 trials instead of the original 80 trials. Most of the items of the shortened-version were
taken from the original one, but some new items were created to maintain the same ratio between linear and non-linear
relational sets and balance the occurrence of the different symbols and source states. Participants were provided with two
In the second experimental session (Post-treatment), additional instructions were read to participants before repeating the Relational-inference task. We informed participants about the existence of the two strategies observed in the task (sophisticated and unsophisticated) and explained in details each of them (see section 7.1.2 of the Appendices for detailed instructions provided to participants), independently of the strategy used by the participant in the pre-treatment session. Moreover, participants were informed about the average performance and respective gain of participants using either the sophisticated or the unsophisticated strategy, using data of Experiment 1.9 After the administration of additional information, participants were told to perform (for the second time) the task in the way they preferred, even implementing a strategy different from the two we reported. For the second session, 51 new items were created to avoid any potential confound due to the repetition of items of Session 1. Each new item consisted in a perfect copy of the correspondent item of session 1 in terms of relational structure of symbols, but the identity of symbols in each logical position was changed. As in session 1, participants were paid based on their proportion of correct responses (minimum 0, maximum 9 euros).
Using this manipulation, we ensured that all the participants could have access to the sophisticated strategy in the post-treatment session. Moreover, informing them about the difference in average gain between the two strategies served as a motivation for switching strategy. We aimed to analyze differences in representation behavior across sessions, to explore whether unsophisticated participants were prone and able to implement the sophisticated strategy after we ensured that they were aware of its existence and related beneficial effects in terms of performance.
9 Gain magnitudes of Experiment 1 were re-calibrated based on the minimum and maximum range of Experiment 2.
Unsophisticated participants: 62% of correct responses, 5.58 euros on average. Sophisticated participants: 84 % of
Eye-tracking analysis
In the pre-treatment session, we replicated the analysis procedure of Experiment 1. We first performed single-trial and single-subject cluster analysis on eye fixation data (fixation length and time point as dimensions) to distinguish between building and Representation-consolidation intervals. Then we considered data in the Representation-building interval to isolate three attentional indices: Relational Search, Attentional Bias and Relational Bias. These three indices were used to perform a between-subject cluster analysis to identify sophisticated and unsophisticated participants. Then we compared the two groups to explore differences in performance in the Relational-inference task and in cognitive assessments such as CRT, APM and backward digit span. In the post-treatment session, we recalculated our three attentional indices based on the behavior observed after the instructions manipulation. Then we performed the same cluster analysis of Session 1 using the new attentional indices, in order to test whether we could observe a change in the proportion of agents implementing the sophisticated or the unsophisticated strategy.
2.3.2 Hypotheses
2.3.3 Results and discussion
Session 1: pre-treatment
In session 1 we replicated results of Experiment 1. A cluster analysis of our three attentional indices returned two groups showing the same patterns we had found in Experiment 1. Participants in cluster-1 (N = 36) showed high Relational Search (RS), low Attentional Bias (AB), and low Relational Bias (RB), while cluster-2 (N = 20) exhibited low RS, high AB, and high RB, as expected by sophisticated and unsophisticated agents, respectively. We will refer to cluster-1 as the sophisticated group and to cluster-2 as the unsophisticated group. As expected, group classification was best-explained by a model including all three attentional indices (k-fold cross-validation, Lasso coefficients: RS = 0.33; AB = 0.38; RB = -0.22).
group as dependent variable and the three cognitive measures as independent variables, showing the CRT score was the only cognitive measure significantly predicting the representation strategy implemented (CRT, B = 0.77, p = .012. Variables excluded from the model: APM, p = .531; Backward digit span, p=.396).
We also replicated results indicating that fluid intelligence and working memory modulate intra-group performance (Stepwise backward regression. Sophisticated, APM: B = 0.45, p = .001; Backward digit span: B = 0.32, p = .013. Unsophisticated, APM: B = 0.55, p = .001; Backward digit span: B = 0.32, p = .058). Furthermore, representation strategy completely mediated the relationship between cognitive reflection and performance (Linear regression of average accuracy with CRT, APM and backward digit span as predictors. CRT effect without representation strategy included in the model: B = 0.24, p = .044. CRT effect with representation strategy included in the model: B = 0.17, p = .144. See table S1.9 and S1.10 in Section 7.1.2, Appendices).
In sum, results of Session 1 of Experiment 2 replicated the ones of Experiment 1, highlighting the existence of two groups of participants differing in terms of representation behavior. The emergence of these behaviors determined higher levels of accuracy in the sophisticated group and was predicted by cognitive reflection level. In contrast, fluid intelligence and working memory did not predict the representation strategy implemented, but rather modulated performance by sustaining information maintenance and manipulation mechanisms.
Session2: post-treatment
participants showing attentional index levels expressing sophisticated representation behavior. Only 7 participants were classified as unsophisticated agents.
Comparing the classifications pre- and post-manipulation, we can observe that 35 participants were classified as sophisticated in both session 1 and session 2 (S-S group). 14 participants were classified as unsophisticated in session 1 and as sophisticated in session 2 (U-S group). Finally, 6 participants were classified as unsophisticated in both session 1 and session 2 (U-U group). Only 1 participant was classified as sophisticated in Session 1 and as unsophisticated in Session 2. We did not include this participant in subsequent analyses.
We are particularly interested in the U-S group, since it includes participants who shifted their strategy from unsophisticated to sophisticated in the post-treatment session. Comparing indices from these participants in session 1 and session 2, we can observe a significant difference in the direction of the sophisticated strategy for all three attentional indices (Wilcoxon matched-pairs signed-ranks test, RS: z = -2.98, effect size (r) = -0.80, p = .003; AB: z = 2.42, effect size = 0.65, p = .016; RB, z = 3.30, effect size = 0.88, p = .001. All p values were significantly at the Bonferroni corrected threshold, p = 0.017). Moreover, the overall index shift was significantly higher in the U-S group than in the S-S group (One-way Multivariate Anova with Relational Search, Attentional Bias and Relational Bias as dependent variables and group (two levels: S-S and U-S groups10) as an
10The U-U group was not included in any statistical analysis due to the low number of subjects (n = 6). However,
comparing descriptive statistics of the three attentional indices pre- and post- manipulation, we can see that index levels
are very similar across sessions, and maintain the typical profile of unsophisticated agents (Relational search: M(S1) =
-1.76, M(S2) = -1.78; Attentional Bias: M(S1) = 1.07, M(S2) = 1.40; Relational Bias: M(S1) = 1.47, M(S2) = 0.90).
We also acknowledge that between-group analyses contained in this paragraph rely on groups with modest sample size,
(e.g. the U-S group, N=14) and should be therefore interpreted with caution. However, it must be noted that are
confirmatory analyses describing in detail the characteristics and the magnitude of the attentional shift of participants,
which has been already revealed by comparing the results of the cluster analyses performed in pre- and post-treatment
independent factor, F (3, 46) = 5.93, p = .002). These results confirm that a large percentage (70%) of unsophisticated participants switched towards the sophisticated representation strategy in the post-treatment session, suggesting that these agents are indeed capable of implementing the sophisticated strategy. Interestingly, the attentional shift in the U-S group predicted the increase in performance in the post-treatment session (Linear regression with increase in accuracy as dependent variable and average index shift (average of (post – pre) differences of RS, AB and RB indices) as independent variable, B = 0.71, p = .043), confirming than the strategy switch led to an increase in performance in the U-S group. However, despite the consistent increase in performance, participants in the U-S group did not reach the average level of performance of the S-S group in the post-treatment session (U-S: M = 0.78; S-S: M = 0.90). This can be explained by the fact that participants in the S-S group had the possibility to repeat the task using and refining the same strategy, while U-S group implemented the sophisticated strategy for the first time in the post-treatment session. In line with this hypothesis, we can see that the average accuracy level of U-S participants in the post-treatment session (78%) was comparable to the one of S-S participants (80%) in the pre-treatment session (Table 1.4).
Group N Pre-treatment Post-treatment S-S 35 0.80 (0.19) 0.90 (0.13) U-S 14 0.60 (0.21) 0.78 (0.19)
U-U 6 0.57 (0.29) 0.64 (0.33)
In sum, in session 1 (Pre-treatment) we replicated results of Experiment 1 showing the existence of two distinct strategies in the process of generation of internal models of contingencies. Results of session 2 (Post-treatment) show that the majority of participants classified as unsophisticated in session 1 shifted strategy towards the sophisticated one, suggesting that unsophisticated agents can
implement the sophisticated strategy when we ensure that they are aware of its existence or after repetitive exposure to the task. This suggests that the emergence of unsophisticated behavior is not primarily related to the inability to implement the sophisticated strategy, but is linked to a preferential access to it. Furthermore, it indicates that the implementation of the unsophisticated strategy in session 1 is not due to motivational aspects, at least for the majority of the agents in the unsophisticated group. If scarce motivation were the driver of heterogeneity in Session 1, we would expect similar behavior in Session 2, given that incentives are identical in the two sessions.
Exploring the cognitive drivers of strategy generation
In order to robustly assess the cognitive mechanisms underlying sophisticated and unsophisticated representation strategies, we pooled data of Experiment 1 and Experiment 2 and re-analyzed the role of cognitive factors on a sample of 106 participants. Using this larger sample size, we used cross-validation statistics to investigate 1) the cognitive factors underlying the emergence of either sophisticated or unsophisticated behavior and 2) the cognitive mechanisms modulating task performance in both groups. We considered the CRT score, the APM score and the backward digit span (BDS) as measures of interest since they are the only ones included in both experiments and since they are the only measures significantly modulating strategy generation or performance in Experiment 1.
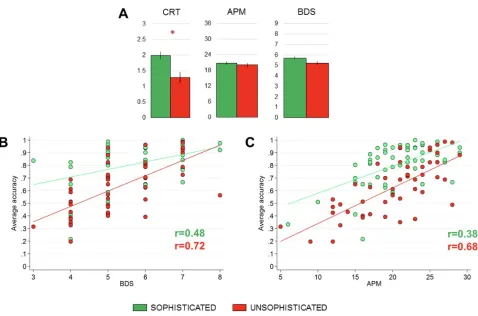
First, we explored the cognitive factors predicting the classification in sophisticated or unsophisticated groups. Results of a k-fold cross-validation analysis with Lasso estimation (Tibshirani, 1996) confirmed results of Experiment 1 and 2, showing that group classification was best-predicted by a model containing only the CRT as predictor (Lasso coefficient: CRT = 0.31). Figure 1.9 (Panel A) shows average group levels of CRT, APM and BDS in the two groups.
in both groups, all three cognitive measures were included in the model that best-explained performance (Lasso coefficients. Sophisticated: CRT = 0.12; APM = 0.47; BDS = 0.25. Unsophisticated: CRT = 0.16; APM = 0.46; BDS = 0.37). These results corroborate the findings of Experiment 1 and Experiment 2, showing a crucial involvement of fluid intelligence and working memory in sustaining performance in the task, but not in predicting the emergence of either sophisticated or unsophisticated representation behavior.
Figure 1.9. Visualization of cognitive measure analyses in Sophisticated (green) and Unsophisticated (red)
groups. A) Average levels of CRT, APM and BDS in the two groups. B) Scatter plot of BDS and average
accuracy in the Relational-inference task. Correlation coefficients r for both groups are reported. C)
Scatter plot of APM and average accuracy in the Relational-inference task. Correlation coefficients r for
2.4 Experiment 3
In Experiment 3, we investigated whether sophisticated and unsophisticated strategies can be generalized to more ecological contexts, where verbal premises express the conditional occurrence of hypothetical events in real life scenarios (Verbal-inference task). Specifically, participants had to judge the validity of verbal arguments consisting in conditional sequences of hypothetical states (see, for example, Byrne, 1989).
In contrast to the Relational-inference task, in the Verbal-inference task we did not impose any time constraint in the process of relation encoding. Moreover, participants were not required to rely on short-term memory mechanisms to perform the task. Despite the remarkable differences between the two tasks, we wanted to test whether agents classified as sophisticated in the Relational-inference task would express more sophisticated representation behavior when building the representation of real-life hypothetical states in the Verbal-inference task. This would suggest the existence of general and context-independent strategies in the process of encoding and representation of contingencies.
2.4.1 Method
Verbal-inference task
Participants of Experiment 2 (n = 56) performed an additional Verbal-inference task while their eye movements were monitored. The Verbal-Inference task was performed in a different experimental session preceding both session 1 and 2 of Experiment 2. The task was incentivized similarly to the previous experiments, by paying participants based on their proportion of correct responses (minimum 0, maximum 9 euros).
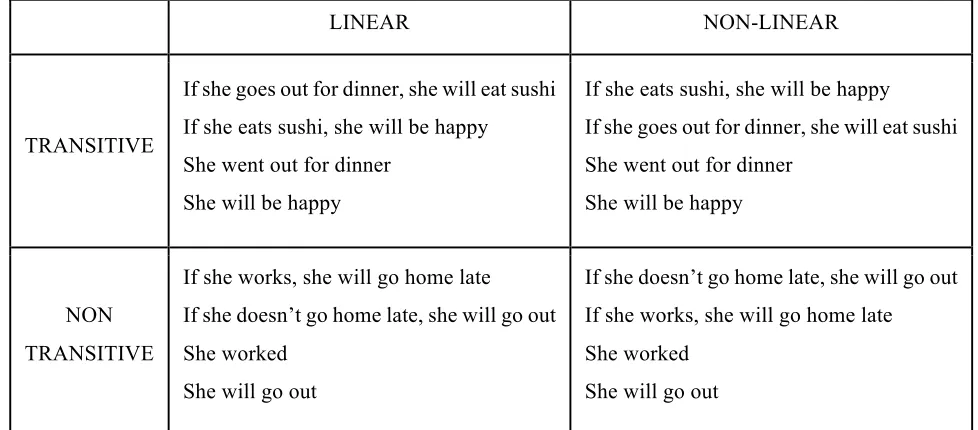
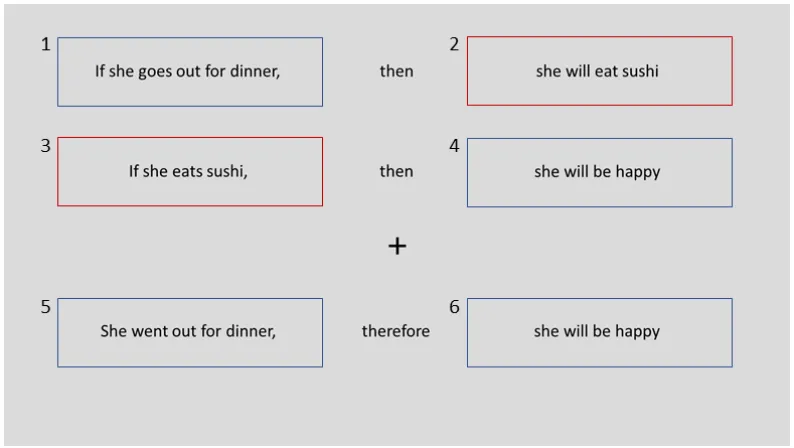
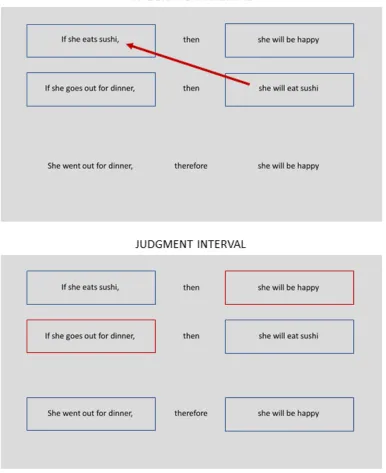
characteristics could return either transitive or nontransitive sequences. In transitive sequences, the shared proposition contained two identical terms; in nontransitive sequences, one of the terms of the shared proposition consisted in the negation of the other (Table 1.5). As in the Relational-inference task, in both transitive and nontransitive sequences, the presentation of the two statements could follow the temporal order of events (linear sets) or be misaligned with it (non-linear sets).
LINEAR NON-LINEAR
TRANSITIVE
If she goes out for dinner, she will eat sushi If she eats sushi, she will be happy
She went out for dinner She will be happy
If she eats sushi, she will be happy
If she goes out for dinner, she will eat sushi She went out for dinner
She will be happy
NON TRANSITIVE
If she works, she will go home late If she doesn’t go home late, she will go out She worked
She will go out
If she doesn’t go home late, she will go out If she works, she will go home late She worked
She will go out
Conditional sequences could contain different types of inference. We used several inference types since we hypothesized that the nature of the relationship between antecedent and consequent could influence the relationship between representation strategy and validity judgment in the task. Types of inference consisted in modus ponens (MP), modus tollens (MT), affirmation of the consequent (AC), denial of the antecedent (DA). Some conditional sequences consisted in two inferences of the same type (e.g. MP ∴ MP), while other sequences consisted in two different inference types (MP&DA;
MT&AC).11
11 MP&DA and MT&AC trials were treated independently of the order of the two inferences. Therefore, in MP&DA
trials both MP ∴ DA and DA ∴ MP are included, while MT&AC trials consist in either MT ∴ AC or AC ∴ MT sequences.
In sum, sequences differed between each other along four dimensions: linearity (linear or non-linear), transitivity (transitive or nontransitive), number of inferences to perform (one or two) and type of inference (MP, MT, AC, DA, MP&DA; MT&