International Journal of Current Trends
in Engineering & Technology
Volume : I, Issue : II (Jan.- Feb. 2015)
Effect of Various Reductants on the Spectral Characteristics of the
Reduced Phosphopolyoxomolybdate Anion, and Its Application to
Orthophosphate Anion Quantification in Selected Ugandan Waters
Irene Nalumansi
Lecturer, Department of Chemistry, Mbarara University of Science and Technology, Mbarara, Uganda
Jolocam Mbabazi*
Professor, Department of Chemistry, Makerere University, Kampala, Uganda
Henry Ssekaalo
Professor, Department of Chemistry, Makerere University, Kampala, Uganda
Muhammad Ntale
Associate Professor, Department of Chemistry, Makerere University, Kampala, Uganda *Corresponding author. Email: [email protected]
Abstract - Orthophosphate anion (PO43-)
quantification involves the formation of a phosphopolyoxomolybdate which on reduction with a given reductant in aqueous sulphuric acid medium
produces an intensely coloured
phosphopolyoxomolybdic acid (PPMA) complex, molybdenum blue whose intensity is proportional to concentration of PO43-. Ascorbic acid, tin(II) chloride
and hydrazine sulphate as the hitherto used reductants formed intense molybdenum blues whose colour faded with time as opposed to sodium thiosulphate (Na2S2O3) and sodium dithionite
(Na2S2O4) as reductants. Potassium antimonyl
tartarate catalyst affected reduction of PPMA in respect of using Na2S2O3 reductant leading to
attainment of stable spectrum after 60 minutes and 40 minutes in absence and presence of catalyst respectively. The reduced PPMA produced with Na2S2O4 reductant obeyed Lambert-Beer’s law at λmax
880nm and 825nm in the concentration range 0.0027 – 0.800 mg L-1 with detection limits of 0.54 μg mL-1 and 0.76 μg mL-1
in the presence and absence of a catalyst respectively. The technique has been applied to phosphate (PO43-)quantification in water from a well
and borehole. The resultant reduced PPMA containing sulphur and phosphorus as hetero atoms produced with Na2S2O3 reductant obeyed
Lambert-Beer’s law at λmax 735nm and 725nm in the presence
and absence of a catalyst, respectively.
Keywords - Phosphopolyoxomolybdate anion, orthophosphate anion, molybdenum blue, reductant, spectral, Ugandan waters.
1. Introduction
The PO43- is an important nutrient to plants and may
occur naturally in waters. Its quantification in trace amounts may necessitate using fast, accurate and less cumbersome methods, in order to take remedial measures where applicable. The most commonly used method is
spectrophotometric [1, 2], wherein the absorption maxima, molar absorptivity and stability of the reduced phosphopolyoxomolybdate anion vary depending on the nature of reductant used, which may lead to inaccurate estimation of the PO43-. An important occurrence of
orthophosphate in biological systems is as the structural material of bone, teeth and strengthening material in chitin of the insect exoskeletons [3]. The addition of large quantities of phosphates to water ways accelerates algae and plant growth in natural waters, enhancing eutrophication which can result in large fluctuations in the lake water quality and trophic status and in some cases periodic blooms of cyanobacteria [3, 4]. There are several methods available for the quantification of phosphorus as orthophosphate anion in waters and wastewaters [5]. These include spectrophotometric and
non spectrophotometric methods. Various
non-spectrophotometric methods for orthophosphate anion determination have been reported, and these include titrimetry, complexogravimetry, atomic absorption spectroscopy, flow injection analysis, polarography and HPLC [6, 7].
The molybdovanadate spectrophotometric method,
involves formation vanadomolybdophosphoric acid, a yellow coloured product whose absorbance is commonly measured at 470nm. The sensitivity is generally less than that for reduced phosphomolybdenum blue methods but is quite tolerant to interfering ions and is suitable for monitoring wastewaters and contaminated waters [8]. The ammonium molybdate spectrophotometric method of PO43- determination involves production of PPMA,
International Journal of Current Trends
in Engineering & Technology
Volume : I, Issue : II (Jan.- Feb. 2015)
Copyright © 2015 IJCTET.IN, All right reserved hydroquinoline and 1-amino-2-naphthol-4-sulphonic acid
[6] which are not affordable and readily available. Methods that involve the reduction of PMA have been found to have the following shortcomings:the procedure must be carefully controlled as the excess molybdate reagent itself may be reduced to molybdenum blue [7, 9], both the acid conditions used and the presence of molybdate can enhance hydrolysis of dissolved organic and condensed phosphates to give an over estimation of orthophosphate [6]. Silicate, arsenate and germanate also form heteropolyoxomolybdic acids which on reduction yield molybdenum blue species with similar absorption maxima in addition to cations like lead(II), copper(II), and antimony(V) among others [6], inaddition to the blue colour formed sometimes being subject to fading. This study describes the effect of various reductants on spectral characteristics of the reduced PPMA, how it can be applied to quantification of PO43- in waters and could
provide an alternative and effective analytical procedure that is within the means of most laboratories. In this study, we test new reductants on selected waters and find them to be effective and affordable.
2. Materials and Methods
2.1 ApparatusWeighing was done on an Ohaus PA64C balance readable to 0.0001g [10] (Ohaus corp. PineBrook, NJUSA). The absorption spectra were recorded on a
UV-VIS Shimadzu UV-1700CE double beam
spectrophotometer (Shimadzu corporation Japan) and absorbance measurements at a fixed wavelength were made with the same instrument in the photometric mode. pH measurements were done with a Corning Pinnacle 555 pH/ion meter (Corning Incorporated Life Sciences Corning, New York 14831, USA). All chemicals were of analytical grade quality and deionised water was used to prepare aqueous solutions as hereunder described.
2.2 Reagents
Potassium antimonyl tartarate solution,
K(SbO)C4H4O6.1/2H2O (0.2743g), was dissolved in a
minimum amount of deionised water and then diluted to 100 mL to give a 0.0082 M solution. Ammonium molybdate solution, (NH4)6Mo7O24.4H2O (4.0000 g), was
dissolved in deionised water and diluted to 100 mL to give a 0.032 M solution.A 0.1 M ascorbic acid solution was prepared by dissolving C6H8O6 (1.7600g) in
deionised water (100 mL). Ammonium
molybdate,(NH4)6Mo7O24.4H2O (2.5000 g), was
dissolved in deionised water (18 mL). Concentrated H2SO4 (28 mL) was added to deionised water (40 mL),
cooled, added to the molybdate solution and diluted to
100 mL. This solution was 0.02 M in
(NH4)6Mo7O24.4H2O and 5 M in H2SO4.
A 0.1 M hydrazine sulphate solution was prepared by dissolving NH2NH2.H2SO4 (1.3013 g) in deionised water
and diluted to 100 mL. Tin(II) chloride, SnCl2.2H2O
(0.2500g), solution was dissolved in glycerol (10 mL) while heating in a water bath.A 0.1 M sodium dithionite solution was prepared by dissolving Na2S2O4 (1.7400g)
in deionised water and diluted to 100 mL. The starch indicator solution was prepared by dissolving laboratory grade soluble starch (2.0000g) and potassium iodide (5.5000g) added as a preservative in boiling deionised water (200 mL).A 0.1 M potassium iodide solution was prepared by dissolving KI (4.1500g) in deionised water and diluted to 250 mL. A 0.02 M potassium iodate solution was prepared by dissolving KIO3 (1.0000g) in
deionised water and diluted to 250 mL.
Standard sodium thiosulphate, Na2S2O3.5H2O (6.2000g),
was placed in a 250 mL volumetric flask and dissolved in deionised water (50 mL). Na2CO3 (0.0500g) was added
as a preservative and the solution made to 250 mL with deionised water. The solution was then standardized using KIO3 solution as follows: standard KIO3 solution
(0.02 M, 25.0 mL) was pipetted, to this was added KI (0.1 M, 10.0 mL) followed by sulphuric acid (1 M, 25.0 mL) in a conical flask. The iodine liberated was titrated against Na2S2O3.5H2O titrant using starch solution (2.0
mL) as indicator. The concentration of sodium thiosulphate was determined to be 0.1 M. A Potassium dihydrogen orthophosphate, KH2PO4 (0.0439g), standard
solution was dissolved in deionised water and made up to 100 mL. Combined reagent (CR) (100 mL) was prepared by mixing H2SO4 (2.5 M, 50.0 mL), potassium antimonyl
tartarate solution (0.0082 M, 5.0 mL), ammonium molybdate solution (0.032 M, 15.0 mL) and ascorbic acid solution (0.1 M, 30.0 mL) while shaking on each addition.
2.3 Methods
2.3.1 Molybdenum-blue methods with various reductantsfor the phosphopolyoxomolybdate anion
A series of six KH2PO4 standards (0.2, 0.4, 0.5, 0.6, 0.8
and 1.0 mL) were transferred into 50 ml volumetric flasks and diluted with deionised water (40 mL). The dilute solutions were treated differently according to the various reductants as described below:
2.3.2 Ascorbic acid molybdenum-, and tin(II) chloride molybdenum-blue methods
To the dilute KH2PO4 solution was added CR (8.0 mL)
and mixed [10]. To the dilute KH2PO4 solution was
added ammonium molybdate/sulphuric acid solution (2.0 mL) followed by tin(II) chloride solution (5 drops), made up to 100 mL with deionised water and mixed [10].
2.3.3 Hydrazine sulphate molybdenum-blue method
To the dilute KH2PO4 solution was added H2SO4 (2.5 M,
International Journal of Current Trends
in Engineering & Technology
Volume : I, Issue : II (Jan.- Feb. 2015)
0.4 mL) and NH2NH2.H2SO4 solution (0.1M, 2.4 mL),
made up to 100 mL and mixed.
2.3.4 Sodium thiosulphate molybdenum-blue method
To the dilute KH2PO4 solution was added H2SO4 (0.5 M,
4.0 mL), ammonium molybdate solution (0.032 M, 1.5 mL), Na2S2O3 solution (0.1 M, 2.5 mL) made up to 100
mL with deionised water and mixed. To the dilute KH2PO4 solution was added H2SO4 (0.5 M, 4.0 mL),
ammonium molybdate solution (0.032 M, 1.2 mL), potassium antimonyl tartarate solution (0.0082 M, 0.4 mL), Na2S2O3 solution (0.1 M, 2.4 mL) made up to 100
mL with deionised water and mixed.
2.3.5 Sodium dithionite molybdenum-blue method
To the dilute KH2PO4 solution was added H2SO4 (1 M,
4.0 mL), ammonium molybdate solution (0.032 M, 1.5 mL), Na2S2O4solution (0.1 M, 2.5 mL) made up to 100
mL with deionised water and mixed. To another dilute KH2PO4 solution was added H2SO4 (1 M, 4.0 mL),
ammonium molybdate solution (0.032 M, 1.2 mL), potassium antimonyl tartarate solution (0.0082 M, 0.4 mL), Na2S2O4 solution (0.1 M, 2.4 mL) made up to 100
mL with deionised water and mixed.
2.4 Spectral Characterisation of Molybdenum Blues
After treatment of the solutions as described above, each of the solutions was allowed to stand for 10 minutes until an intense blue colour formed. The blue coloured product was then scanned for a spectrum against a water blank. The same mixture was again scanned for a spectrumafter a period of 5, 10, 15, and 20 minutes.
2.5 Time-dependent Spectra for Absorbance Variation
The variation of absorbance at λmax with time was studied
for each method. Spectra obtained above using Na2S2O3
and Na2S2O4 as reductants were examined through all the
six series of standard KH2PO4 solutions, to determine
time over which the mixture was to be allowed to stand before scanning the spectrum at a fixed λmax. The time
considered was that after which a stable spectrum was obtained. After treatment of the solutions as described above, mixtures were allowed to stand for 10 minutes using ascorbic acid and tin(II) chloride reductants; 60 and 40 minutes using Na2S2O3 solution in absence and
presnce of potassium antimonyl tartarate catalyst respectively and 25 minutes using Na2S2O4 as the
reductant. Then time course graphs were obtained for a period of 30 minutes, recording absorbance every after 5 minutes, using each reductant at a fixed λmax.
2.6 Method Validation
This was carried out for the Na2S2O3 and Na2S2O4
developed methods to determine the following characteristics: method detection limits, linearity, range, accuracy and precision. These are described below.
2.6.1 Detection and quantification limits
Limit of detection (LoD) is the lowest concentration level that can be determined to be statistically different from a
blank (99%). The LoD in this work was determined by analyzing ten replicates of sample blank whose standard deviation was calculated. LoD was then expressed as standard deviation multiplied by the student’s t-value [11]. The limit of quantification (LoQ) is the level above which quantitative results may be obtained with a specified degree of confidence. The LoQ in this work was determined by analysing ten replicates of sample blank whose standard deviation was calculated. LoQ is mathematically ten times the standard deviation of the results for a series of replicates used to determine the LoD [11].
2.6.2 Selectivity
The extent of interference caused by several cationic and anionic species such as copper(II), lead(II), silicate, nitrite and chloride was investigated by adding different amounts of ionic species to PO43- solution of known
concentration.
2.6.3 Accuracy and precision
It was determined by calculating the mean recovery of the spiked seven portions of standard KH2PO4 solutions
at slightly above and lower than the detection level. The accuracy was then expressed as
%
100
x
z
y
Accuracy
in which y = mean value of seven replicates, z = spiked concentration.
In this work, precision was determined by calculating SD and RSD of the spiked analyte recoveries for seven replicates at different concentrations.
2.6.4 Working range and linearity
Working range refers to the range of concentrations over which the method may be applied whereas linearity refers to the ability of the method to obtain test results proportional to the concentration of the analytes [12]. A plot of measurement response against measurand concentration was made. A visual examination to identify approximate linear range, upper and lower boundaries of the working range was done. LoQ forms the lower end of the working range. The linearity was obtained from the correlation coefficient value (R2) of the line of best fit (least-squares line).
2.7 Determination of the Orthophosphate Anion in Selected Ugandan Waters
Na2S2O4 as new a reductant for the
phosphopolyoxomolybdate anion was applied to
determine PO43- anion in selected waters of Uganda in
International Journal of Current Trends
in Engineering & Technology
Volume : I, Issue : II (Jan.- Feb. 2015)
Copyright © 2015 IJCTET.IN, All right reserved (0.45 μm pore size) that had been washed free of
phosphates by passing deionised water (200 mL) that had been pre-warmed (30 – 40oC) through them and the washings discarded. The first 10 mL of sample filtrate was rejected and the remainder collected in glass bottles for determination of PO43- as previously described.
3. Results and Discussion
3.1 Spectral Characterization of Reduced Phosphopolyoxomolybdate Anion
A comparison of spectral characteristics of the RPPMA produced with ascorbic acid, tin(II) chloride, hydrazine sulphate the hitherto used reductants and Na2S2O4,
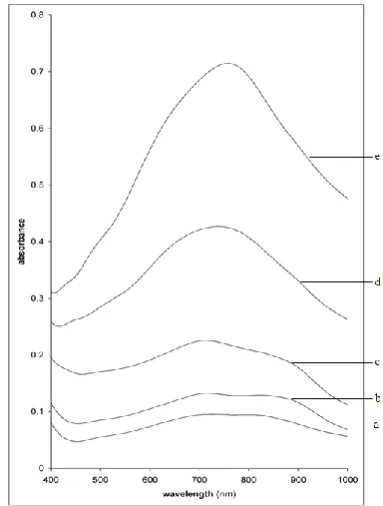
Na2S2O3 as new reductants was made (Figs. 1 and 2). The
overall scanning profile of PMB produced using Na2S2O4
in presence of catalyst scanned from 400 to 1000 nm showed a peak between 866 and 886 nm and a shoulder in between 702 and 725nm very similar to the ascorbic acid – reduced phosphopolyoxomolybdate ( Fig. 1). The latter has been suggested as a reduced form of 12- phosphomolybdate species. The similatity suggests that the identity of PMB from Na2S2O4 is a reduced form of
phosphomolybdate. In absence of a catalyst, one peak with λmax in between 816 and 825nm was shown.
The development of PMB spectra from 400 to 1000nm for all the phosphorus concentrations studied showed similar peak maxima in between 720 and 730nm after 60 minutes of the blue product standing and in absence of a catalyst. A peak maximum in between 735nm and 743nm was shown in the presence of a catalyst, after 40 minutes (Fig. 2). The overall scanning profile after 40 and 60 minutes is very similar to the scanning profile of PMB from tin(II) chloride-reduced phosphopolyoxomolybdate. This similarity suggests that the identity of PMB from Na2S2O3 is a reduced form of phosphomolybdate.
However, the PMB in this case is as a result of [PMo12O40]
3-, [S2Mo18O62]
and probably [PS2MoxOy]
n-whatever the values of x and y, hence the high absorbances obtained. In acidic medium, the thiosulphate ions decompose to sulphur, sulphurdioxide and water
S2O32-(aq) + 2H+ (aq) → S(s) + SO2(g) + H2O(l)
So, when Na2S2O3 was added to aqueous acidic
phosphopolyoxomolybdate solution, it acted as a reductant to Mo centres and also its sulphur entered the isopolyoxomolybdate system as a second heteroatom forming [PS2MoxOy]n-. This explains the dramatic
increased absorbances.
Figure 1: Time-dependent spectra of the reduced phosphopolyoxomolybdate after (a)10, (b)15, (c) 25, (d) 40, (e) 60 minutes standing of the blue product using sodium dithionite as the reductant in the presence of K(SbO)C4H4O6.1/2H2O at pH 1.71 for a solution
containing 0.06 mg L-1.
Source: (this work)
International Journal of Current Trends
in Engineering & Technology
Volume : I, Issue : II (Jan.- Feb. 2015)
K(SbO)C4H4O6.1/2H2O at pH 1.88 for a solution
containing 0.06 mg L-1.
Source: (this work)
3.2 Stability of the Methods
PMB produced with Na2S2O3 was unstable as shown by
change in shape of the spectra formed (Fig. 2). This could be attributed to the number of MoO3 molecules
reduced per atom of phosphorus. In the presence of a catalyst, a stable spectrum was formed after the PPMA had been allowed to stand for 40 minutes. The shape improved as shown after 60 minutes, although it is not known whether it would remain the same or continue changing even after this time. The change in the shape of the spectrum could be due to variation in the number of Mo centres reduced or conversion from one PPMA to another.
Stability in the PPMA was attained after 25 minutes with Na2S2O4 where the shape of the spectra remained similar
up to the 60th minute. The stability could be attributed to the nature of the reductant. The spectral characteristics of the various molybdenum blues produced using different reductants indicated that λmax and absorbance vary
depending on the nature of reductant used. The reducing power of a given reductant depends on its reduction potential. A species with higher (more positive) reduction potential than the new species will have a tendency to gain electrons from the new species (ie be reduced by oxidizing the new species) and a species with lower (more negative) reduction potential will have a tendency to lose electrons to the new species (i.e., be oxidised by reducing the new species).
3.3 Effect of Catalyst
As proposed in the ascorbic acid method,
K(SbO)C4H4O6.1/2H2O acts as a catalyst in the
reduction of [PMo7O24]3-anion. Antimony(III) ions
increase considerably the rate of reduction reaction by incorporation into the phosphate-heptamolybdate complex [13]. When the phosphate in water is allowed to react with ammonium molybdate, a heteropolyacid complex is formed having a Keggin structure, whose stability allows the metals in the anion to be readily reduced to a blue coloured complex whose absorption is measured spectrophotometrically. Normally, this reduction is slow but by adding a catalyst, in this case potassium antimonyl tartrate, the reduction proceeds swiftly [14].
Figs. 1 and 2 indicate that a number of molybdenum centres are reduced hence the high absorbance with Na2S2O4 in presence of K(SbO)C4H4O6.1/2H2O
compared to when it is absent. In addition, less time is taken, that is 40 minutes to attain a stable spectrum with Na2S2O3 in presence of K(SbO)C4H4O6.1/2H2O,
compared to 60 minutes in absence of a catalyst.
3.4 Variation of Absorbance of the Reduced Phosphopolyoxomolybdate Anion
The intensity of the blue-coloured complex was studied spectrophotometrically by following the change in its absorbance at different λmax with time using different
reductants. The absorbance produced with the same amount of phosphorus (0.05 mg L-1) for a period of 30 minutes, showed that using tin(II) chloride, ascorbic acid and hydrazine sulphate, absorbance increased and fell periodically with time. By visual examination, the blue colour was seen to fade. This could be due to conversion from one PMB to another. While with, Na2S2O3 and
Na2S2O4 absorbances steadily increased implying that the
intensity of the blue colour increased with time. This could be attributed to the number of Mo- centres reduced depending on the reducing power of the reductant.
3.5 Method Development and Validation
Phosphorus compounds and PO43- derivatives are
considered to be the limiting nutrients in most stagnant and flowing waters [15,16]. A method that is simple, affordable but accurate is there fore essential for monitoring the levels of PO43- in such systems. Na2S2O4
as a new reductant in the molybdenum blue method for PO43- determination, was found to reduce [PMo7O24]
3-anion at pH 1.71, in the presence of
K(SbO)C4H4O6.1/2H2O and λmax found to be 880nm,
while λmax was 825nm in the absence of
K(SbO)C4H4O6.1/2H2O.
3.5.1 Detection and quantification limits
The LoD for Na2S2O4 method was found to be 0.76 μg
mL-1 and 0.54 μg mL-1, respectively in absence and presence of catalyst with LoQ of 2.7 μg mL-1 and 1.9 μg mL-1. The obtained detection limits showed that the method could be applied in the detection and quantitation of PO43- concentration as low as 1 μg mL-1, respectively.
3.5.2 Selectivity
The effect of several cations and anions on the Na2S2O4
method was studied in detail by adding different amounts of to the PO43- solution as shown in (Table 1). The
greatest anionic interference to the method was expected to come from SiO32- that reacts with molybdate anion
forming heteropolyacids which on reduction yield molybdenum blue species with similar absorption maxima. Formation of silicomolybdate can be suppressed by addition of oxalic acid to the molybdate reagent. Cationic interferences come mainly from cationic species that form similar blue polymolybdates like Cu2+, Pb2+. Copper(II) ion has been reported to have catalytic effect on H3PMo12O40 / I redox reaction [17]. The use of
International Journal of Current Trends
in Engineering & Technology
Volume : I, Issue : II (Jan.- Feb. 2015)
Copyright © 2015 IJCTET.IN, All right reserved
Table 1
Unique high interference of NO2- to the sodium dithionite method in the presence of K(SbO)C4H4O6.1/2H2O, using
0.03 mg L1- for testing
Foreign ion added Phosphorus recovery (mg L1-)
In absence of interference
In presence of 1 mg / 50 ml ion
In presence of 10 mg / 50 ml ion SiO32-
NO2-
Cu2+ Pb2+
0.041±0.002 0.121±0.004 0.087±0.003
0.013±0.003 0.0085±0.002 0.003±0.002
0.017±0.002 0.053±0.001 0.020±0.001
0.011±0.001 0.016±0.002 0.0215±0.002
Source: (this work)
3.5.3 Sensitivity of the method
The method does not allow a wider variation in acidity as shown by pH 1.71. Interfering substances affected the method, but to different degrees (Table 1). Some interfering substances form molybdenum complexes which are difficult to reduce, hence diminishing the amount of PPMA available for reduction. This unique feature was shown by the NO2- which formed a yellow
PMB yet other interferents formed blue products. The rate of reduction of PPMA, the accelerating effect of catalyst and the absorbance produced are all dependent on the nature of the reducing agent.
3.5.4 Working range and linearity
The working range was found to lie between 0.0027 - 0.8 mg L-1 of phosphorus concentration. The linearity of the method as measured by the correlation coefficient of linear regression curves (r2) indicated a good linear relationship between phosphorus concentration and absorbance.
3.5.5 Accuracy and precision
In this work, the accuracy of the Na2S2O4 method was
validated by calculating the mean percent recovery of the spiked samples for seven replicates at different concentration levels. A recovery of above 90% was obtained for the different concentration levels in presence and absence of K(SbO)C4H4O6.1/2H2O. The precision of
the method was validated by determining the SD and
RSD of the spiked samples for seven replicates at each of the concentration levels. For low concentration, the RSD
was relatively high, however, for higher concentrations the RSD value was low. The RSD values less than 20% are regarded as good. Therefore, the method is still suitable in the concentration levels considered.
3.6 Orthophosphate Anion Content in Selected Ugandan Waters
The technique was employed to determine PO43- content
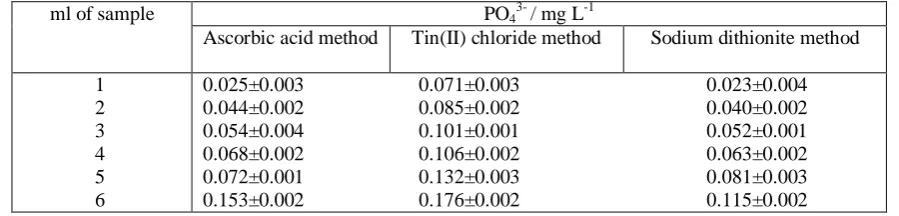
in selected waters and the results were compared to those obtained using ascorbic acid and tin(II) chloride (Table 2). The results suggest that Na2S2O4 can be applied as a
reductant for the phosphomolybdate anion in the quantification of PO43-.
Table 2
Comparison of ascorbic acid and tin(II) chloride methods to sodium dithionite method for the quantification of PO43-
anion in water from Bwaise channel
ml of sample PO4
3-
/ mg L-1
Ascorbic acid method Tin(II) chloride method Sodium dithionite method
1 2 3 4 5 6
0.025±0.003 0.071±0.003 0.023±0.004
0.044±0.002 0.085±0.002 0.040±0.002
0.054±0.004 0.101±0.001 0.052±0.001
0.068±0.002 0.106±0.002 0.063±0.002
0.072±0.001 0.132±0.003 0.081±0.003
0.153±0.002 0.176±0.002 0.115±0.002
Source: (this work)
The very high PO43- concentration in water from Bwaise
channel could have been due to the various sources of phosphorus such as domestic and industrial sewage discharge. The water was collected a day after it had rained and when it rains people open their latrines, discharge food residues and other waste and refuse into
the channel. Phosphorus being essential in metabolism, it is always present in animal waste. The results demonstrated that PO43- was present in water from a
International Journal of Current Trends
in Engineering & Technology
Volume : I, Issue : II (Jan.- Feb. 2015)
particles and is used by plants so its concentration was low in this clean water.
The PO43- concentration in water from the well was
probably due to the fact that the well is not protected and is surrounded by many households that carry out human activity. The anion concentration may also be as a result of storm runoff to the well and also phosphorus that had been buried probably was exposed when digging up the well. Also the natural filters such as trees and shrubs in this area have been eliminated. The results obtained for the determination of PO43- in selected water samples
showed that the S2O42- method compares favourably with
the conventional ascorbic acid and SnCl2 methods and is
reliable for analysis of water samples in the environment. The results of spectral characterization tests showed that the rate of reduction of PPMA is dependent on the nature of the reductant, its concentration and presence of a catalyst. The absorption maxima (λmax) within the
400-1000 nm range and sensitivity of the method also depend on nature of the reductant. Two λmax were shown by PMB
system generated by ascorbic acid, hydrazine sulphate and sodium dithionite when used in presence of a catalyst. On the other hand, a single peak was shown by
PMB generated using tin(II) chloride, sodium
thiosulphate and sodium dithionite in absence of a catalyst.
Na2S2O3 was proposed as a new reductant but during the
analysis, it was discovered that the thiosulphur entered as a heteroatom. So, the method cannot be employed for the determination of PO43- independently in waters since it
suffers the above interferences. Probably the method could be used if [S2Mo18O62]4- or [PS2MoxOy]n- are
removed from solution such that spectrophotometric determinations represent [PMo12O40]3-. It is worthy of
note that the results of this work tie up very well with those of related studies [18,19] carried out in this laboratory, as well as those of APHA – AWWA – WPCF [20]. Noteworthy also, according to Murphy and Riley
[21], using ascorbic acid as the reductant,
phosphomolybdenum blue (PMB) had a λmax 885 nm and
880 nm as per ISO6878/1-1986(E) international standards. In this work, the shape of the spectrum remained the same indicating that two PMBs of different identity are formed.
Similar studies on the current state of Ugandan waters have been launched in this department, including those of River Rwizi in Mbarara Township in western Uganda [22], Tororo Municipality (eastern Uganda) [23], Kasese Mining Town at the foothills of the Rwenzori Mountains in western Uganda [24], and Lake Victoria [25]. This may in time sound an awakening call for the relevant authorities to take appropriate action to the looming environmental and public health concerns in the country and beyond.
4. Conclusions
In this work the spectral characteristics of various molybdenum blues produced using various reductants was examined. The results of spectral characterization tests have shown that the rate of reduction of PPMA is dependent on nature of the reductant, its concentration and presence of a catalyst. For example, ascorbic acid and tin(II) chloride allowed the PMB to reach its maximum absorbance in the shortest time. The absorption maxima (λmax) within the 400-1000nm range
and sensitivity of the method also depend on nature of the reductant. Two λmax are shown by PMB system
generated by ascorbic acid, hydrazine sulphate and sodium dithionite when used in presence of a catalyst. On the other hand, a single peak is shown by PMB generated using tin(II) chloride, sodium thiosulphate and sodium dithionite in absence of a catalyst.
The orthophosphate anion was examined in selected waters of Uganda using molybdenum blue method based on reductants not used before. Validation studies on the S2O42- method were conducted under controlled
conditions. The results indicated that the method for PO43- determination was successful. In comparison to the
ascorbic acid and tin(II) chloride methods, the S2O4
2-method is also sensitive. It compared well with the ascorbic acid and tin(II) chloride methods as revealed by the values obtained for detection limits. Na2S2O3 was
proposed as a new reductant but during the analysis, it was discovered that the thiosulphur entered as a heteroatom. So, the method cannot be employed for the determination of PO43- independently in waters since it
suffers the above interferences. Probably the method could be used if [S2Mo18O62]4- or [PS2MoxOy]n- are
removed from solution such that spectrophotometric determinations represent [PMo12O40]3-.
References
[1] McKelvie, I. D., Peat, D. M. W., and Worsfold, P. J. (1995). Analytical perspective. Techniques for the quantification and speciation of phosphorus in natural waters. Paper presented at the Analytical
Proceedings including Analytical
Communications.
[2] Spivakov, B. Y., Maryutina, T. A., and Muntau, H. (1999). Phosphorus speciation in water and sediments. Pure Appl. Chem, 71(11), 2161-2176. [3] Murphy, S. (2002). General information on
phosphorus. City of Boulder/USGS Water Quality Monitoring.< http://bcn. boulder. co. us/basin/data/NUTRIENTS/info/TP. html.
[4] Jamieson, G. S. (1913). Phosphates in Surface Waters. Industrial & Engineering Chemistry, 5(4), 301-302.
International Journal of Current Trends
in Engineering & Technology
Volume : I, Issue : II (Jan.- Feb. 2015)
Copyright © 2015 IJCTET.IN, All right reserved phosphomolybdic acid. Anal.chem., 58(1),
p223-229.
[6] Leo, M. L. (2007). Handbook of water
analysis.(2nd ed.): New York. Vollstandige Rezension Lesen, 273-283.
[7] Persson, G., and Jansson, M. (1988). Phosphorus in Fresh water Ecosystem. Hydrobiologia, 170, p45-49.
[8] Jeffrey, G. H., Basset, J., Mendhan, J., and Denney, R. C. (1989). Vogel's Text Book of Qualitative Chemical Analysis (5th edition ed.): Longman Group UK Ltd.
[9] Broberg, O., and Pettersson, K. (1988). Analytical determination of orthophosphate in water.
Hydrobiologia, 170(1), 45-59.
[10] Clesceri, L. S., Greenberg, A. E., and Andrew, D. E. (1998). Standard methods for the examination of water and wastewater (20th ed.). NW Washington, DC: American Public Health Association.
[11] Ripp, J. (1996). Analytical Detection Limit guidance & Laboratory Guide for Determining Method Detection Limits: Wisconsin Department of Natural Resources Laboratory Certification Program.
[12] Eurachem. (1998). The Fitness of Purpose of Analytical Methods (1st English ed., 1-75 ed.). [13] Sicilia, D., Rubio, S., and Perez-Bendito, D.
(1992). Kinetic determination of antimony(III) based on its accelerating effect on the reduction of 12-phosphomolybdate by ascorbic acid in a micellar medium. Analytical Chemistry, 64(13), 1490-1495.
[14] Berenblum, I., and Chain, E. (1938). Studies on the colorimetric determination of phosphate.
Biochemical Journal, 32(2), 286.
[15] Conley, D. J., Paerl, H. W., Howarth, R. W., Boesch, D. F., Seitzinger, S. P., Havens, K. E., et al. (2009). Controlling eutrophication: nitrogen
and phosphorus. Science (Washington),
323(5917).
[16] Correll, D. L. (1998). The role of phosphorus in the eutrophication of receiving waters: A review.
Journal of Environmental Quality, 27(2), 261-266. [17] Sadakane, M., and Steckhan, E. (1998). Electrochemical Properties of Polyoxometalates as Electrocatalysts. Chemical Reviews, 98(1), 219-238.
[18] Mbabazi, J., Yiga, S. and Ssekaalo, H. (2011).
Evaluation of environmental sulphide by
stabilisation of the initial product of the pentacyanonitrosylferrate(II)-sulphide reaction.
Journal of Toxicolology and Environmental Health Science, 3(4), 95-100.
[19] Musagala, P., Ssekaalo, H., Mbabazi, J. and Ntale, M. (2013). A spectrophotometric method for quantification of sulphite ions in environmental
samples. Journal of Toxicolology and
Environmental Health Science, 5(4), 66-72.
[20] AWWA, WPCF American Public Health
Association (1981). Standard Methods for the Examination of Water and Wastewater, 5th ed. [21] Murphy, J., and Riley, J. P. (1962). A modified
single solution method for the determination of phosphate in natural waters. Analytica Chimica Acta, 27, 31-36.
[22] Egor, M., Mbabazi, J., and Ntale, M. (2014). Heavy Metal and Nutrient Loading of River Rwizi by Effluents from Mbarara Municipality, western Uganda. International Journal of Chemistry and Materials Research, 2(5), 36 – 47.
[23] Matsiko, J., Mbabazi, J., and Ntale,M. (2013). Impact of Municipal effluent on the water quality of receiving rivers: A case of River Aturukuku in Tororo District, Eastern Uganda. American Open Analytical Chemistry Journal, 1(1), 01 – 11.
[24] Mwongyera, A., Mbabazi, J., Muwanga, A., Ntale, M. and Kwetegyeka, J., (2014). Impact of the disused Kilembe mine pyrites on the domestic water quality of Kasese town, western Uganda.
Caribbean Journal of Science and Technology, 2, 482 – 495.
[25] Nnamuyomba, P., Mbabazi, J., and Ntale, M. (2014). Dichloro-diphenyl-trichloroethane (DDT)
residue levels in marketed Silver Fish