C
Center for Mind/Brain SciencesMeC
Constructing multiple objects
across space and time
Evelyn Muschter
Supervisor: David P. Melcher
Doctoral School in Cognitive and Brain Science
XXX cycle
Table of Contents
List of Figures ... 4
List of Tables ... 4
Abstract ... 5
Chapter 1: Overview and general introduction ... 6
1.1. Neural oscillations and their role in sensory processing ... 7
1.2. Evidence for a specific role of alpha band oscillations in perception ... 9
2.1. Temporal integration windows: combining or segmenting sensory input over time ... 13
2.2. Underlying brain oscillations of temporal integration ... 15
2.3. Individual alpha peak frequency ... 17
3.1. Multisensory Integration: combining information about the same object or event across the senses 17 3.2. Evidence of multisensory integration in behavior ... 20
3.3. Neurophysiological perspectives on multisensory integration ... 23
3.4. The importance of spatial reference frames ... 27
3.5. Is multisensory integration automatic or strategic? ... 33
CHAPTER 2: Alpha frequency as a predictor of perceptual outcome in temporal integration ... 36
Introduction ... 36
Motivation for the present study ... 38
Materials and Methods ... 39
Participants ... 39
Task and design ... 39
Data acquisition ... 41
Data preprocessing ... 42
Data Analysis ... 43
Time-frequency analysis in sensor space ... 43
Individual alpha frequencies ... 43
Instantaneous frequency ... 44
Results ... 45
Behavior ... 45
Time-frequency analysis ... 46
Discussion ... 49
Chapter 3: The role of attention to modality in spatial multisensory integration ... 51
Motivation for present study ... 56
Materials and Methods ... 57
Participants ... 57
Stimuli ... 58
Task and design ... 59
Data acquisition ... 60
Data preprocessing ... 61
Data Analysis ... 62
Time-frequency analysis in sensor space ... 62
Event-related fields (ERFs) analysis in sensor space ... 62
Statistical testing in sensor space ... 63
Results ... 64
Behavior ... 64
Pre-stimulus time frequency ... 67
Post-stimulus event-related neural activity ... 69
Post-stimulus time- frequency ... 72
Discussion ... 72
Chapter 4: Is visual attention rhythmic? ... 77
Introduction ... 77
Rhythmic processes in attention ... 84
Motivation for the current study ... 86
Materials and Methods ... 87
Participants ... 87
Task & stimuli ... 87
Data Analysis ... 89
Sinusoidal curve fitting ... 89
Fourier transformation ... 90
Results ... 91
Performance ... 91
Curve fitting ... 92
Fourier power analysis ... 93
Fourier phase coherence analysis ... 94
Discussion ... 95
Chapter 5. General Discussion ... 98
References ... 101
LIST OF FIGURES
Figure 1. Experimental setup for integration/segregation task in Wutz et al., 2016.. ... 14
Figure 2. Models of multisensory processing. ... 24
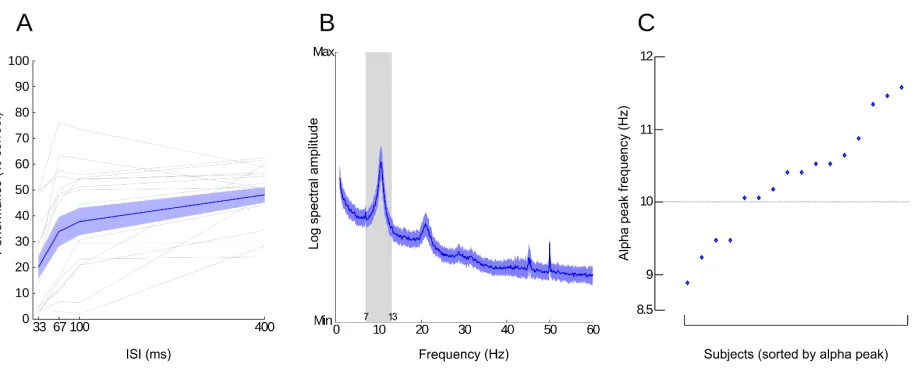
Figure 3. Individual alpha frequency. ... 36
Figure 4. Illustration of dual flash experimental trial ... 41
Figure 5. Behavior and Resting State analysis.. ... 46
Figure 6 .Correlation between performance improvement and resting state alpha peak frequencies.. 47
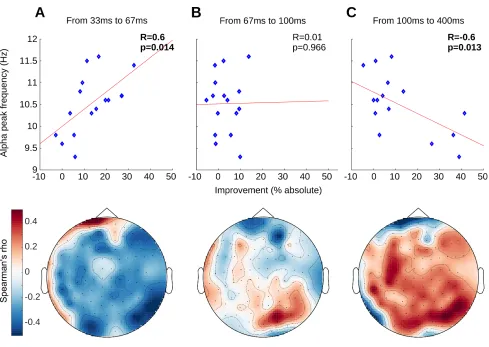
Figure 7. Pre-stimulus instantaneous alpha frequency.. ... 49
Figure 8. Illustration of a trisensory experimental trial.. ... 60
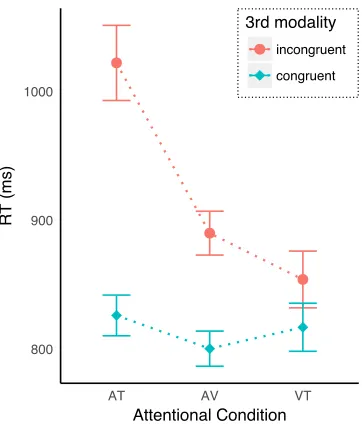
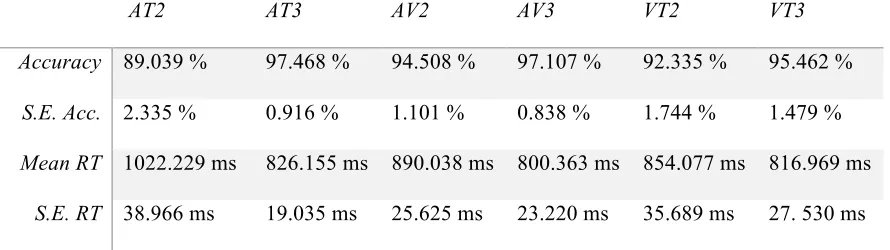
Figure 9. RT as a function of attention condition and stimuli congruency ... 65
Figure 10. Pre-stimulus alpha and beta time-frequency contrasts for attend to versus ignore ... 68
Figure 11. Pre-stimulus alpha and beta time-frequency contrasts for attention conditions ... 69
Figure 12. Sensor-level global field power.. ... 70
Figure 13. Sensor-level global field power as a function of attention and stimulus congruency. ... 71
Figure 14. Schematic trial sequence of MOT task for both conditions ... 88
Figure 15. Task performance correlation. ... 92
Figure 16. Mean accuracy time course and best fitting sinusoidal function ... 93
Figure 17. FFT power spectrum ... 94
Figure 18. FFT phase results. ... 95
ABSTRACT
For us to interact with our environment we must have an understanding of the location and properties of the
objects within it over time. Incoming stimuli from different sensory modalities continuously provide
information. In order to create a coherent percept, it is necessary to combine these sensory signals in the brain
into a single representation of an object or event. Temporal integration, the process of combining information
over time is one important prerequisite for it. Likewise, multisensory integration, the process of combining
information from different sensory modalities to generate a coherent percept is of great importance.
Furthermore, as our environment is not static but dynamic it is necessary to combine sensory information over
time and space. Despite, the ever-increasing neuroscientific results, much about the underlying brain
mechanisms remains unknown. This thesis describes an effort of understanding how sensory information are
integrated in the brain and what effects attention has on how we integrate multiple objects in space and time.
Chapter 1 introduces the reader to the existing literature on neural oscillations, specifically alpha band
frequency, which is hypothesized to play a critical role in temporal processing and attention. This is followed
by a review of the literature on temporal integration and the theoretical background of multisensory
integration. The following chapters will report the three studies conducted: Chapter 2 describes the first
study, a MEG study that investigates the role of alpha oscillations in temporal integration. Chapter 3 reports
the second MEG study, which focuses the role of attention to modality in multisensory integration. Chapter 4
presents the third study, a behavioral oscillations study, which focuses on the role of neural oscillations in
CHAPTER 1: OVERVIEW AND GENERAL INTRODUCTION
We live in a world where sensory input arrives continuously over time from all the different senses.
This input is merged in the brain, resulting in a seamless perception of our environment. The brain
must parse this flow of information into coherent objects and events. This involves combining
information for the same event or object over time and across senses. The overall goal of this thesis
is to shed light on how the human perceptual system constructs multisensory objects in space and
time. In particular, we investigated the role of neural oscillations on the construction of
spatio-temporal percepts. To this end, we conducted three experiments. The thesis is structured the
following way:
In Chapter 1, I will begin by introducing neural oscillations. In particular, I will focus on the
alpha frequency band, which is hypothesized to play a critical role in attention and in temporal
processing of stimuli into a coherent perceptual event in terms of objects over time. Then, I
introduce the concept of temporal integration windows as a way to characterize whether stimuli are
combined over time or treated as unique events, and the potential link between temporal integration
windows and oscillations. In the final part of the chapter, I will focus on multisensory integration and
the way input is combined across senses.
In Chapter 2, I describe an MEG experiment that investigated the role of neural oscillations in
the temporal integration and segregation of stimuli in rapid succession. We tested the hypothesis that
pre-stimulus alpha oscillations influence perceptual outcome. To this end, we utilized a
paired-stimulus paradigm with a variable temporal gap between the presentation of a near-threshold flash
and an above-threshold flash while recording MEG. Evidence for alpha band frequency as a
predictor of perceptual outcome is presented and discussed.
Chapter 3 focuses on the spatial-temporal integration of information across the senses. In a
stimulus, would alter pre-stimulus neural oscillation and the way in which the stimulus was
processed in sensory cortices. The main findings were that attention to modality is reflected in
pre-stimulus alpha oscillations as well as in early evoked responses in the constituent sensory regions.
In Chapter 4 we further investigated the role of neural oscillations in selective attention in a
dynamic scene. In a behavioral experiment we investigated two different multiple object tracking
strategies and measured fluctuations in accuracy over time (“behavioral oscillations”: Landau &
Fries, 2012). The main finding was that performance fluctuated rhythmically in both tasks, although
at different frequencies.
Finally, Chapter 5 reviews and summarizes the main findings.
1.1. Neural oscillations and their role in sensory processing
Neural oscillations, also described as brain waves, are the rhythmic pattern of neuronal activity in the
central nervous system. Brain waves are recordable via electroencephalography (EEG) and
magnetoencephalography (MEG). These measurement devices are ideal as they provide high
temporal resolution, which is necessary in order to reflect the synchronous waxing and waning of
summed postsynaptic activity of large neuronal populations (Wang, 2010). In other words, neural
oscillations reflect the rhythmically fluctuating excitability states of neuronal populations across
different temporal and spatial scales. Signals recorded from EEG and MEG have thus proven to be
powerful tools in the attempt of understanding brain functions as they provide a multidimensional
resolution comprised of time, space, frequency, as well as power and phase of a given frequency
band. However, oscillatory pattern can also be measured by means of behavioral outcomes.
Meaning, the dynamics of a given task can be mapped out by repeatedly measuring reaction times
and/or accuracy to an event at equally spaced out, different points in time, in order to create time
series – sets of collective ordered observations of quantitative characteristics (Kendall and Buckland,
Perhaps the most fundamental and extensively studied parameter of neural oscillations is
frequency, which is defined as the number of cycles per second and expressed in Hertz (Hz).
Research has established different frequency bands, which are in turn associated with different
functional brain states. Although the exact boundaries are rather loosely defined and often a subject
of scientific debate, they are divided into delta (0-4 Hz), theta (4-8 Hz), alpha (8-14 Hz), beta (14-30
Hz), low gamma (30-60 Hz), high gamma (60-90 Hz) and high frequency oscillations (above 100
Hz; VanRullen and Dubois, 2011). Interactions between different neural populations are reflected in
different frequency band oscillations. For example, Buschman et al. (2007) showed that while
gamma band synchronization between prefrontal and parietal areas of the monkey brain were related
to bottom-up processes, top-down processes were reflected in beta band synchronizations. Findings
as such provide support for the idea that information is transmitted through different frequency
bands, depending on their directionality (top-down/bottom-up). Furthermore, a series of reports
found that in unisensory cortical areas bottom-up processing is reflected in gamma-band (30 Hz and
above) frequencies, whereas top-down processes are predominantly reflected in lower frequency
bands (below 30 Hz) (Fell et al., 2003; Fontolan et al., 2014; Fries, 2015; Frey et al., 2015;
VanRullen, 2016).
Power is another informative parameter of neural oscillations and is expressed as the squared
amplitude of the energy at a given time-frequency point. Variations in power result from a change in
synchronization of the underlying neuronal population. Furthermore, power is inversely related to its
frequency. In other words, signals with high frequency usually exhibit a lower power compared to
low frequency signals (Buzsáki and Draguhn, 2004).
Phase is the parameter of neural oscillations that defines the position of a signal at a specific
time point along the oscillatory wave and ranges from 0-360°. Phase is an informative measure of the
timing of neuronal activity and thus has been suggested to define discrete windows of excitation and
Neuronal oscillations can generally be categorized in induced and evoked responses. On one
hand, evoked responses stem from an onset of an external event, such as the onset of a stimulus.
They are commonly expressed as event-related potentials (ERPs) or event-related fields (ERFs), the
summation over trials of identical phase. On the other hand, induced oscillations can occur
independent of external stimulation. Therefore, they might not be time-and phase-locked to the onset
of a stimulus. Instead, cognitive processes such as attention can modulate induced oscillations. Taken
together, data from these studies are supportive of a model that divides interactions between neuronal
populations into encoding (reflected in gamma-band oscillations) and integrative (reflected in lower
frequency oscillations) (Gratton, 2018). Such model suggests that the brain segregates information
according to their directionality into different frequency channels (Donner and Siegel, 2011; Gratton,
2018). Moreover, empirical findings from these studies complement the hypothesis that neural
oscillations enable information transfer in an efficient manner among different brain areas through
specific and dynamic neuronal networks (Fries, 2009).
1.2. Evidence for a specific role of alpha band oscillations in perception
One of the most extensively studied frequencies is the alpha band. Alpha is commonly defined as the
frequency band between 8 and 12 Hz (Lange et al., 2014). Alpha frequency is the most prominent
rhythm in the human cortex, and is often already visible in raw EEG and MEG recordings. When
Berger first scientifically described alpha, it was thought to be reflective of states of low arousal
because an occipital alpha amplitude increase resulted from subjects closing their eyes (Berger,
1929; Adrian and Matthews, 1934). For years, alpha band power was interpreted as a neural correlate
of cortical idling. Many scientific investigations in the last decades have shown that alpha is not just
merely a passive brain rhythm.
Studies in attention have shown that active top-down control (task/ goal directed) is reflected
have shown that alpha power increases in task-irrelevant brain areas prior to stimulus onset when
attention is directed towards a different sensory modality (Fu et al., 2001; Bauer et al., 2012;
Mazaheri et al., 2013). For example, Mazaheri et al. (2013) investigated pre-stimulus alpha and beta
power modulations when participants attended to one modality, while suppressing another distracting
sensory modality. When participants attended to the visual modality (judging the orientation of
different gratings), while ignoring a temporally synchronous auditory distractor (tones of different
pitches), alpha power in the early visual cortex decreased along with a 14-16 Hz increase in the right
supramarginal gyrus, a region that regulates auditory pitch processing. Furthermore, trial-by-trial
pre-stimulus alpha modulations in these task-specific cortical regions were correlated with the
respective task discrimination times only when the target was presented with a distractor, suggesting
that region-specific alpha power modulations have functional consequences for stimulus processing.
Likewise, spatial attention, which describes directing attention to a specific location, is also
reflected in alpha band power in corresponding brain regions (Thut et al., 2006; Busch and
VanRullen, 2010; Jones et al., 2010). Data from EEG and MEG studies showed that pre-stimulus
alpha band power in sensors contralateral to the attended spatial location over the corresponding
sensory brain areas is decreased, while alpha band power ipsilateral to the attended spatial location
exhibits an increase from baseline (Jones et al., 2010). Alpha power modulations were found in the
pre-stimulus time period when attention was directed towards the location of an upcoming visual
stimulus contralateral to the cued location in primary visual areas. Thut and colleagues (2005)
recorded EEG during a spatially cued target detection task. Subjects were instructed to attend to a
cued location (right or left) and respond if the presented visual stimuli appeared in the cued or
un-cued location. The researchers found contralateral alpha (8-14 Hz) modulations that were correlated
with subject’s response times. Van Ede and colleagues (2011) utilized a tactile discrimination task in
which participants’ attention was cued with full validity to either the right or left hand, and found
the primary sensory cortex. This effect was more pronounced for the beta band (15-30 Hz) and was
highly consistent across subjects. Importantly, contralateral beta power decreased with time towards
the anticipated stimulus onset, which shows that somatosensory beta power modulations are
produced by contralateral suppression. Interestingly, because the tactile stimulation was to occur
either at 1, 2 or 3 s, after the cue, they were also able to investigate if these power modulations
exhibited temporal specificity. They found that lateralized alpha and beta power modulations track
the temporal position at which an expected event is to occur. Thus, their results indicate that not only
spatial attention, but also temporal specificity is reflected in pre-stimulus modulations of alpha and
beta oscillations in the primary somatosensory cortex. Müller and Weisz (2011) found an asymmetric
modulation of auditory alpha in the right auditory cortex as pre-stimulus alpha power increased when
participants’ attention was directed to the right. This is plausible due to the functional specialization
of the auditory cortex: while left hemisphere of the auditory cortex is specialized for rapid temporal
processing, the right hemisphere of the auditory cortex is specialized for spectral processing (Zatorre
and Belin, 2001). They additionally found that the right auditory cortex was functionally connected
with the frontal eye-field during an ipsilateral alpha power increase (Müller and Weisz, 2011). Thus,
the alpha band rhythm reflects an active, spatially specific top-down influence of sensory processing.
Importantly, alpha band oscillations are not just reflective of attentional control, but also
reflect conscious perception of visual, auditory and tactile stimuli (Ruhnau et al., 2014). Conscious
perception of visual stimuli is negatively correlated with alpha power over posterior EEG/MEG
sensors corresponding to the visual cortex (Ergenoglu et al., 2004; Van Dijk et al., 2008; Wyart and
Tallon-Baudry, 2009; Iemi et al., 2017). Furthermore, neuromodulation studies have demonstrated
that cortical excitability fluctuates along with ongoing alpha rhythm in a series of transcranial
magnetic stimulation studies by Romei and colleagues (Romei et al., 2008a; 2008b; 2010). They
investigated participants’ individual stimulation threshold of phosphene (visual illusory percepts)
et al., 2008b). An active entrainment of the alpha rhythm in the visual cortex impaired participants’
ability to detect near-threshold stimuli in the hemifield contralateral to the stimulated side (Romei et
al., 2010). By means of MEG recordings, Leske et al. showed pre-stimulus alpha power decreases in
the primary auditory cortex prior to the successful detection of an auditory near-threshold stimulus
(Leske et al., 2015). In addition, similar alpha power findings have been reported in the
somatosensory domain (Schubert et al., 2009; Weisz et al., 2014).
Finally, the phase of the ongoing alpha oscillations regulates the temporal aspects of input
processing (Busch et al., 2009). According to the inhibition-timing hypothesis, stimulus processing is
facilitated during troughs, and hindered during peaks of the ongoing oscillatory activity (Mathewson
et al., 2009; Klimesch et al., 2007). Furthermore, the phase of oscillatory alpha activity can be
entrained with rhythmically presented stimuli prior to the actual target stimuli presentation (Ronconi
and Melcher, 2017) or reset by stimuli from another sensory modality (Romei et al., 2012). It must
be pointed out that in accord with the function inhibition hypothesis discussed earlier: both alpha
phase dependency and alpha band entrainment are contingent on high pre-stimulus alpha power
(Jensen and Mazaheri, 2010).
Taken together, alpha band activity is linked to cortical activity and takes on a modulatory
role for sensory perception. Data from neuroscientific studies, such as the ones discussed here, have
facilitated researchers to form the specific hypothesis of gating through inhibition (Jensen and
Mazaheri, 2010). Alpha band activity is a sensory gating mechanism that regulates information
processing between sensory and higher-order cortices. In summary, there is much scientific
agreement that high alpha inhibits task-irrelevant areas and connections, while low alpha enables
2.1. Temporal integration windows: combining or segmenting sensory input over time
Although sensory input is continuously arriving over time, it needs to be parsed by our perceptual
system into specific objects by combining input over time. In the following paragraph, I will discuss
vision as a continuous process through time. Visual perception is often modeled as a process of
chunked instantaneous visual input in forms of ‘snapshots’ or frames. These ‘snapshots’ can
integrate information over considerable periods of time, identified as temporal integration windows.
Due to the diverse nature of the stimuli our visual system encounters, different temporal integration
windows have been proposed (Melcher et al., 2014). Durations shorter than 30-40 ms cannot be
discriminated by the visual system (Mach, 1965) and are instead experienced as a time point rather
than a continuance. While around 40 ms is commonly considered the lower threshold, data from
temporal integration studies has facilitated researchers to accumulate evidence for temporal
integration windows that extends to 2-3 seconds (Hasson et al., 2008; Fairhall et al., 2014). Various
masking and integration studies have tested the concept of time windows of around 200-300 ms
(Jiang et al., 2005; Fracasso et al., 2010; Melcher and Fracasso, 2012) as well as around 100 ms
(Enns and Di Lollo, 2000; Breitmeyer and Öğmen, 2006; Wutz et al., 2014). When stimuli are
presented in rapid succession at the same location, the temporal offset, their interstimulus interval
(ISI), is the determining factor of perceptual outcome. Following the concept of temporal windows:
short ISIs of around 50 ms support integration, where the two stimuli are temporally and spatially
fused together and perceived as one. An increase in ISI annihilates integration in favor of segregation
and the stimuli are perceived in its true quantity. Data from a variety of studies adduce evidence in
support of such temporal integration windows (VanRullen and Koch, 2003; van Wassenhove et al.,
2007; Cecere et al., 2015; Samaha and Postle, 2015; Baumgarten et al., 2017).
For example, with a variation of the missing element task (Di Lollo, 1980) we previously
showed that temporal integration and segregation for visual stimuli can be seen as complementary
displays of seven full and one half circle each at random locations in a symmetrical lattice with a
variable ISI in between are presented. Importantly, the individual element locations of the two
displays did not overlap; except for in the case of the half circles, where the two circle halves were in
the same complimentary location. Hence, a complete grid of 16 elements was defined over the two
stimulus frames and ultimately left one location empty. In integrations trials, participants were to
indicate the location where no circle was presented in both displays. While in segregation trials,
participants were asked to identify the location in which the half circles were presented.
Figure 1. Experimental setup for integration/segregation task in Wutz et al., 2016. The superimposed blue circles specifies the integration task, while the superimposed red circles indicates the segregation task. The combination of display 1 and 2 highlight both tasks combined within the same stimuli.
This set up enabled us to investigate the temporal dynamics (by means of varying the ISI) of visual
integration versus segregation by changing the task, while keeping the stimulation the same. While
integration performance declined with longer ISI, segregation performance increased. Average task
performance was equivalent at 68 ± 27 ms ISI for both tasks (Wutz et al., 2016). These results are in
support of the idea that integration windows serve a function of preserving visual stability and help
brain’s way of coping with the processing lag of sensory input by accumulating visual information
over longer meaningful intervals before processing and hence reducing perceptual effort. This
consequently results in a loss of temporal resolution within the period of integration. However, given
a sufficient latency, changes in the environment are still rapidly detectable by perceiving sequential
stimuli as disjoint. Segregation can be interpreted as a form of habituation, a process to avoid error of
integration through a reduction of blending and enhancement of change detection (Huber, 2014). If a
sequence of stimuli is presented at the right time, the percept accurately reflects the sequence. It can
be attributed to the fact that the first stimulus has become habituated and is no longer apparent by the
time the second stimulus appears (Huber, 2014).
Conclusively, temporal integration windows can be seen as perceptual cycles in which the
brain integrates input over a certain window length or cycle (Baumgarten et al., 2017). Now when
successive stimuli fall within a certain time interval they are perceptually integrated. On the contrary,
if stimuli fall in two temporal windows they are perceived as distinct events.
2.2. Underlying brain oscillations of temporal integration
Temporal integration windows provide an intrinsic concept in the quest of understanding perception.
To date, a few studies provide direct evidence for potential underlying neuronal mechanisms. The
most compelling candidate being neural oscillations (VanRullen et al., 2014; Samaha and Postle,
2015; Wutz et al., 2016). Several behavioral studies have shown that perception and behavior exhibit
cyclic or rhythmical pattern (Landau and Fries, 2012; Drewes et al., 2015; Wutz et al., 2016;
Ronconi and Melcher, 2017). Such findings have further been supported by studies using EEG/
MEG. Cycles of specific neuronal oscillations form the potential mechanism for temporal integration
windows and furthermore correlate with behavioral outcomes.
Data from EEG/MEG studies facilitated researchers to show that the phase of an ongoing
VanRullen et al., 2011; Ronconi and Marotti, 2017; Ronconi et al., 2017). We (Wutz et al., 2016)
showed this for example, in the previous described integration/segregation study in both MEG and
behavioral measures for both tasks with opposite phase in the theta frequency (3-5 Hz).
Recently further work from our lab (Ronconi et al., 2017) has used multivariate decoding of
EEG data to show that temporal integration/segregation was dependent on the pre-stimulus phase of
parieto-occipital regions. In order to investigate if different temporal integration window lengths
were reflected in different frequencies, they used two different integration tasks: A two-flash fusion
task, where two flashes, separated by a brief temporal gap (variable ISI) appear in the same location
and an apparent motion task, where such two flashes appear at different locations. They found the
highest decoding accuracy for the two-flash fusion task in the phase of alpha, but for the apparent
motion in the phase of theta. The phase of alpha oscillations seems to temporally organize incoming
input and prevent information overload (Gips et al., 2016).
VanRullen’s wagon wheel illusion (VanRullen et al., 2006) provides evidence for a
correlation between perception and alpha band power in occipital areas. In this paradigm, a
constantly rotating wagon wheel sometimes creates the illusion of reversing the rotational direction.
The researchers found a 13 Hz power decrease just before the onset of the illusionary percept as well
as an increase just before participants transitioned back to perceiving the real motion direction. These
findings offer support to the idea that motion is perceived through short temporal windows (< 100
ms).
With their publication, Cecere et al. (2015) further provided causal evidence for alpha
oscillations setting temporal integration windows. They utilized transcranial alternating current
stimulation (tACS) combined with EEG in a double-flash illusion task. The illusionary percept of
two visual flashes arises when a brief flash is presented with two auditory stimuli at short latencies
(Sham et al., 2000). The researchers showed that participants’ individual occipital-parietal peak
manipulate that peak frequency and to that end the length of the individual alpha cycles, which
modulated the illusory temporal window (Cecere et al., 2015).
2.3. Individual alpha peak frequency
Much research has investigated individual alpha peak frequency (IAPF) and its relationship to
cognition (for a review see Klimesch, 1999; 2012). Alpha frequency shows a lot of inter- as well as
intra-individual variations but is generally defined within the ranges of 8-14 Hz. With his
publication, Klimesch (1999) set the definition of IAPF as the maximum power value in the EEG
frequency spectrum between 7.5 and 12.5 Hz of an individual. Findings from a variety of studies
have shown that individuals with higher IAPF show better cognitive performance (Klimesch et al.,
1993; Clark et al., 2004; Jin et al., 2006; Grandy et. al, 2013a). Per contra, a variety of neurological
pathologies exhibit low IAPF such as Alzheimer’s disease (Moretti et al., 2004), Attention deficit
hyperactivity disorder (Lansbergen et al., 2011) and traumatic brain injury (Dockree et al., 2004).
Furthermore, IAPF is a highly stable measure in healthy adults, a neurophysiological trait marker
that is not easily modifiable (Kondacs and Szabo, 1999; Grandy et al., 2013b; Campisi and La
Rocca, 2014). As alpha oscillation has been proposed as the gatekeeper of temporal integration
windows via the timing of functional inhibition, faster IAF allow for “faster alternations between
‘open’ and ‘closed’ states of information transfer” (Grandy et al., 2013a) and thus orchestrate an
effective integration of information.
3.1. Multisensory Integration: combining information about the same object or event
across the senses
The brain does not just have to make sense of various incoming visual stimuli. In our daily life, we
encounter a plethora of different sensory stimulation besides visual information. Imagine you are in
you have never experienced such spectacle. Your senses are consistently bombarded with a
plentitude of different information: buzzing sounds, flashing lights and different scents. The brain
tries to make sense of such noisy data by integrating inputs coming from different sensory modalities
when these are presented in close temporal or spatial proximity, appearing to come from a common
source. For example, you will react to approaching dangers much faster when they are perceived
through multiple senses. Hence, when you see and hear a rowdy taxi driver approaching while you
are trying to cross the street, you hopefully will avoid collision as both sensory inputs inform you
about the same danger. In other words, sensory inputs which are temporal and spatial congruent tend
to originate from a common source. That is, sensory information that occur at the same place and at
the same moment in time tend to integrated together through multisensory integration (MSI) and
perceived as one. In pursuance of an effective interaction with a dynamic multisensory environment,
the brain imposes order on the multitude of sensory information. Various sensory modalities have to
communicate with each other in order to create perceptual representations. Such communications
are between the representations of space and time in different sensory modalities. However, space is
not a unitary concept.
The spatial reference system is a relational system consisting of located objects, reference
objects, and the spatial relations that may obtain between them (Shelton & McNamara, 2001). Based
on the underlying coordinate system and the information that is stored in the resultant spatial
representation, a distinction can be made between egocentric and allocentric reference systems.
Egocentric reference frames define specific locations and orientations with respect to the observer.
Allocentric reference frames refer to spatial relations with respect to the environment. Examples of
egocentric reference frames include eye-centered, head-centered or body-centered coordinate
systems. Egocentric reference frames are sensorimotor representations of space, while allocentric
reference frames are map-like representations of space. Integration of different reference frames is
encoded based on an egocentric reference frame in the respective sensory system. Visual, tactile and
auditory (as well as vestibular and kinesthetic for navigation in an environment) information is used
in efficient manner in the sense that little attention is needed for spatial processing, but any
discrepancies between different sensory modalities or attempt to ignore this sensory information is
computationally effortful and prone to error. Vision is first encoded in an eye-centered (retinotopic)
coordinate system whereas audition in a head-centered (craniotopic) one and somatosensory
information are encoded in a body-centered (somatotopic) frame of reference.
Visual space is constructed from a series of retinal images, like snapshots, that are pieced
together using information about the direction in which the eyes were pointing in each snapshot to
create a ‘mind’s eye’ view of space (Stein, 1989) and are first processed in the primary visual cortex
(V1) where each hemisphere processes input from the opposite eye. Auditory space is perceived
even more indirectly. The direction of sound source is computed from differences in the amplitude
and timing between the two ears, from the coloration provided monaurally by the pinna, and from the
direction in which the head and body were pointing at the time. Acoustic inputs are first processed in
the primary auditory cortex (A1). Likewise, somatosensory space is a complicated construct, partly
built on the somatotopic maps of the skin relayed to the brain, but equally reliant on motor and
proprioceptive signals indicating what the limbs where doing when objects were encountered. Tactile
information is first processed in the postcentral gyrus, an area also known as the primary
somatosensory area (S1). The somatosensory cortex is highly organized, with areas corresponding to
specific body parts and the size of these areas depending on the complexity of the sensation
processed by that body part.
Yet, all these different spatial coordinate systems are brought together equivalently by the
brain into a unified concept of perceived space. The existence of multiple reference frames raises
are temporally aligned, but initially encoded in a variety of egocentric spatial reference frames?
What underlying mechanism enables such spatial perception?
In the following sections, I will begin by reviewing the role of spatial reference frames in the
existing literature of MSI. While MSI research includes uncovering the details and limitations of
spatial as well as temporal synchrony, for the purpose of this review, I will mostly focus on the
spatial aspects of multisensory integration. First, I will describe the different ways that information
from different senses can interact on a behavioral level. Then I will describe the neurophysiological
perspectives on multisensory integration. After that, I will consider the specific topic of spatial
reference frames for MSI. Finally, I will discuss the role of attention in MSI.
3.2. Evidence of multisensory integration in behavior
While the earliest studies on sensory perception investigated sensory modalities in isolation, many
researchers have addressed the interactions between modalities in behavioral experiments.
Multisensory interactions on one hand may allow for more focus on relevant information, while
filtering out background noise. On the other hand, it could also cause distraction when attention is
captured involuntarily by task-irrelevant sensory input or biased by another sensory modality.
Intersensory bias is the fast operating process that causes perception to tend to agree to the
assumption that one single event has occurred. This can happen even when the spatial locations of
the two events are not overlapping. Intersensory bias is a mechanism of the perceptual system in
response to a discrepancy of two sensory modalities. Such bias takes place towards the stronger
modality, the one that has a higher spatial or temporal resolution in the given task. One example of
intersensory bias is the phenomenon of the Ventriloquism effect(Jack & Thurlow, 1973) where the
voice of the puppeteer seems to appear from the puppet itself. The effect describes an audio-visual
spatial conflict in which vision influences the perceived sound location. The puppeteer is well versed
capture occurs, and the audience believes in what they see – a speaking puppet. In terms of reference
frames, we can see that while the sound is encoded craniotopically, vision is coded retinotopically.
Even though the spatial locations do not match, observers experience a unified concept – that of a
speaking puppet. The standard explanation of the Ventriloquist effect is that auditory and visual
stimuli occur in close enough temporal and spatial proximity; therefore, the perceptual system
assumes that a single event occurred. A translocation of sound towards the visual event seems to be
the most ecological solution as the spatial resolution of the visual system is superior to that of the
auditory system.
This is similar to what we experience when watching a movie: The sound appears to originate from
the speaker’s lips, instead of from loudspeakers, the actual audio output device. Some of our
perceptual experience appears unimodal. For example, when you are trying to understand what
another person is saying, you would think that all the information you are receiving comes from what
you hear. However, most of the time, but especially when one listens to someone speaking in a noisy
environment, perception is facilitated by what we hear, but also by what we see: the speaker’s face
and lip movements (Sumby and Pollack, 1954; van Wassenhove, 2013).
Although the visual system may dominate judgments of spatial location in many tasks, it is
not to say that vision is unaffected by other sensory modalities through crossmodal perception, which
does not just manifest itself in incongruent sensory combinations. For instance, visual detection can
be enhanced at the location of sound (Frassinetti et al., 2002) or touch (Macaluso et al., 2000). Sham
and colleagues (2000) have demonstrated that sometimes the auditory system can also trick the
visual system into an illusion. Participants in their study were asked to hold fixation on a computer
monitor and report how frequently a white disk was flashed in the periphery of the screen.
Participants were very accurate when performing this purely visual task alone. Notwithstanding,
when one of these flashes was accompanied with multiple auditory beeps, participants were fooled
provides ample evidence of what we hear can influence what we see, it needs to be pointed out that
the experiment demonstrates the temporal superiority of the auditory system over the visual system.
Intersensory biases have been shown to occur between various sensory combinations such as vision
and audition (Jack & Thurlow, 1973), audition and touch (Caclin et al., 2002), vision and
proprioception (Pavani, Spence & Driver, 2000).
Moving visual stimuli seem to capture the direction of moving sound. This effect is very
robust, as it even holds when movements are in fact in opposite directions (Oruc, 2008), but also for
different stimuli combinations such as visual-tactile. Caclin et al. (2002) have shown that sound
localization judgments can be biased by spatially incongruent, but temporal synchronous tactile
stimulation. They found that tactile stimulation to the fingers will capture auditory perception
irrespective of spatial attention to the tactile stimuli. Others found that the same holds true, at least
for simple auditory and visual stimulus combinations such as beeps and light flashes (Bertelson et
al., 2000; Vroomen et al., 2001).
Multisensory integration can also result in surprising new percepts, where no sensory
dominance occurs, instead MSI in which the result is not equal to either sense. The archetype of such
crossmodal illusions is the McGurk Effect (McGurk & McDonald, 1976), which involves an
alteration of meaning. The perceived phoneme is neither, the correct visual nor auditory stimulus by
itself, but a new phoneme that derives from a combination of both stimuli information. Integration of
sight (the speaker’s face and lip movement) and the sound of speech enhance perceptual brain
activities (Calvert, Campbell & Brammer, 2000; Sams et al., 1994; van Wassenhove et al., 2007).
As discussed earlier, when listening to a speaking person we often do not only rely on what we hear,
but also heavily on what we see: their lip movements. Normally, in a real life situation visual and
auditory input are congruent, so we integrate them into one percept. It is especially helpful to use
visual cues in a noisy environment to decipher ambiguous sounds. When a slight mismatch occurs
syllable [“fa”], the resulting synthesis yields a new illusory auditory percept of the syllable [“ga”].
The perceived sounds are often consistent with the visual stimuli in terms of place of articulation
(such as labial-lip articulated sounds like [/b/ /m/] or non-labial sounds articulated behind the lips [/d/
/n/]), while also consistent with the auditory stimulus in terms of manner of articulation. It is known
that the brain integrates redundant spatial information from vision and audition & provides
information about higher-order aspects, here phonemes or as in ventriloquism – about spatial
location.
3.3. Neurophysiological perspectives on multisensory integration
It is not surprising that in the past many neuroscience studies have focused on understanding the
underlying mechanism of individual senses. Thanks to the advances in neuroimaging techniques over
the last years, these sensory areas could be investigated more in depths and detail, and it is now clear
that in fact much of the brain does not only consist of specialized unisensory areas, but is also
multisensory. As shown in the earlier section on behavioral evidences of MSI it has been amply
documented that stimuli from different modalities largely interact. Despite the increasing interest in
interactions between the senses, there is a long-standing debate concerning the underlying
mechanism of multisensory integration. The concept of primary sensory areas has been well
established for decades. These are defined, specific brain regions dedicated to the perception and
processing of individual sensory information from one, but not any other, sensory modality. Such
unimodal areas, in the occipital cortex for vision, regions in and around the superior temporal gyrus
for audition, and regions in the post-central cortex for touch, were thought to communicate with
associational areas, which then in turn integrate percepts. This hierarchical model of multisensory
integration is depicted in Figure 2a. It shows that incoming sensory stimuli are initially processed in
their respective primary sensory areas, (represented as colored triangles in 2a) and from there
Evidence has been accumulated for early MSI in unitary sensory regions, mostly through
intracranial work in primates and cats. For example, Morrel (1972) found that a great portion of
neurons in primary visual cortex responded to auditory stimuli. We know now that these individual
sensory areas (as well as motor circuits), which are devoted to processing information from a single
sense, are highly interconnected, but also respond to input from different sensory modalities
(Macaluso et al., 2000, Driver & Noesselt, 2008). Figure 2b represents such early bisensory
communication model, in which early interactions between sensory regions exist, that facilitate an
integration of stimuli from different sensory modalities. Imaging data has provided further evidence
for early integration effects of audio-tactile as well as audio-visual stimuli in the auditory cortex
(Kayser et al., 2005; Kayser et al., 2008; Schurmann et al., 2006) as well as visual-tactile integration
in the somatosensory cortex (Kida et al., 2007).
Finally, the alternative account of a mixed model as illustrated in Figure 2c arises from a
combination of the first two models. That is, primary sensory regions can be modulated by other
sensory stimuli, and are then integrated into precise representations in anatomically higher-order
areas.
Figure 2. Models of multisensory processing. The three points of the largest triangle represent the somatosensory (S), visual (V), and auditory (A) streams. Color slices in the corner indicate primary, secondary, and tertiary unimodal areas. Hierarchical multisensory processing is represented by the purple hexagon (M). Arrows indicate flow of sensory
information. a: Traditional, hierarchical views of multisensory processing posit that streams are integrated after initial
unisensory processing. b: Recent research has also supported the model of early direct interactions between primary
sensory cortices. c: The mixed model of multisensory processing combines these two views to describe how early
The landmark study by Stein in cats (Stein and Meredith, 1993), and later in macaque
monkeys (Wallace and Stein, 2001), has shown the involvement of the superior colliculus (SC). This
midbrain structure controls orientation and coordination of movements. Furthermore, the superior
colliculus receives visual, auditory and somatosensory input, due to the presence of multisensory
neurons. Many of these inputs then converge topographically ordered onto a single multisensory
neuron (Stein and Meredith, 1993). Ergo, one suggestion of how different spatial reference frames
are interpreted by the brain is through the existence of multisensory neurons. These neurons are
excited by inputs from more than one sensory modality. Consequently, when multisensory stimuli
are present, these neurons can integrate their responses in a predictable manner. Cell recordings in
the SC enabled an operational definition of MSI as the presence of a number of neuronal impulses
significantly higher (superadditive) when evoked by a crossmodal combination of stimuli, than when
evoked by the most effective of these stimuli alone.
These findings helped understanding and establishing the three core principles of MSI. One:
MSI is more likely to occur when multiple unisensory stimuli occur at the same location in space.
Indeed, multisensory neurons in SC possess diverse receptive fields, one for each modality. These
receptive fields overlap in space, and, if two or more stimuli are in the same spatial register, brain
activity is enhanced. Consequently, if stimuli are not aligned in space, no enhancement will take
place.
Two: As discussed in the beginning of this review, for MSI to take place effectively, stimuli need to
be also in close temporal proximity (Bushara, Grafman& Hallett, 2001; Wallace et al., 2004). This is
generally defined in time windows, ranging in the order of a few up to several hundreds of
milliseconds depending on the complexity of the to-be-integrated stimuli (Spence and Squire, 2003).
different modalities travel at different speed (for example, during a thunderstorm, we see the
lightening before the thunder until it is within reach).
Three: Another important principle of MSI is the rule of inverse effectiveness. MSI is more likely to
occur when the individual stimuli are rather weak. Very salient inputs are easily detectable, so a
combination of them would have a moderate detection and/or localization effect. In contrast, a
combination of weaker cues evokes a substantially enhanced response, when compared to them on
their own. These findings in animal cell recordings established a foundation for the understanding of
MSI in humans as well.
It has been found that between 10-50 % of the neuron in unisensory regions also receive
inputs from other sensory modalities (Lemus et al., 2010; Meredith et al., 2012). The discovery of
these multisensory neurons allowed for a better understanding of how the brain is organized and
helps explain how individuals who suffer a loss of one sense early in life often develop greater acuity
in their remaining senses. For example, in an fMRI study, Karns et al. (2012) demonstrated that
congenitally deafness can facilitate neuroplastic changes in the human brain. When the auditory
cortex receives no auditory stimuli, vision and somatosensation make use of Heschl’s Gyrus to
process these alternative sensory stimuli. Compared to a control group, the Heschl’s gyrus of
congenitally deaf individuals showed an increased response to somatosensory stimuli as well as,
albeit to a lesser degree, visual stimuli due to the existence of multisensory neurons (Karns et al.,
2012). Neuroimaging as well as single-cell recording and behavioral data have brought to light that
the relative locations, intensity and the timings of stimuli determine multimodal perception in the
brain (Andersen et al., 1997; Felch et al., 2016; Wallace et al., 2004). Furthermore, stimuli that are
temporally and spatially aligned can elicit a multimodal response that exceeds unimodal responses
(Macaluso et al., 2000; Stein et al., 2004).
In a study using positron-emission tomography (PET), Macaluso et al. (2000) found that
on multimodal levels. Participants had to attend either to a series of light flashes or a series of finger
vibrations presented either to the left or to the right periphery. The researchers sought out to identify
brain areas showing differential activations to attended hemifield, but also to distinguish areas
showing this spatial effect within only one modality versus multimodal effects, a spatial effect
independent from stimulated modality. In the first experiment, subjects were instructed to attend to a
modality and a side (vision-attend right, vision-attend left, touch-attend right, touch-attend left).
Activations for the visual task fell within cortical areas involved in low-level visual judgments (BA
19), such as the anterior medial occipital gyrus, the superior occipital gyrus and the superior parietal
lobe, whereas tactile stimuli caused activation in cortical areas previously associated with
somatosensory processing – the inferior postcentral gyrus and superior postcentral gyrus.
Modality-specific attentional effects (right vs. left) were found in the left superior occipital gyrus for visual
tasks, and in the left superior postcentral gyrus for somatosensory stimuli. Their second experiment
only involved tactile conditions, but manipulated the presence of vision (eyes open versus eyes
closed), and replicated the findings of experiment one. Interestingly, they also found activation in the
left intraparietal sulcus only in the eyes open condition (when participants could see their stimulated
hand), which confirms the multimodal nature of the cortical area.
3.4. The importance of spatial reference frames
On one hand, we humans have a strong naïve impression of unified space. On the other hand,
laboratory studies show that we are easily fooled and often misperceive or have incoherent
perceptions. This might reflect the fact that our brain codes the location of stimuli in multiple
different reference frames simultaneously, and it is not clear how, or even whether these different
reference frames are combined at any moment in time. Various different solutions have been
proposed such as the supra-modal reference frame. Here, sensory reference frames are translated into
orienting towards a multisensory target involves, at the input stage, a sensory code in a retinotopic
map for the visual cues, in a head-centered map for the auditory cues, and in a somatotopic map for
the tactile cues. A constant transforming of these diverse maps into a common frame would be
computationally heavy as environment is not static, especially during locomotion. An allocentric
reference frame must then be created anew constantly, as it is not one of the sensory reference
frames. This solution seems to be too costly and therefore very unlikely as spatial processing of
known and new environments alike seem to be automated processes that require little attention.
Some studies propose that spatial information is remapped between different frames of reference.
Although there are some differences in implementations, various theoretical accounts posit a
transformation process from one reference frame to another implying a space-to/from-body
remapping process (Heed et al., 2015, Badde et al., 2014, Noel and Wallace, 2016; Zampini et al.,
2003). Transformations that translate for example auditory into retinotopic coordinates still remain as
the same distinct reference frames, but are re-coded. Exactly how and where such remapping takes
place in the human brain remains to be uncovered. A third proposed solution is an alignment of
distinct unisensory reference frames (Stein, 1992). How would these individual coordinate systems
align in order to accurately locate and act upon a multisensory stimulus in space?
As discussed earlier Stein and Meredith (1993) established the involvement of multisensory
neurons in MSI. When visual, auditory and somatosensory inputs are received, many of these
converge topographically ordered onto a single multisensory neuron (Stein and Meredith, 1993). One
suggestion of how different spatial reference frames are interpreted in the brain is through these
multisensory neurons. These neurons are excited by inputs from more than one sensory modality.
Therefore, when multisensory stimuli are present, these neurons can integrate their responses in a
predictable manner.
In contrast, Spence and Driver (2004) argue for a transformation of the initial natural
based on the superior spatial resolution of the visual system compared to the other sensory systems.
Thus, the superior colliculus represents stimulus position predominantly with respect to the current
gaze position rather than to its position in sensory space. This is plausible as this brain area is closely
tied to eye movements and orienting responses, and is made up of mostly oculomotor neurons.
Cohen and Andersen (2002) found further support of this theory through a series of reaching
experiments in monkeys. They showed that parietal neurons in the posterior parietal cortex transform
sensory eye-, head-, body-, or limb position signals into a common eye-centered frame of reference.
Such common reference frame in turn can facilitate movement coordination communication and
might thus be an efficient way to represent locations of different sensory targets. Based on behavioral
findings in transcranial magnetic stimulations (TMS) to the posterior parietal cortex (PPC), Pasalar et
al. (2010) confirmed this brain region’s involvement in visual-tactile multisensory integration.
Several other studies have since confirmed that establishing an egocentric reference frame
through integration of multiple sensory inputs is one of the many tasks of the posterior parietal cortex
(Calton and Taube, 2009; Buchholz et al., 2011; McGuire and Sabes, 2011; van Gilder et al., 2016;
Kaulmann et al., 2017). However, many details about these spatial reference frames remain an issue
of much debate and two theories have crystalized: one being that frames of reference exhibit
temporal development, suggesting a dynamic evolvement of coordinate transformations in a large
neuronal population. That is, neurons encode information in different reference frames at different
times throughout a task. Per contra, frames of reference show no temporal development and therefore
different neuronal populations encode coordinate transformations, which are necessary for response
movements etc., simultaneously across the parietofrontal circuit (Buneo et al., 2008; Hadjidimitrakis
et al., 2017). With their publication, Hadjidimitrakis et al. (2017) are in support of the later theory as
they found that most V6A neurons in monkeys consistently used body-centered frames of reference
through the chronological stages of a delayed reaching task. Although at earlier stages of the task,
involvement of these neurons in eye-hand coordination. Whereas the preeminent pure body-centered
frame of reference might be indicative of online movement control (Hadjidimitrakis et al. 2017).
A majority of studies investigating spatial reference frames has been of unisensory nature:
stimuli consisted of one single modality, and often included executing a movement. To date, much is
still unknown about remapping of spatial reference frames from different sensory modalities. If
stimuli are truly remapped into an eye-centered frame of reference, what happens when vision is
taken out of the game? A remapping to a retinotopic reference frame seems to makes little sense in
the blind or when integrating sensory inputs that does not involve vision. What then happens when
vision does not facilitate MSI, can it hinder it? Interesting findings come from MEG results in a blind
subject (Ioannides et al., 2013). In response to tactile stimulation to the median nerves, the
researchers found significantly different time-frequency differences from the alpha band up to higher
frequencies in the visual cortex of the blind participant compared to two control participants. Based
on time-delayed mutual information, Ioannides and colleagues (2013) further introduced first MEG
evidence that in the blind, somatosensory information is funneled from primary somatosensory
cortex through posterior parietal cortex to visual brain areas.
Various bimodal experiments have brought to light that the spatial link in MSI between the
auditory and somatosensory modalities is much weaker than the one between other modality parings.
Different research groups found spatial modulatory effects on temporal order judgment tasks (TOJ)
regarding which modality was presented first between auditory and visual stimuli (Spence et al.,
2003; Zampini et al., 2003), and between visual and tactile stimuli (Spence et al., 2003). That is
participants’ performance was worse when the two stimuli (auditory and visual; visual and tactile)
were presented in the same location, compared to opposite locations. Interestingly, Zampini and
colleagues (Zampini et al., 2003) found that spatial TOJs (“Which side was presented first?”) were
unaffected by the stimuli modalities. Through a series of experiments, they found that performance
reference frames of the presented stimuli as well as the particular stimulus dimensions bear a critical
influence on MSI. Spence and colleagues used an interesting variation of the TOJ task by adding a
crossed-hands condition and found that this caused a decline in performance, suggesting a failure to
remap visuo-tactile space accurately (Spence et al., 2003; Shore, Spry & Spence, 2002). In contrast,
such spatial modulatory effects, as seen in the visuo-tactile and audio-visual domain, seem to be
absent in audio-tactile TOJs (Zampini et al., 2005). Murray et al. (2005) reported similar results in an
EEG study. They found no differences in reaction time facilitation or distinguishable neural
correlates when audio-tactile stimuli were presented either right/left aligned or misaligned. They
furthermore localized audio-tactile interactions to auditory association areas contralateral to the side
of somatosensory stimulation at around 50 ms post-stimulus onset. They concluded that audio-tactile
integration occurs early in sensory processing in a traditionally considered auditory (and thus
unisensory) area and across a wide spatial separation. The authors themselves advocate that this
holds true for early audio-tactile MSI across space, and that perceptual-cognitive phenomena such as
capture and ventriloquism manifest at later stages of sensory processing (Murray et al., 2005).
However, recently Noel and Wallace (2016) made use of TOJ task in order to further
investigate the influence of conflicted somatotopic and external reference frames by utilizing
different body postures as well as conditions of sensory deprivation. Participants were asked to judge
the order of two tactile stimuli to their ankles in conditions where their legs were either uncrossed or
crossed, which results in conflicting somatotopic and external reference frames. As expected,
performance was worse in the crossed leg condition. A possible explanation is that the primary
somatosensory cortex maps skin location independently of the posture of a give body part (Penfield
and Rasmussen, 1950; Hlushchuk and Hari, 2006), so in order to make sense of a tactile stimulus the
brain must realign tactile coordinates in order to locate the origin of that stimulus (Heed et al., 2015).
Such remapping takes place by combining somatosensory input with proprioceptive and visual cues
from the initial feed-forward sweep of neural activity to the primary somatosensory cortex. The later
conscious experience is brought to life by the activity of the somatosensory network involving
recurrent connections from association areas (Azañón & Soto-Faraco, 2008). Additionally, in Noel
and Wallace‘s study participants were deprived of vision by blindfolding and/or placed in an
anechoic chamber to remove all auditory input. Visual deprivation alone showed no significant effect
on the task performance differences between uncrossed and crossed leg postures. However, auditory
and even more so, audio-visual deprivation intensified the tactile temporal acuity differences. These
results reveal that the most detrimental modulation of tactile localization is the combined removal of
audio-visual information. Hence, both audio and audio-visual spatial information are remapped onto
and integrated with somatosensory anatomical locations in the context of spatial localization.
However, what seems to be surprising is the directionality of the effect. Given the modality-specific
spatial reference frames, the removal of another sensory modality should make spatial localization
easier and not hinder it. Furthermore, why did visual deprivation, the removal of the visual spatial
reference frame show so little effect here? Can we explain it based on Spence’s and Driver’s
translocation of reference frames into the retinotopic frame of reference?
One idea is that visual and auditory stimuli that appear near the body or on a particular body part
(“near space”) are mapped in a body-centered fashion (Graziano et al., 1997; Graziano et al., 1999;
di Pellegrino & Làdavas, 2015), and thus provide redundant information rather than conflicting
information. A removal of this integrated remapped information then causes detrimental effects.
These results indicate that other sensory modalities and the combinations thereof, have an influence
to the mechanisms governing alignment between somatotopic and external reference frames. They
strongly suggest an alignment of multiple reference frames takes place in order to decipher
exteroceptive spatial information. Taken together, these TOJ effects indicate that redundant spatial
cues can facilitate MSI. It becomes clear that for MSI to be effective spatial as well as temporal
suggest that the magnitude of MSI depends on the particular combination of sensory modalities, and
propose that audio-tactile interactions may be less spatial than any sensory modality combination in
MSI involving vision.
Heed et al. (2015) suggest that integration of multiple concurrently active spatial
representations best describes the process of spatial localization. They propose coordinated
oscillatory activity as a suitable underlying mechanism that allows for large-scale parallel
representations of multiple spatial formats and the formation of an integrated location estimate.
Although studies have shown that a translocation and alignment of reference frames takes place, they
are limited in terms of investigating the interplay of just two sensory modalities.
3.5. Is multisensory integration automatic or strategic?
An important topic to consider is whether MSI is an automatic process and therefore always occurs.
An automatic process is insensitive to the load of the current task demands and is consequently not
influenced by other competi