RESEARCH
Assessment of drought tolerance of 49
switchgrass (
Panicum virgatum
) genotypes
using physiological and morphological
parameters
Yiming Liu
1, Xunzhong Zhang
1*, Hong Tran
2, Liang Shan
2, Jeongwoon Kim
3, Kevin Childs
3,4, Erik H. Ervin
1,
Taylor Frazier
5and Bingyu Zhao
5*Abstract
Background: Switchgrass (Panicum virgatum L.) is a warm-season C4 grass that is a target lignocellulosic biofuel spe-cies. In many regions, drought stress is one of the major limiting factors for switchgrass growth. The objective of this study was to evaluate the drought tolerance of 49 switchgrass genotypes. The relative drought stress tolerance was determined based on a set of parameters including plant height, leaf length, leaf width, leaf sheath length, leaf rela-tive water content (RWC), electrolyte leakage (EL), photosynthetic rate (Pn), stomatal conductance (gs), transpiration rate (Tr), intercellular CO2 concentration (Ci), and water use efficiency (WUE).
Results: SRAP marker analysis determined that the selected 49 switchgrass genotypes represent a diverse genetic pool of switchgrass germplasm. Principal component analysis (PCA) and drought stress indexes (DSI) of each physi-ological parameter showed significant differences in the drought stress tolerance among the 49 genotypes. Heatmap and PCA data revealed that physiological parameters are more sensitive than morphological parameters in distin-guishing the control and drought treatments. Metabolite profiling data found that under drought stress, the five best drought-tolerant genotypes tended to have higher levels of abscisic acid (ABA), spermine, trehalose, and fructose in comparison to the five most drought-sensitive genotypes.
Conclusion: Based on PCA ranking value, the genotypes TEM-SEC, TEM-LoDorm, BN-13645-64, Alamo, BN-10860-61, BN-12323-69, TEM-SLC, T-2086, T-2100, T-2101, Caddo, and Blackwell-1 had relatively higher ranking values, indicating that they are more tolerant to drought. In contrast, the genotypes Grif Nebraska 28, Grenville-2, Central Iowa Germ-plasm, Cave-in-Rock, Dacotah, and Nebraska 28 were found to be relatively sensitive to drought stress. By analyzing physiological response parameters and different metabolic profiles, the methods utilized in this study identified drought-tolerant and drought-sensitive switchgrass genotypes. These results provide a foundation for future research directed at understanding the molecular mechanisms underlying switchgrass tolerance to drought.
Keywords: Panicum virgatum, Germplasm, Drought tolerance, SRAP marker, Genetic diversity, PCA, Metabolites
© 2015 Liu et al. This article is distributed under the terms of the Creative Commons Attribution 4.0 International License (http:// creativecommons.org/licenses/by/4.0/), which permits unrestricted use, distribution, and reproduction in any medium, provided you give appropriate credit to the original author(s) and the source, provide a link to the Creative Commons license, and indicate if changes were made. The Creative Commons Public Domain Dedication waiver (http://creativecommons.org/publicdomain/ zero/1.0/) applies to the data made available in this article, unless otherwise stated.
Open Access
*Correspondence: [email protected]; [email protected]
1 Department of Crop and Soil Environmental Science, Virginia Tech, 367
Smyth Hall, 185 Ag Quad Ln, Blacksburg, VA 24061, USA
5 Department of Horticulture, Virginia Tech, 407 Latham Hall, 220 Ag Quad
Ln, Blacksburg, VA 24061, USA
Background
Switchgrass (Panicum virgatum L.) has been designated as a model bioenergy crop in the United States [1]. As a warm-season perennial grass native to North America, switchgrass produces substantial aboveground bio-mass and has adapted to grow over an extensive range of habitats [2, 3]. To avoid competition with food crops for arable land, switchgrass will primarily be grown on marginal land, of which millions of hectares are affected by drought [4]. Drought stress will be one of the major abiotic stresses encountered when growing switchgrass for use as a biofuel. Indeed, a recent study suggests that drought stress could be one major economic risk factor that limits biofuel production [5]. Therefore, a major goal of switchgrass breeding programs is to identify and select for genotypes with improved tolerance to drought stress [6].
Two distinct switchgrass ecotypes, lowland and upland, have been recognized and are generally defined based on their morphological characteristics and habi-tat preferences. Lowland ecotypes are mostly tetraploid (2n = 4× =36), whereas upland ecotypes tend to be octa-ploid (2n = 8× =72) with a few tetraploid exceptions [7]. In addition, lowland ecotypes are usually tall, coarse in leaf texture, and are adapted to grow in the flood plain region of North America. Alternatively, upland ecotypes are shorter, have finer leaves, and are predominantly found in the cooler climates of the northern United States [8, 9]. Previous studies have evaluated a number of switchgrass germplasm cultivars in response to drought stress [4, 10, 11]. Jiang et al. [4] found that drought stress in the upland switchgrass cultivar Cave-in-Rock reduced tissue water content and leaf dry weight while simulta-neously increasing total carotenoid concentration and electrolyte leakage. Interestingly, the values of these parameters returned to those similar to the control (well-watered) plants after re-watering [4]. Under greenhouse conditions, Barney et al. [10] estimated that drought treatments (−4.0 and −11.0 MPa) could decrease the height and number of tillers, as well as decrease the overall leaf area, of drought-stressed switchgrass plants. They also found that drought treatments reduced bio-mass yields by up to 80 % [10]. In a field trial using the switchgrass cultivar Sunburst, drought stress reduced yields to approximately 26 % of those obtained in a year with above-average precipitation [12]. Although upland switchgrass genotypes have generally been considered to be more drought tolerant than lowland genotypes [13, 14], lowland switchgrass cultivars have been reported to outperform upland cultivars under various adverse environmental conditions, including drought stress [10]. Thus, a more systematic evaluation of drought tolerance,
one that examines a greater number of diverse lowland and upland switchgrass cultivars in a controlled manner, is required.
It is difficult to assess drought stress tolerance of a large collection of switchgrass germplasm based solely on the data collected from a drought treatment experiment, because there is significant genetic and phenotypic vari-ation among switchgrass germplasms under non-stressed (control) conditions. The Drought Stress Index (DSI) is a method to evaluate the effect of drought stress on individual germplasm based on the difference between drought treatment and the control plants. DSI is calcu-lated as DSI = (value of trait under stress condition)/ (value of trait under controlled condition) × 100. This equation removes the effect of germplasm variation from the drought stress evaluation and can therefore be used to assess a large collection of germplasm simultaneously [15].
Drought stress has a wide range of effects on the mor-phological, physiological, and biochemical processes in plants, and it can negatively affect the productivity of both dry land and irrigated crops [16–18]. Drought-tolerant plants usually possess a combination of distinct morphological and physiological characteristics such as reduced leaf area, an extensive root system, the ability to sustain high leaf tissue water potential, and maintenance of a higher chlorophyll content and photosynthetic effi-ciency under drought conditions [19, 20]. Physiological measurements such as leaf relative water content (RWC), electrolyte leakage (EL), photosynthetic rate (Pn), stoma-tal conductance (gs), transpiration rate (Tr), and water
guard cells, inositol phosphates can release vacuolar Ca2+ into the cytosol in response to drought stress [33]. Poly-amines (PAs) are ubiquitous, nitrogen-containing polyca-tionic compounds that are found in all eukaryotic cells. In plants, the most abundant PAs are putrescine, spermi-dine, and spermine, and an increase in PA levels has been closely correlated with drought tolerance [34–36]. There-fore, metabolic profiling of drought-stressed plants could help evaluate their tolerance to drought stress.
Various molecular markers have been used to evalu-ate the genetic diversity within and between switchgrass genotypes [37–39]. Among the different types of mark-ers, sequence-related amplified polymorphism (SRAP) markers are useful because of their reproducibility, low cost, ability to amplify without prior knowledge of the target sequence, and ease of use [40]. SRAP markers have been successfully used to evaluate genetic diversity and to construct genetic maps in species ranging from field crops to forage grasses and tree species [40–43].
Systematically evaluating diverse switchgrass germ-plasms in response to drought stress will be help-ful for identifying genetic resources that can be used to breed elite switchgrass cultivars with improved
drought tolerance. Switchgrass germplasms with dis-tinct responses to drought stress will be useful for study-ing the mechanisms underlystudy-ing drought tolerance and for identifying genes or molecular markers that can be used for molecular breeding. The objectives of this study were: (1) to determine the morphological, physiological, and metabolic parameters that are important indica-tors of switchgrass drought tolerance, and (2) to identify drought-tolerant and drought-sensitive switchgrass gen-otypes from 49 genetically diverse lowland and upland switchgrass genotypes.
Results
UPGMA clustering analysis to evaluate the genetic background of 49 switchgrass genotypes
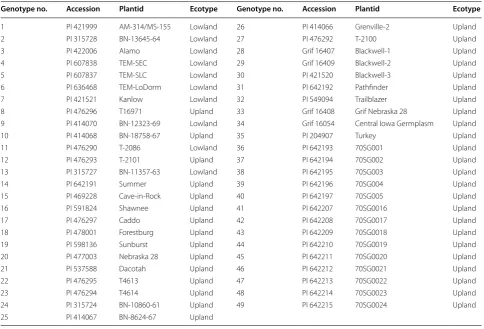
Switchgrass has a diverse geographic distribution [8]. Presently, a method for efficient systematic evaluation of diverse switchgrass germplasms for drought tolerance has not yet been reported. In this study, we selected 49 switchgrass genotypes from 49 accessions that include both upland and lowland ecotypes for drought stress eval-uation (Table 1). To estimate the genetic diversity of the 49 switchgrass genotypes, we performed SRAP analysis
Table 1 List of switchgrass accessions
Genotype no. Accession Plantid Ecotype Genotype no. Accession Plantid Ecotype
1 PI 421999 AM-314/MS-155 Lowland 26 PI 414066 Grenville-2 Upland
2 PI 315728 BN-13645-64 Lowland 27 PI 476292 T-2100 Upland
3 PI 422006 Alamo Lowland 28 Grif 16407 Blackwell-1 Upland
4 PI 607838 TEM-SEC Lowland 29 Grif 16409 Blackwell-2 Upland
5 PI 607837 TEM-SLC Lowland 30 PI 421520 Blackwell-3 Upland
6 PI 636468 TEM-LoDorm Lowland 31 PI 642192 Pathfinder Upland
7 PI 421521 Kanlow Lowland 32 PI 549094 Trailblazer Upland
8 PI 476296 T16971 Upland 33 Grif 16408 Grif Nebraska 28 Upland 9 PI 414070 BN-12323-69 Lowland 34 Grif 16054 Central Iowa Germplasm Upland
10 PI 414068 BN-18758-67 Upland 35 PI 204907 Turkey Upland
11 PI 476290 T-2086 Lowland 36 PI 642193 70SG001 Upland
12 PI 476293 T-2101 Upland 37 PI 642194 70SG002 Upland
13 PI 315727 BN-11357-63 Lowland 38 PI 642195 70SG003 Upland
14 PI 642191 Summer Upland 39 PI 642196 70SG004 Upland
15 PI 469228 Cave-in-Rock Upland 40 PI 642197 70SG005 Upland
16 PI 591824 Shawnee Upland 41 PI 642207 70SG0016 Upland
17 PI 476297 Caddo Upland 42 PI 642208 70SG0017 Upland
18 PI 478001 Forestburg Upland 43 PI 642209 70SG0018 Upland
19 PI 598136 Sunburst Upland 44 PI 642210 70SG0019 Upland
20 PI 477003 Nebraska 28 Upland 45 PI 642211 70SG0020 Upland
21 PI 537588 Dacotah Upland 46 PI 642212 70SG0021 Upland
22 PI 476295 T4613 Upland 47 PI 642213 70SG0022 Upland
23 PI 476294 T4614 Upland 48 PI 642214 70SG0023 Upland
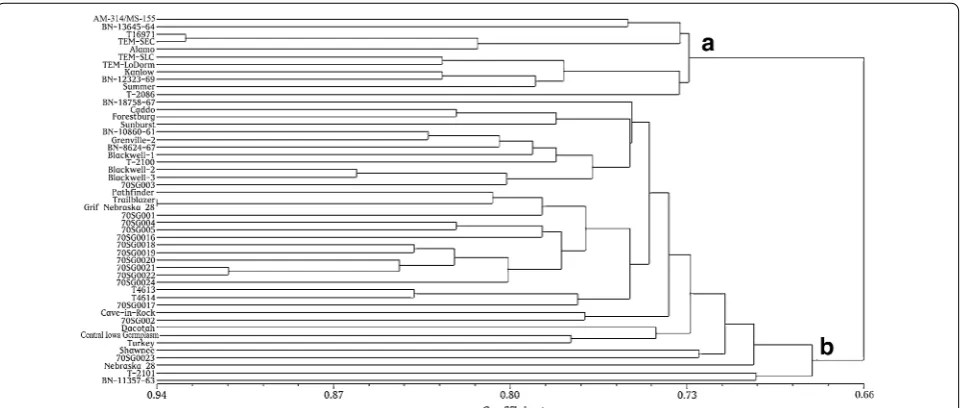
using 12 primer pairs (Table 2). The 12 SRAP primer pairs produced a total of 180 DNA markers, of which 167 were polymorphic (representing 92.4 % of all bands). The SRAP data were used for UPGMA cluster analysis (Fig. 1) at a genetic similarity coefficient value of 0.66. The results of the UPGMA cluster analysis revealed that the 49 geno-types clustered into two groups. Eleven genogeno-types (AM-314/MS-155, BN-13645-64, T16971, TEM-SEC, Alamo, TEM-SLC, TEM-LoDorm, Kanlow, BN-12323-69, Sum-mer, and T-2086) diverged from the others and closely clustered into one group (cluster a). This group included all of the lowland genotypes used in this study (AM-314/ MS-155, BN-13645-64, BN-11357-63, Alamo, TEM-SEC,
TEM-SLC, TEM-LoDorm, T-2086, BN-12323-69, and Kanlow). Interestingly, T16971 and Summer, two upland genotypes, also clustered into the lowland group (clus-ter a). This could be attributed to the limited number of primers (12 pairs) used for SRAP analysis and/or the close genetic background of these upland and lowland genotypes. The other 38 genotypes that were evaluated in this study clustered together in a second large group (cluster b). Thus, the results of SRAP analysis revealed that the selected 49 genotypes represent a diverse genetic pool of switchgrass germplasm.
Physiological and morphological evaluation of the drought responses of 49 switchgrass genotypes by heatmap and PCA methods
We evaluated the 49 switchgrass genotypes for their responses to drought treatment. Drought responses in both well-watered and drought-stressed plants were measured using seven physiological parameters (RWC, EL, Pn, gs, Tr, Ci, and WUE) and four morphological
traits [plant height, leaf length (LL), leaf width (LW), and leaf sheath length (SL)]. Our results found that the effects of soil moisture regime and genotype, as well as the inter-action between soil moisture and genotype, were signifi-cant (p ≤ 0.05) for all physiological parameters (Table 3). However, for each of the morphological parameters (plant height, LL, LW, and SL), the effects of soil moisture regime and the interaction between soil moisture and genotype were not significant (p ≤ 0.05) (Table 3).
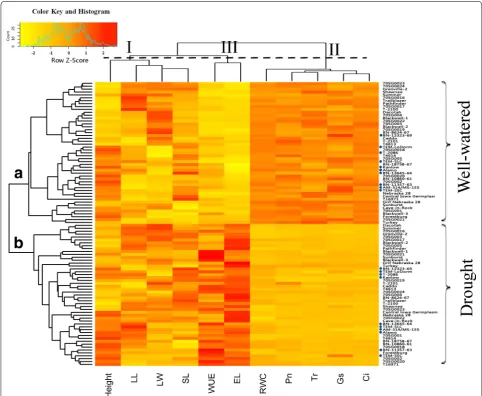
To identify the key parameters for assessing drought tolerance in switchgrass, both physiological and mor-phological measurements were used to plot a heatmap. As shown in Fig. 2, the morphological and physiological Table 2 The number of SRAP fragments generated from 12
primer pair combinations in switchgrass
Primer pair Total no.
of bands No. of polymorphic bands
Percent polymorphic bands (%)
me7 + em15 14 13 92.9
me1 + em19 14 14 100.0
me4 + em19 10 9 90.0
me12 + em5 9 9 100.0
me2 + em4 19 18 94.7
me7 + em4 11 9 81.8
me8 + em13 16 14 87.5
me9 + em13 18 17 94.4
me11 + em15 22 22 100.0
me12 + em9 16 16 100.0
me3 + em3 12 10 83.3
me5 + em19 19 16 84.2
Total 180 167 92.4
measurements of the 49 genotypes, grown under either drought treatment or well-watered conditions (control), were used for hierarchical (row) clustering. When grown under well-watered conditions, the 49 genotypes clus-tered into group a while the same set of 49 genotypes grown under drought conditions clustered into group b. This clear clustering demonstrates that in comparison to control conditions, drought stress treatment alters both the physiological and morphological characteristics for each switchgrass genotype. Interestingly, most of the lowland genotypes tended to cluster together under well-watered conditions (group a in Fig. 2, dot-highlighted); however, these genotypes are scattered under drought stress conditions (group b in Fig. 2, dot-highlighted).
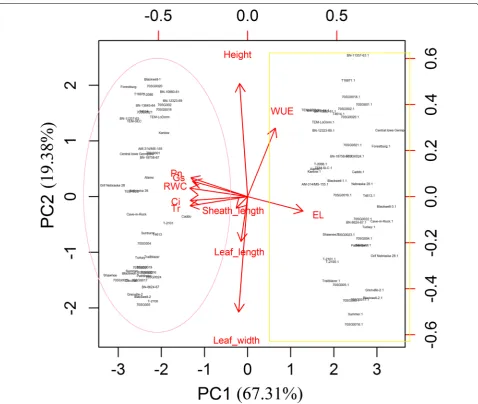
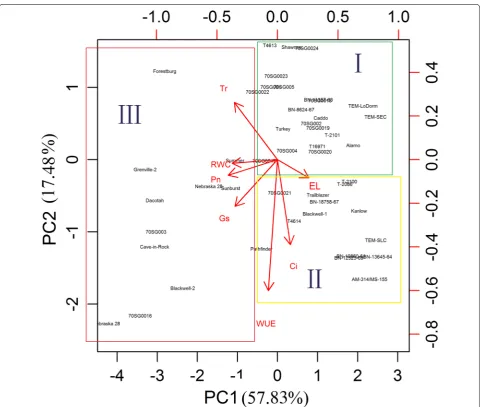
To evaluate the contributions of each parameter in the control and drought-treated switchgrass plants, we per-formed PCA using both physiological (RWC, EL, Pn, gs,
Tr, Ci, and WUE) and morphological (plant height, LL, LW, and SL) parameters collected from plants after 30 days of drought treatment. The physiological parameters contributed more than the morphological parameters to the separation of the control and drought-treated groups (Fig. 3). Among the seven physiological parameters, Pn, gs, Ci, Tr, and RWC were positively associated with the
control treatment (well-watered) group (Fig. 3, circled). WUE and EL were positively correlated with drought treatment (Fig. 3, box). The four morphological traits (plant height, LL, LW, and SL) did not contribute to the separation of the genotypes under either condition. A similar result was found after 15 days of drought treat-ment (Additional file 1: Figure S1).
Hierarchical clustering analysis of the heatmap also indicated that the physiological and morphologi-cal measurements could cluster the 49 genotypes into three distinct groups (top of Fig. 2 group I, II, III). The four morphological measurements, which reflect rela-tive long-term response to abiotic stress, were clustered together (top of Fig. 2, group I) and were not consist-ently different between the control (Fig. 2, group a) and the short-term drought treatment groups (Fig. 2, group b). Thus, morphological traits do not appear to closely
correlate with short-term drought tolerance in switch-grass (Additional file 2: Tables S1, S2).
The four photosynthesis-related traits (Pn, Tr, gs, and
Ci) and RWC were clustered into group II, where all 49 genotypes showed decreased Pn, Tr, gs, Ci, and RWC
under drought treatment (Fig. 2). When the 49 geno-types were evaluated using the drought stress index (DSI), significant differences in the DSI of Pn were observed among the 49 genotypes (Additional file 3: Fig-ure S2). TEM-LoDorm, T2101, TEM-SEC, TEM-SLC, and Alamo all had a higher Pn than the other genotypes under drought stress, resulting in a comparatively higher DSI (>52.0 %). The upland genotypes, including Central Iowa Germplasm, 70SG001, Dacotah, Nebraska 28, and Grenville-2, had a lower DSI for Pn (<17.2 %) in com-parison to the other genotypes. Drought stress reduced gs in all 49 genotypes (Additional file 4: Figure S3). The
BN-13645-64, TEM-SEC, 70SG0024, BN-10860-61, and TEM-LoDorm genotypes had DSIs for gs of less than
44.5 %. Upland genotypes, including 70SG003, Grif Nebraska 28, Cave-in-Rock, Nebraska 28, and 70SG0016, had somewhat lower DSIs for gs, resulting in DSIs less
than 14.6 %. There were significant differences in the DSI for Tr among the 49 genotypes (Additional file 5: Figure S4). BN-12323-69, TEM-SEC, BN-10860-61, BN-13645-64, and T-2100 had greater DSIs for Tr than the other genotypes. Overall, the Tr DSIs for these genotypes were greater than 45.9 %. Alternatively, Grenville-2, Dacotah, Blackwell-3, Central Iowa Germplasm, and 70SG0021 had lower DSI Tr values with DSIs less than 15.3 %. There were also significant differences in the DSIs for Ci among the 49 genotypes (Additional file 6: Figure S5). BN-18758-67, Caddo, BN-13645-64, 70SG0019, and TEM-LoDorm had comparatively higher DSIs for Ci, which resulted in DSIs greater than 48.4 %. In contrast, 70SG003, Nebraska 28, Grenville-2, Central Iowa Germplasm, and 70SG0016 had relatively lower DSIs for Ci, resulting in DSIs of less than 27.2 % for these genotypes. Drought stress reduced the RWC of all switchgrass genotypes (Additional file 7: Figure S6). The genotypes TEM-LoDorm, BN-12323-69, Alamo, TEM-SEC, and BN-10860-61 all had a DSI higher Table 3 Summary of analysis of variance for the effects of treatments, lines, and the interaction on leaf relative water content (RWC), electrolyte leakage (EL), photosynthetic rate (Pn), stomatal conductance (gs), transpiration rate (Tr), inter-cellular CO2 concentration (Ci), water use efficiency (WUE), leaf length (LL), leaf width (LW) and leaf sheath length (SL) with the data of 30 days
** Significant at P ≤ 0.01, *** significant at P ≤ 0.001, NS nonsignificant at P ≤ 0.05
Variable Pn EL RWC Tr gs WUE Height LL LW SL
Treatment *** *** *** *** *** *** NS NS NS *
Lines ** ** ** * * * *** ** * **
than 70.6 % for RWC. Conversely, the upland genotypes 70SG003, Grif Nebraska 28, 70SG0022, Grenville-2, and Summer all had DSIs lower than 39.3 % for RWC.
The WUE and EL were clustered into group III (top of Fig. 2). In general, all 49 genotypes showed increased WUE and EL under drought treatment. The WUE is a parameter that is derived from the Pn and Tr values. WUE consistently increased under drought treatment in all 49 genotypes, while the EL, a measurement of the damage of cell membrane, consistently increased in all 49 genotypes in response to drought treatment. As shown in Additional file 8: Figure S7, a large variation in WUE
was observed. The genotypes Blackwell-3, Forestburg, 70SG0021, Sunburst, and BN-11357-63 tended to have higher DSIs (>187.7 %) for WUE. Alternatively, the geno-types 70SG0017, Grif Nebraska 28, 70SG003, BN-12323-69, and Pathfinder tended to have relatively lower DSIs (<96.5 %) for WUE. Several lowland genotypes, includ-ing BN-13645-64, Alamo, and TEM-SLC, had interme-diate WUEs and DSIs ranging from 122.7 to 154.5 %. The EL reflects cell membrane damage that occurs dur-ing drought stress. In addition, the EL may also affect Tr and Pn (and subsequently affect WUE). Drought stress resulted in an increased EL for all genotypes (Additional
file 9: Figure S8). The genotypes TEM-SEC, T4614, BN-11357-63, BN-13645-64, and T-2086 all had relatively lower DSIs (<173.7 %) for the EL values in comparison to the other genotypes. Overall, all 49 genotypes showed increased WUE and EL under drought treatment.
The 49 switchgrass genotypes can be clustered into three groups based on DSI values for seven physiological measurements at 30 days of drought treatment
Heatmap hierarchical clustering and PCA indicated that physiological parameters are important for dis-tinguishing the control and drought treatments in
switchgrass. To cluster the switchgrass genotypes that had similar physiological responses to drought, we performed PCA using the DSI of seven physiological measurements collected at 30 days of drought treat-ment. The results of this PCA analysis identified three major groups (group I, II and III) (Fig. 4). In general, the lowland genotypes clustered mainly into groups I and II; however, upland genotypes such as BN-10860-61, T-2100, T-2101, Caddo, and BN-18758-67 also clus-tered in groups I and II. This suggests that these upland genotypes have similar tolerance to drought as their lowland counterparts.
PCA using the DSI values of seven physiological measurements collected at 30 days also suggests that the first principal component (PC1) explained approxi-mately 57.83 % of the variance in the data and that the second (PC2) and third components (PC3) explained an additional 17.48 and 12.22 % of the variance, respec-tively. Together, the three components (PC1, PC2, and PC3) could explain 87.53 % of the variance among the 49 genotypes (Additional file 10: Figure S9). Because of the importance of physiological parameters for dis-tinguishing the control and drought treatments in
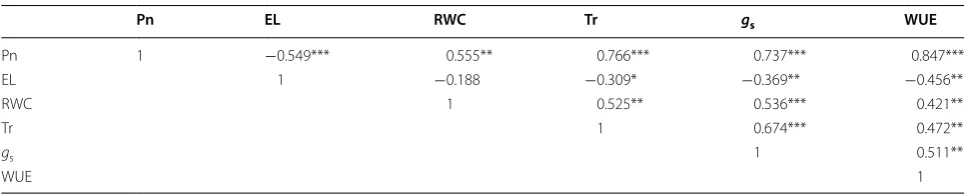
switchgrass, the relationships among the seven physi-ological parameters were further analyzed. We per-formed correlation analysis using Pearson’s method. Table 4 shows that under drought stress, the correla-tions of Pn with EL, RWC, Tr, gs, and WUE were
sig-nificant (p < 0.05) because they had large correlation coefficients (r) of −0.549, 0.555, 0.766, 0.737 and 0.847, respectively. These findings reveal that these physiolog-ical indicators, particularly Pn, are important parame-ters for assessing tolerance to abiotic stresses, including drought.
Drought tolerance ranking of the 49 switchgrass genotypes using integrated PCA values
Since the PCA that was based on the DSI of seven physi-ological parameters (Fig. 4; Additional file 10: Figure S9) showed that three major components (PC1, PC2, and PC3) could explain 87.53 % of the variance in response to drought treatment (Additional file 10: Figure S9), we developed the following formulas based on the results of PCA: (1) PC1 = 0.926 × RWC + 0.957 × Pn + 0.938 × Tr + 0.907 × gs + (−0.372) × Ci + (−0.109) × WUE + (
−0.649) × EL; (2) PC2 = 0.0034 × RWC + 0.134 × Pn
+ (−0.205) × Tr + 0.191 × gs + 0.5144 × Ci + 0.888 ×
WUE + (−0.2719) × EL; and (3) PC3 = 0.06428 × RWC
+ 0.0089 × Pn + 0.1597 × Tr + 0.224 × gs + 0.752 × Ci
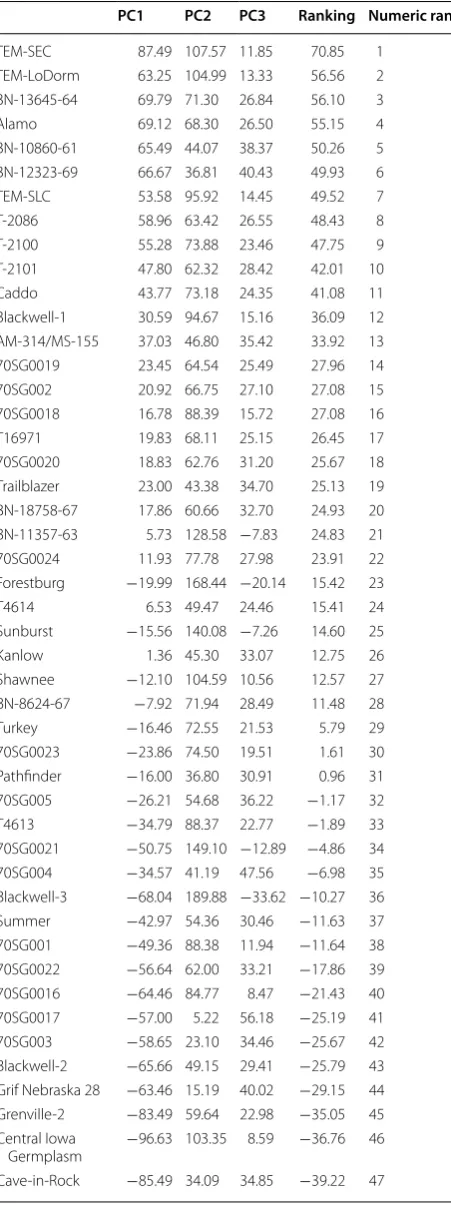
+ (−0.363) × WUE + 0.2787 × EL. In addition, a rank-ing value for each switchgrass genotype was calculated using a separate formula [(Ranking value = (57.83 % × PC1) + (17.48 % × PC2) + (12.22 % × PC3)] [44]. The 49 switchgrass genotypes were then ranked for relative drought tolerance. Genotypes TEM-SEC, TEM-LoDorm, BN-13645-64, Alamo, BN-10860-61, BN-12323-69, TEM-SLC, T-2086, T-2100, T-2101, Caddo, and Black-well-1 had relatively higher ranking values, suggesting that they were more drought tolerant (Table 5). In con-trast, genotypes including Grif Nebraska 28, Grenville-2, Central Iowa Germplasm, Cave-in-Rock, Dacotah, and Nebraska 28 had relatively lower ranking values and thus, were found to be more sensitive to drought stress.
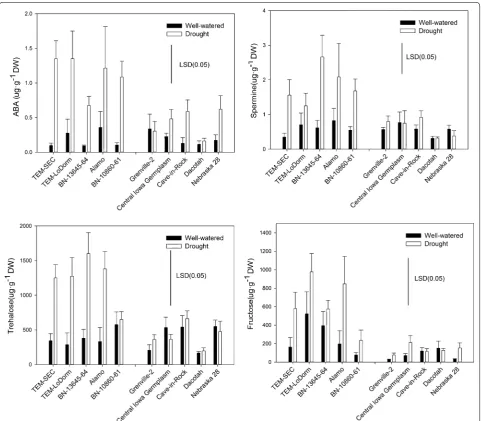
Different metabolic responses of the five best drought‑tolerant genotypes and the five most drought‑sensitive genotypes
To examine if metabolic responses varied under drought stress, we selected the five most drought-tolerant geno-types (top 10 % genogeno-types) and the five most drought-sensitive genotypes (bottom 10 % genotypes) for metabolite profiling (Table 5). The levels of 14 metabo-lites, including ABA, JA, JA-Ile, betaine, proline, putres-cine, spermine, spermidine, fructose, glucose, inositol, sucrose, trehalose, and raffinose were analyzed. Among the 14 metabolites, differences in ABA, spermine,
trehalose, and fructose were found between the five best tolerant genotypes and the five most drought-sensitive genotypes (Fig. 5). In general, the five best drought-tolerant genotypes tended to accumulate higher levels of ABA, spermine, trehalose, and fructose under drought stress than the five most drought-sensitive geno-types (Fig. 5).
Discussion
Evaluation of switchgrass germplasm with different physiological and metabolic parameters
In this study, we screened 49 diverse switchgrass geno-types for their tolerance to drought stress by measuring physiological, morphological, and metabolic traits. Our results indicate that the physiological parameters con-tributed more than the morphological traits in separat-ing the control and drought-treated groups. This suggests that physiological characteristics may be closely associ-ated with short-term drought tolerance in switchgrass. Previously, the evaluation of plant drought tolerance has been complicated due to inconsistencies in testing envi-ronments, the interactions between different develop-mental stages of plant growth, and the handling of a large number of plant genotypes [45]. Thus, no comprehen-sive, standardized system for measuring drought resist-ance has been established [46]. Indices that are based on yield loss under drought conditions, in comparison with normal conditions, have been used in crop breeding programs; however, these indices are labor intensive and time consuming [47, 48]. In this study, we measured a set of physiological parameters under drought treatment to effectively classify a relatively large collection of switch-grass germplasm. This process is non-destructive and sensitive to in planta conditions, which makes it favora-ble for collecting more reliafavora-ble drought-related data.
Drought stress significantly altered the physiological parameters (Pn, gs, Tr, Ci, and WUE) of all 49
switch-grass genotypes (Additional file 3: Figure S2; Additional file 4: Figure S3; Additional file 5: Figure S4; Additional file 6: Figure S5; Additional file 7: Figure S6; Additional file 8: Figure S7; Additional file 9: Figure S8). During Table 4 The correlation coefficient (r) between physiological measurements in 49 switchgrass genotypes under drought stress
*, **, and *** indicate significance at the 0.05, 0.01, and 0.001 levels, respectively (n = 49)
Pn EL RWC Tr gs WUE
Pn 1 −0.549*** 0.555** 0.766*** 0.737*** 0.847***
EL 1 −0.188 −0.309* −0.369** −0.456**
RWC 1 0.525** 0.536*** 0.421**
Tr 1 0.674*** 0.472**
gs 1 0.511**
drought conditions, the Pn may be inhibited due to sto-matal closure. This could inhibit RuBisco activity and increase respiration rates, ultimately leading to depleted carbohydrate reserves, reduced growth rates, and early plant senescence. In response to water deficit, the sto-mata may also close to conserve water; however, stoma-tal closure (lower gs) may block gas exchange and result
in an increase in the O2/CO2 ratio. With an increase in
excess O2 molecules, energy may be directed to them and
the production of toxic reactive oxygen species (ROS) becomes a concern [49, 50]. In turn, these ROS may destroy important cellular components such as proteins, lipids, and nucleic acids, resulting in cell membrane dam-age (increased EL). Excess ROS may also damdam-age compo-nents of the photosynthesis system, reducing the Pn and leaf RWC (Additional file 7: Figure S6) and increasing EL (Additional file 9: Figure S8) [51]. In order to cope with abiotic stresses, such as drought, plants have evolved the ability to evoke antioxidant defense systems, osmotic adjustments, and hormonal regulations of stomatal func-tions [17, 18].
The DSIs for each physiological parameter (Additional file 3: Figure S2; Additional file 4: Figure S3; Additional file 5: Figure S4; Additional file 6: Figure S5; Additional file 7: Figure S6; Additional file 8: Figure S7; Addi-tional file 9: Figure S8) were used to evaluate the rela-tive drought tolerance of all 49 switchgrass genotypes. Our results showed that the drought-tolerant genotypes had higher RWC, gs, Pn, Tr, and Ci, and a lower EL than
the drought-sensitive genotypes. In addition, the five best drought-tolerant genotypes tended to accumulate higher levels of ABA, spermine, fructose, and trehalose under drought stress than the five most drought-sensi-tive genotypes (Fig. 5). It has been well documented that ABA induces stomatal closure and reduces water loss through transpiration [23]. Our results show that the drought-tolerant genotypes had higher levels of ABA, gs, and Tr, suggesting that these genotypes may achieve
a higher tolerance to drought stress by maintaining bet-ter gas exchange (high gs and Tr). This high level of gas
exchange would reduce ROS toxicity, providing stronger signal-mediated regulations (Fig. 5, higher ABA, sper-mine, and trehalose) and osmotic adjustments (higher levels of trehalose and fructose). Fructose and trehalose are important osmoprotectants that facilitate osmotic adjustment. A previous study in Arabidopsis also showed Table 5 The three major components (PC1, PC2 and PC3)
and PCA ranking values of the physiological parameters of 49 switchgrass lines after 30 days of drought stress
PC1 PC2 PC3 Ranking Numeric rank
TEM-SEC 87.49 107.57 11.85 70.85 1 TEM-LoDorm 63.25 104.99 13.33 56.56 2 BN-13645-64 69.79 71.30 26.84 56.10 3 Alamo 69.12 68.30 26.50 55.15 4 BN-10860-61 65.49 44.07 38.37 50.26 5 BN-12323-69 66.67 36.81 40.43 49.93 6 TEM-SLC 53.58 95.92 14.45 49.52 7 T-2086 58.96 63.42 26.55 48.43 8 T-2100 55.28 73.88 23.46 47.75 9 T-2101 47.80 62.32 28.42 42.01 10 Caddo 43.77 73.18 24.35 41.08 11 Blackwell-1 30.59 94.67 15.16 36.09 12 AM-314/MS-155 37.03 46.80 35.42 33.92 13 70SG0019 23.45 64.54 25.49 27.96 14 70SG002 20.92 66.75 27.10 27.08 15 70SG0018 16.78 88.39 15.72 27.08 16 T16971 19.83 68.11 25.15 26.45 17 70SG0020 18.83 62.76 31.20 25.67 18 Trailblazer 23.00 43.38 34.70 25.13 19 BN-18758-67 17.86 60.66 32.70 24.93 20 BN-11357-63 5.73 128.58 −7.83 24.83 21 70SG0024 11.93 77.78 27.98 23.91 22 Forestburg −19.99 168.44 −20.14 15.42 23 T4614 6.53 49.47 24.46 15.41 24 Sunburst −15.56 140.08 −7.26 14.60 25 Kanlow 1.36 45.30 33.07 12.75 26 Shawnee −12.10 104.59 10.56 12.57 27 BN-8624-67 −7.92 71.94 28.49 11.48 28 Turkey −16.46 72.55 21.53 5.79 29 70SG0023 −23.86 74.50 19.51 1.61 30 Pathfinder −16.00 36.80 30.91 0.96 31 70SG005 −26.21 54.68 36.22 −1.17 32 T4613 −34.79 88.37 22.77 −1.89 33 70SG0021 −50.75 149.10 −12.89 −4.86 34 70SG004 −34.57 41.19 47.56 −6.98 35 Blackwell-3 −68.04 189.88 −33.62 −10.27 36 Summer −42.97 54.36 30.46 −11.63 37 70SG001 −49.36 88.38 11.94 −11.64 38 70SG0022 −56.64 62.00 33.21 −17.86 39 70SG0016 −64.46 84.77 8.47 −21.43 40 70SG0017 −57.00 5.22 56.18 −25.19 41 70SG003 −58.65 23.10 34.46 −25.67 42 Blackwell-2 −65.66 49.15 29.41 −25.79 43 Grif Nebraska 28 −63.46 15.19 40.02 −29.15 44 Grenville-2 −83.49 59.64 22.98 −35.05 45 Central Iowa
Germplasm −96.63 103.35 8.59 −36.76 46 Cave-in-Rock −85.49 34.09 34.85 −39.22 47
Table 5 continued
PC1 PC2 PC3 Ranking Numeric rank Dacotah −101.37 86.86 16.36 −41.44 48
that spermine is closely correlated with drought tolerance [52]. No consistent differences in any of the other metab-olites between drought-tolerant and drought-sensitive genotypes were found in our study. In addition to regu-lating gas exchange, plants possess various antioxidant metabolites and enzymes to remove ROS. Stomatal func-tions and photosynthesis efficiency rates under drought conditions may not only be regulated by hormones, such as ABA. The integrity of these processes could also be maintained by other metabolites that might facilitate such harsh osmotic adjustments, ultimately improving drought tolerance in plants [23, 53].
Drought-tolerant genotypes have also been shown to have a higher photosynthetic function (higher Pn) rela-tive to drought-sensirela-tive genotypes. Similar results were also found in switchgrass [4], maize [54], and creep-ing bentgrass [55] under drought treatment. Mohamed [11] found that water stress affected several switchgrass cultivars (Carthage, Alamo, Kanlow, Southlow, Cave-in-Rock, Forestburg, Blackwell, Nebraska 28, Shelter, Shawnee, Dacotah, Sunburst, and WI) physiologically by decreasing photosynthesis. Jiang et al. [4] evaluated the upland switchgrass cultivar Cave-in-Rock and noted that drought stress reduced tissue water content, leaf dry
weight, and chlorophyll fluorescence but increased total carotenoid concentration and EL.
Methods for analysis of large physiological datasets It is still challenging to reliably analyze and interpret large physiological datasets collected from plants grown under drought and well-watered conditions. Various methods and statistical models have been proposed for such analy-ses. Correlation analysis, PCA, and clustering are consid-ered to be good methods for evaluating the relationships between the parameters and their principal components in phenotypic screening for drought tolerance [21, 47, 48]. In this study, PCA and correlation analysis showed that the differences in drought tolerance among the 49 switchgrass genotypes were largely due to variations in physiological parameters, especially Pn (Table 4; Fig. 4). Our results also found that some lowland genotypes, such as TEM-SEC, TEM-LoDorm, BN-13645-64, Alamo, and TEM-SLC, have relatively good tolerance to drought. These genotypes maintain higher Pn, Tr, gs, Ci, and RWC
and lower EL in comparison to the upland genotypes (Additional file 3: Figure S2; Additional file 4: Figure S3; Additional file 5: Figure S4; Additional file 6: Figure S5; Additional file 7: Figure S6; Additional file 9: Figure S8; Table 5). Although the upland genotypes had a compara-tively greater WUE than the lowland genotypes, our data showed that WUE was highly variable (Additional file 8: Figure S7). In fact, WUE alone may not be enough of a factor for evaluating drought tolerance [56].
A heatmap is a visual method that can be used to explore complex associations between multiple param-eters collected from various treatments. It is often use-ful to combine heatmap with hierarchical clustering, which is a way of arranging items in a hierarchy based on the distance or similarity between them. Despite its benefits, heatmap analysis (Fig. 2) could not clearly iden-tify the significant differences between the genotypes in this study. PCA biplots (Figs. 3, 4), however, could show the relative contributions of the parameters to the clus-tered groups. In our study, the PCA based on the DSI of seven physiological parameters yielded three PCs that accounted for 87.53 % of the total variance (Fig. 4; Additional file 10: Figure S9). For the purpose of evalu-ating switchgrass tolerance to drought stress, the three PCs were sufficient to represent the seven physiologi-cal parameters. To comprehensively evaluate the rela-tive drought tolerance of the 49 switchgrass genotypes, a ranking value was calculated for each of the genotypes analyzed in this study (Table 5). Based on their ranking values, genotypes TEM-SEC, TEM-LoDorm, BN-13645-64, Alamo, BN-10860-61, BN-12323-69, TEM-SLC, T-2086, T-2100, T-2101, Caddo, and Blackwell-1 were more tolerant to drought stress. In contrast, genotypes
Grif Nebraska 28, Grenville-2, Central Iowa Germplasm, Cave-in-Rock, Dacotah, and Nebraska 28 were relatively sensitive to drought stress.
Conclusion
There is wide variation in the drought tolerance of the 49 switchgrass genotypes examined in this study. Based on DSI values for each physiological parameter, clus-ter analysis, and PCA ranking, we found that geno-types TEM-SEC, TEM-LoDorm, BN-13645-64, Alamo, BN-10860-61, BN-12323-69, TEM-SLC, T-2086, T-2100, T-2101, Caddo, and Blackwell-1 were more drought tol-erant. We also found that genotypes Grif Nebraska 28, Grenville-2, Central Iowa Germplasm, Cave-in-Rock, Dacotah, and Nebraska 28 were relatively sensitive to drought stress. The physiological measurements and metabolic profiles generated in this study offered a sen-sitive, reliable approach for identifying switchgrass gen-otypes that are tolerant or sensitive to drought stress. The results of this study provide a foundation for fur-ther investigating the molecular mechanisms underlying switchgrass tolerance to drought stress.
Methods
Plant materials and culture
This study was performed in a greenhouse at Virginia Tech (Blacksburg, VA, USA). Diverse switchgrass germ-plasm accessions were originally obtained from the United States Department of Agriculture Germplasm Center and were maintained in the Virginia Tech Kent-land Farm Agricultural Station (Blacksburg, VA, USA). One genotype from each of the 49 switchgrass acces-sions was chosen for this study (Table 1). Each switch-grass genotype was propagated by splitting tillers. On May 12, 2012, a tiller from each genotype was planted in a large pot (40 cm diam., 45 cm deep) filled with 12 kg of a mixture of sandy loam top soil and sand (2:1, v/v, 0.1–1.0 mm diam.). After 2 months of culture, six tillers from each genotype were transplanted into six plastic pots (17 cm diam., 20 cm high, with four holes at the bot-tom for drainage) and filled with 3.5 kg of a soil and sand mixture (soil:sand = 2:1 v/v, sand: 0.1–1.0 mm diam.). Of the 49 genotypes (Table 1), ten (AM-314/MS-155, BN-13645-64, BN-11357-63, Alamo, SEC, TEM-SLC, TEM-LoDorm, T-2086, BN-12323-69, and Kanlow) were lowland ecotypes [8, 57], and the rest were upland ecotypes.
The plants were grown in the greenhouse at tempera-tures of 30 ± 1 °C/25 ± 1 °C (day/night), a 14-h photoper-iod, 75 % relative humidity, and with photosynthetically active radiation of approximately 500 μmol m−2s−1
(Bulldog brand, 28-8-18, 1 % ammonia N, 4.8 % nitrate N, and 22.2 % urea N; SQM North America, Atlanta, GA, USA) and micronutrients was applied at 0.49 kg m−2
every week.
Drought stress treatment
After the plants were grown for 2 months (Sep 10, 2012) and had reached the E5 developmental stage [58], they were exposed to one of two soil moisture treatments (well-watered or drought stress) for 30 days.
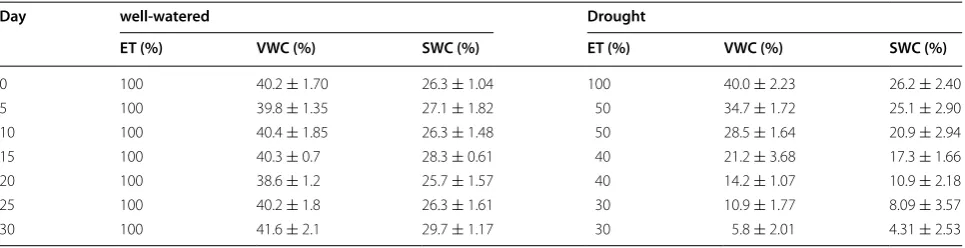
The plants from each genotype were randomly assigned to either the control group (n = 6), which was kept well watered to maintain the soil moisture content at container capacity, or to the drought treatment group (n = 6), in which the soil moisture was allowed to gradu-ally decline from day 0 to day 30 by reducing the amount of water used for irrigation. Water was added daily to compensate for 30–50 % ET loss during the experiment over the 30-day period. ET was determined by weigh-ing the pots [59]. In addition, the volumetric soil mois-ture content (VWC) was monitored using a soil moismois-ture meter (model HH2, Delta-T Devices, Cambridge, England).
In a separate experiment, the soil water content (SWC) of the growth media was determined based on differences in soil sample weight before and after drying at 105 °C to a constant weight. This difference was expressed as the percentage of the weight lost relative to the oven-dried weight. Soil samples were taken at different time points and each data point is the average of the measurements.
On average, the volumetric water content (VWC) was reduced from 40.00 to 21.24 % and the SWC was reduced from 26.21 to 17.34 % between days 0 and 15. Between days 15 and 25, the VWC was reduced from 21.24 to 10.94 % and the SWC was reduced from 17.34 to 8.09 %. Finally, the VWC was reduced from 10.94 to 5.79 % and the SWC was reduced from 8.09 to 4.31 % between days
25 and 30. The well-watered pots were irrigated daily to maintain approximately 40.0 % volumetric soil moisture (Table 6). The amount of water given each day was deter-mined according to ET [59].
Physiological measurements
To measure electrolyte leakage (EL) and relative water content (RWC), leaf samples were collected after 0, 5, 10, 15, 20, 25, and 30 days of drought stress. At the same time points, the photosynthetic rate (Pn), stomatal con-ductance (gs), intercellular CO2 concentration (Ci), and
transpiration rate (Tr) were determined. At the end of the experiment (30 days), leaf tissue samples for metabolite and genetic diversity analyses were collected and frozen in liquid N2.
Leaf electrolyte leakage (EL) was measured according to the method of Marcum [60] with some modifications. The top 2nd or 3rd mature leaf blades were excised and cut into 2-cm segments. After rinsing 3 times with deion-ized H2O, 0.2 g of the leaf tissue was placed in a 50-mL
test tube containing 20 mL deionized H2O. The test tubes
were agitated on a shaker for approximately 24 h, and the solution conductivity (C1) was measured with a
conduc-tivity meter (SR60IC, VWR, Radnor, PA, USA). The leaf samples were then autoclaved at 120 °C for 30 min, and when the tubes cooled to room temperature, the con-ductivity of the solution containing the killed tissue was measured (C2). The relative EL was calculated using the
formula: EL (%) = (C1/C2) × 100.
Leaf relative water content (RWC) was determined according to the method of Barrs and Weatherley and was based on the following formula: RWC = (FW − DW)/ (TW − DW) × 100, where FW is leaf fresh weight, DW (dry weight) is the weight of the leaves after drying at 85 °C for 3 days, and TW (turgid weight) is the weight of the leaves after soaking them in distilled water for 24 h at 20 °C.
Table 6 The change in soil volumetric water content and soil water content over time in well-watered and drought condi-tions
VWC: volumetric water content; SWC: soil water content n = 294 for VWC and n = 16 for SWC
Day well‑watered Drought
ET (%) VWC (%) SWC (%) ET (%) VWC (%) SWC (%)
The photosynthetic rate (Pn), stomatal conductance (gs), intercellular CO2 concentration (Ci) and
transpira-tion rate (Tr) were measured using a portable photosyn-thesis system (Li-6400XT, LI-COR, Inc., Lincoln, NE, USA) under a controlled atmosphere (385 μmol mol−1
CO2, 500 μmol s−1 flow rate, 26 °C) and a LI-COR 6400
LED external light source that provided a photosynthetic photon flux density (PPFD) of 2000 μmol m−2 s−1. The
uppermost fully expanded leaf on the main tiller in each pot was selected for these measurements. Three readings were collected for each sample, and the average was used for statistical analysis.
Metabolite extraction and derivatization
We analyzed a total of 14 drought stress tolerance-related metabolites [53, 61, 62], including ABA, JA, JA-Ile, betaine, proline, putrescine, spermine, spermidine, fruc-tose, glucose, inositol, sucrose, trehalose, and raffinose.
Plant tissues were frozen in liquid nitrogen, lyophi-lized overnight and transferred to 2-mL screw-cap tubes (http://www.sarstedt.com) containing three 3.2-mm stainless steel beads (http://www.biospec.com). The tissue was ground, and aliquots of approximately 50 mg were automatically transferred to new tubes using the iWall instrument at the GLBRC Cell Wall facility at Michigan State University (https://www.glbrc.org/ research/enabling-technologies). Chemical extraction was performed using a 10 % methanol and 1 % acetic acid solvent containing internal standards of 10 μM
dh-JA, 10 μM ribitol, 10 μM [2H3]proline, and 1 μM
[2H
6]ABA. For extraction, 400 μL of extraction solvent
was added to approximately 50 mg of ground plant tis-sue, and the mixture was incubated at 70 °C for 30 min. The extract was centrifuged for 15 min at 13,000 rpm, and 200 μL of supernatant was transferred to a new
1.5-mL microcentrifuge tube. For each plant, 60 μL
of extract was transferred to each of two 96-well PCR tubes for the analysis of two groups of metabolites: (1) ABA, JA, and JA-Ile, and (2) polyamines and proline. For sugar analysis using GC–MS, 10 μL of the extract
was transferred to a new 1.5-ml microcentrifuge tube for derivatization. For derivatization, 10 μL of extract
was evaporated to complete dryness overnight using a SpeedVac. Ten microliters of 40 mg mL−1 O
-methyl-hydroxylamine hydrochloride in pyridine was added to the dried plant extract and the tubes incubated for 90 min at 30 °C with gentle rocking. Forty-five micro-liters of N-methyl-N-trimethylsilyltrifluoroacetamide (MSTFA) with 1 % trimethylchlorosilane (TMCS) was then added to the mixture, and the tubes incubated at 37 °C for an additional 30 min. For sugar analysis, 50
μL of the derivatized product was transferred to a glass
vial containing a glass insert (http://www.restek.com). All materials were barcoded to keep track of each sam-ple throughout the entire extraction and derivatization procedure.
Metabolite determination using GC–MS
To analyze the plants’ sugar profiles, GC–MS was per-formed using a 6890N network GC system with a 5973 mass selective detector (Agilent Technologies, http:// www.agilent.com, Santa Clara, CA, USA). Separation was achieved by injection of 1 μL of derivatized extract into
a 30-m VF-5 MS column (30 m × 0.25 mm × 0.25 μM;
Agilent), with a 10-m EZ-Guard (Agilent), using the fol-lowing temperature profile: 80 °C for 1 min; 40 °C min−1
to 220 °C for 3 min; 40 °C min−1 to 320 °C for 6 min; and
270 °C for 1 min. Sugar metabolites were detected using selected ion monitoring (SIM) mode with m/z values of 205.2, 217.0, 217.2, 305.0, 307.2, 319.2, 319.3, and 361.3 throughout the GC–MS run.
Metabolite analysis using LC–MS/MS
For the analysis of ABA, JA, and JA-Ile, methods from Chung et al. [63] were used with modifications. Briefly, extracts (10 μL) were injected into an Ascentis Express
C18 column (2.7 μM, 2.1 × 50 mm, Supelco
Analyti-cal) and attached to an Acquity Ultraperformance Liq-uid Chromatography System (Waters, http://www. waters.com, Milford, MA, USA) for LC reverse-phase analysis. The column temperature was maintained at 50 °C. A steep gradient was executed between solvents A and B (A—0.15 % formic acid in MilliQ water, B— methanol) with an analysis time of 3 min/sample and a 0.4 mL min−1 flow rate. The gradient profile was
as follows: 30 % B for the initial step; a linear gradi-ent to 70 % B in 1.5 min; 100 % B in 2 min; 100 % B maintained for 2.5 min; and 30 % B from 2.5 min to 3 min. Mass spectra were acquired using electrospray ionization in negative ion mode and multiple reaction monitoring (MRM). A Quattro Premier XE tandem quadrupole mass spectrometer (Waters) was coupled to the LC to identify and detect analytic signals under the following conditions: 3.00 kV capillary voltage; 100 °C source temperature; 300 °C desolvation temper-ature; 20 L h−1 nebulizer nitrogen flow rate; and 300 L
h−1 desolvation nitrogen gas flow rate. The transitions
from precursor molecules to characteristic product ions were monitored for JA (m/z 209 > 59), dh-JA (m/z 211 > 59), JA-Ile (m/z 322 > 130), ABA (m/z 263 > 153), and [2H
6] ABA (m/z 269 > 159). The collision
JA-Leu, the values reported for JA-Ile represent the sum of JA-Ile and JA-Leu. In Arabidopsis seedlings, the amount of JA-Leu is reported to be <25 % that of JA-Ile [64].
For the analysis of putrescine and spermine, methods from Gu et al. [65] were used with modifications. Briefly, the extracts (10 μL) were injected into a Symmetry C18
column (2.1 × 100 mm, 3.5 μM particle size, Waters) and
attached to a Shimadzu (Columbia, MD, USA) LC-20AD HPLC system for LC reverse-phase analysis. The column temperature was maintained at 30 °C. A steep gradient was executed between solvents A and B (A—1 mM per-fluoroheptanoic acid in MilliQ water, B—acetonitrile) with an analysis time of 6 min/sample and a 0.3 mL min−1
flow rate. The gradient profile was as follows: 2 % B for the initial step; a linear gradient to 20 % B in 0.1 min; 80 % B in 2.5 min; 80 % B maintained for 4 min; 20 % B in 4.1 min; and 2 % B in 6 min. Mass spectra were acquired using electrospray ionization in positive ion mode and MRM. A Quattro micro mass spectrometer (Waters) was coupled to the LC to identify and detect analytic signals under the following conditions: electrospray negative ionization mode; 3.17 kV capillary voltage; 110 °C source temperature; 350 °C desolvation temperature; 20 L h−1
nebulizer nitrogen flow rate; and 400 L h−1 desolvation
nitrogen gas flow rate. The transitions from precursor molecules to characteristic product ions were monitored for putrescine (m/z 89 > 72), proline (m/z 116 > 70), betaine (m/z 118 > 59), [2H
3]proline (m/z 119 > 73),
sper-midine (m/z 146 > 72), and spermine (203 > 112). The collision energies and source cone potentials were opti-mized for each transition using Waters QuanOptimize software.
Drought tolerance evaluation
To assess the drought tolerance of different populations, the drought stress index (DSI) was used in this study. DSI was calculated using the formula: DSI = (value of trait under stress condition)/(value of trait under controlled condition) × 100 [15].
To assess the drought tolerance of different genotypes, the PCA ranking value was used in this study. The PCA ranking value for each switchgrass genotype was calcu-lated using the formula:
Ranking value = (contribution of PC1
(%) × PC1) + (contribution of PC2 (%) × PC2) + (con-tribution of PC3 (%) × PC3) [44].
DNA extraction and genetic diversity analysis
DNA was extracted from approximately 200 mg of leaf tissue from each of the 49 genotypes using the CTAB
method [66]. The quality of the DNA was assessed by electrophoresis on 0.8 % agarose gels, and the quantity of the DNA was measured by comparing the samples to standardized lambda DNA size markers.
For SRAP-PCR amplification, 12 pairs of previously reported SRAP primers were selected for this study (Table 2) [67]. SRAP analysis was performed as described previously [40]. Briefly, each 20 μL PCR reaction
mix-ture consisted of 40 ng genomic DNA, 0.2 mM dNTPs, 2.5 mM MgCl2, 0.5 μM primers, 1× PCR buffer, and 1
unit of Taq polymerase. The amplification was performed in four steps: pre-denaturation at 94 °C for 4 min; 5 cycles of 1 min denaturation at 94 °C, 1 min annealing at 35 °C and 1.5 min extension at 72 °C; 35 cycles of 1 min at 94 °C, 1 min at 50 °C, and 1.5 min at 72 °C; and a final extension step at 72 °C for 7 min. The PCR fragments were separated on a 5 % agarose gel, stained with 0.01 % ethidium bromide, and visualized using a Gel-Document Image System™ under UV light (Bio-Rad, Hercules, CA, USA).
Experimental design and statistical analysis
A split plot design was used in this experiment, with the soil moisture regimes as the main plots and the switch-grass genotypes as the subplots. Each genotype had six replicates for each soil moisture treatment (well-watered and drought). All data were subjected to analysis of vari-ance (ANOVA, SAS 8.1, SAS Institute Inc., Cary, NC, USA). The treatment means were separated using Fisher’s protected least significant difference (LSD) test at a 5 % probability level.
R statistical software (PCA analysis, R2.15.1 by R Development Core Team) was used to determine the correlations between physiological and morphological traits and to perform principal component analysis of the traits.
Abbreviations
ET: evapotranspiration; RWC: relative water content; EL: electrolyte leakage; Pn: photosynthetic rate; Gs: stomatal conductance; Tr: transpiration; SRAP: Additional files
Additional file 1: Figure S1. Principal component analysis biplot of morphological and physiological traits of 49 switchgrass genotypes under well-watered and drought stress conditions after 15 days of treatment. The seven physiological parameters (Pn, Ci, gs, Tr, RWC, WUE and EL) allow
to separate 49 switchgrass genotypes that were either grown under well-watered (circled) or drought treatment (box) conditions. Arrows represent physiological traits with various length based on the impact of each trait on the separation of genotypes. RWC: relative water content; EL: electrolyte leakage; Pn: photosynthetic rate; gs: stomatal conductance;
Tr: transpiration rate; Ci: intercellular CO2 concentration; WUE: water use
efficiency. LL: leaf length; LW: leaf width; SL: leaf sheath length. Group A: well-watered; Group B: drought treatment.
Additional file 2. Effect of drought stress on morphological parameters at 30 d of experiment (n= 6), and effect of drought stress on morpho-logical parameters of lowland and upland lines at 30 d of experiment, (n= 294). LL: leaf length; LW: leaf width; SL: leaf sheath length; SE: standard error.
Additional file 3: Figure S2. The photosynthetic rate (Pn) of 49 geno-types under well-watered conditions (control, solid bar) or drought stress (open bar) after 30 days of treatment. The genotype represents the DSI. The greater the DSI, the better the drought tolerance. The values are the means (n= 6).The bar represents LSD (0.05) for DSI.
Additional file 4: Figure S3. The stomatal conductance (gs) of 49
geno-types under well-watered conditions (control, solid bar) or drought stress (open bar) after 30 days of treatment. The genotype represents the DSI. The greater the DSI, the better the drought tolerance. The values are the means (n= 6). The bar represents LSD (0.05) for DSI.
Additional file 5: Figure S4. The transpiration rate (Tr) of 49 genotypes under well-watered conditions (control, solid bar) or drought stress (open bar) after 30 days of treatment. The genotype represents the DSI. The greater the DSI, the better the drought tolerance. The values are the means (n= 6). The bar represents LSD (0.05) for DSI.
Additional file 6: Figure S5 The intercellular CO2 concentration (Ci) of 49
genotypes under well-watered conditions (control, solid bar) or drought stress (open bar) after 30 days of treatment. The genotype represents the DSI. The greater the DSI, the better the drought tolerance. The values are the means (n= 6). The bar represents LSD (0.05) for DSI.
Additional file 7: Figure S6. The relative water content (RWC) of leaves from 49 genotypes under well-watered conditions (control, solid bar) or drought stress (open bar) after 30 days of treatment. The genotype represents the DSI. The greater the DSI, the better the drought tolerance. The values are the means of four replicates (n= 6). The bar represents LSD (0.05) for DSI.
Additional file 8: Figure S7. The water use efficiency (WUE) of 49 genotypes under well-watered conditions (control, solid bar) or drought stress (open bar) after 30 days of treatment. The genotype represents the DSI. The greater the DSI, the better the drought tolerance. The values are the means (n= 6). The bar represents LSD (0.05) for DSI.
Additional file 9: Figure S8. The leaf electrolyte leakage (EL) of 49 genotypes under well-watered conditions (control, solid bar) or drought stress (open bar) after 30 days of treatment. The genotype represents the DSI. The lower the DSI, the better the drought tolerance. The values are the means (n= 6). The bar represents LSD (0.05) for DSI.
Additional file 10: Figure S9. Proportion of variance for principal component analysis based on the DSI of seven physiological traits of 49 switchgrass genotypes under well-watered (control) and drought stress conditions after 30 days of treatment.
sequence-related amplified polymorphism; Ci: intercellular CO2 concentration;
WUE: water use efficiency; PCA: principal component analysis; ABA: abscisic acid; JA: jasmonic acid; JA-Ile: jasmonic acid–isoleucine; GB: glycine betaine; PAs: polyamines; LL: leaf length; LW: leaf width; SL: leaf sheath length.
Authors’ contributions
XZ, KC, BZ conceived the study as well as participated in its design and coordination. YL and XZ carried out all drought treatment experiments. HT and LS performed the statistical analysis. JK and KC performed the metabolites analysis. YL, XZ, KC, and BZ analyzed the data and wrote the manuscript. All authors suggested revisions to the drafts manuscript, read, and approved the final manuscript.
Author details
1 Department of Crop and Soil Environmental Science, Virginia Tech, 367
Smyth Hall, 185 Ag Quad Ln, Blacksburg, VA 24061, USA. 2 Department of
Sta-tistics, Virginia Tech, Blacksburg, VA, USA. 3 Department of Plant Biology,
Michi-gan State University, East Lansing, MI, USA. 4 Center for Genomics-Enabled
Plant Science, Michigan State University, East Lansing, MI, USA. 5 Department
of Horticulture, Virginia Tech, 407 Latham Hall, 220 Ag Quad Ln, Blacksburg, VA 24061, USA.
Acknowledgements
We thank Dr. John Seiler, Mr. John Peterson, Dr. Jacob Barney (Virginia Tech) for support with equipment, George Tolton, Alyssa Hamill, and Mattia Accorsi for the help in this study. The project was supported by a grant from the program of Plant Feedstock Genomics for Bioenergy of the US Department of Agriculture and the US Department of Energy (KC, RB, XZ, and BZ). The study was also partially supported by Virginia Tech’s Virginia Agricultural Experiment Station (VA135872 to BZ).
Compliance with ethical guidelines
Competing interests
The authors declare that they have no competing interests.
Received: 6 March 2015 Accepted: 10 September 2015
References
1. McLaughlin SB, Adams Kszos L. Development of switchgrass (Panicum vir-gatum) as a bioenergy feedstock in the United States. Biomass Bioenergy. 2005;28(6):515–35. doi:10.1016/j.biombioe.2004.05.006.
2. Wright L, Turhollow A. Switchgrass selection as a “model” bioenergy crop: a history of the process. Biomass Bioenergy. 2010;34(6):851–68. doi:10.1016/j.biombioe.2010.01.030.
3. Jones MB. Switchgrass—a valuable biomass crop for energy. Crop Sci. 2013;53(1):351. doi:10.2135/cropsci2012.12.0004br.
4. Jiang Y, Yao Y, Wang Y. Physiological response, cell wall components, and gene expression of switchgrass under short-term drought stress and recoveries. Crop Sci. 2012;52(6):2718–27. doi:10.2135/ cropsci2012.03.0198.
5. Morrow Iii WR, Gopal A, Fitts G, Lewis S, Dale L, Masanet E. Feedstock loss from drought is a major economic risk for biofuel producers. Biomass and Bioenergy. 2014;69:135–43. doi:10.1016/j.biombioe.2014.05.006. 6. Ashraf M. Inducing drought tolerance in plants: recent advances.
Biotech-nol Adv. 2010;28(1):169–83. doi:10.1016/j.biotechadv.2009.11.005. 7. Hopkins AA, Taliaferro CM, Murphy CD, Christian DA. Chromosome
number and nuclear DNA content of several switchgrass populations. Crop Sci. 1996;36(5):1192–5. doi:10.2135/cropsci1996.0011183X00360005 0021x.
8. Zhang Y, Zalapa J, Jakubowski AR, Price DL, Acharya A, Wei Y, et al. Natural hybrids and gene flow between upland and lowland switchgrass. Crop Sci. 2011;51(6):2626–41.
10. Barney JN, Mann JJ, Kyser GB, et al. Tolerance of switchgrass to extreme soil moisture stress: ecological implications. Plant Sci. 2009;177(6):724–32. 11. Fahej MAS. Screening switchgrass (Panicum virgatum L.) for water stress
tolerance and utilizing in vitro culture technique to induce variation. 2012.
12. Berdahl JD, Frank AB, Krupinsky JM, Carr PM, Hanson JD, Johnson HA. Bio-mass yield, phenology, and survival of diverse switchgrass cultivars and experimental strains in western north dakota USDA-ARS, northern plains area, is an equal opportunity/affirmative action employer, and all agency services are available without discrimination. Agron J. 2005;97(2):549–55. doi:10.2134/agronj2005.0549.
13. Porter CL. An analysis of variation between upland and lowland switch-grass, Panicum Virgatum L., in Central Oklahoma. Ecology. 1966;47(6):980– 92. doi:10.2307/1935646.
14. Stroup JA, Sanderson MA, Muir JP, McFarland MJ, Reed RL. Comparison of growth and performance in upland and lowland switchgrass types to water and nitrogen stress. Bioresour Technol. 2003;86(1):65–72. doi:10.1016/S0960-8524(02)00102-5.
15. Wójcik-Jagła M, Rapacz M, Tyrka M, Kościelniak J, Crissy K, Żmuda K. Comparative QTL analysis of early short-time drought tolerance in Polish fodder and malting spring barleys. TAG Theor Appl Genet. 2013;126(12):3021–34. doi:10.1007/s00122-013-2190-x.
16. Tazaki T, Ishihara K, Ushijima T. Influence of water stress on the pho-tosynthesis and productivity of plants in humid stress. Adaptation of plants for water and high temperature stress. New York: Wiley; 1980. p. 309–22.
17. Farooq M, Wahid A, Kobayashi N, Fujita D, Basra SMA. Plant drought stress: effects, mechanisms and management. Agron Sustain Dev. 2009;29(1):185–212. doi:10.1051/agro:2008021.
18. Mahajan S, Tuteja N. Cold, salinity and drought stresses: an overview. Arch Biochem Biophys. 2005;444(2):139–58. doi:10.1016/j.abb.2005.10.018. 19. Sivamani E, Bahieldin A, Wraith JM, Al-Niemi T, Dyer WE, Ho TD, et al.
Improved biomass productivity and water use efficiency under water deficit conditions in transgenic wheat constitutively expressing the barley HVA1 gene. Plant Sci Int J Exp Plant Biol. 2000;155(1):1–9. 20. Yige C, Fangqing C, Lei L, Shunbo Z. Physiological responses of Leucaena
leucocephala seedlings to drought stress. Procedia Eng. 2012;28:110–6. doi:10.1016/j.proeng.2012.01.691.
21. Sun J, Luo H, Fu J, Huang B. Classification of genetic variation for drought tolerance in Tall Fescue using physiological traits and molecular markers. Crop Sci. 2013;53(2):647–54. doi:10.2135/cropsci2012.05.0315. 22. Chaves MM, Flexas J, Pinheiro C. Photosynthesis under drought and
salt stress: regulation mechanisms from whole plant to cell. Ann Bot. 2009;103(4):551–60. doi:10.1093/aob/mcn125.
23. Zhang J, Jia W, Yang J, Ismail AM. Role of ABA in integrating plant responses to drought and salt stresses. Field Crops Res. 2006;97(1):111–9. doi:10.1016/j.fcr.2005.08.018.
24. de Ollas C, Hernando B, Arbona V, Gomez-Cadenas A. Jasmonic acid transient accumulation is needed for abscisic acid increase in citrus roots under drought stress conditions. Physiol Plant. 2013;147(3):296–306. doi:10.1111/j.1399-3054.2012.01659.x.
25. Alam MM, Nahar K, Hasanuzzaman M, Fujita M. Exogenous jasmonic acid modulates the physiology, antioxidant defense and glyoxalase systems in imparting drought stress tolerance in different Brassica species. Plant Biotechnol Rep. 2014;8(3):279.
26. Medeiros DB, Silva ECD, Santos HRB, Pacheco CM, Musser RDS, Nogueira RJMC. Physiological and biochemical responses to drought stress in Barbados cherry. Braz J Plant Physiol. 2012;24:181–92.
27. Parida A, Dagaonkar V, Phalak M, Aurangabadkar L. Differential responses of the enzymes involved in proline biosynthesis and degradation in drought tolerant and sensitive cotton genotypes during drought stress and recovery. Acta Physiol Plant. 2008;30(5):619–27. doi:10.1007/ s11738-008-0157-3.
28. Desmarais DL, McKay JK, Richards JH, Sen S, Wayne T, Juenger TE. Physi-ological genomics of response to soil drying in diverse Arabidopsis accessions. Plant Cell. 2012;24(3):893–914. doi:10.1105/tpc.112.096180. 29. Patel JA, Vora AB. Free proline accumulation in drought-stressed plants.
Plant Soil. 1985;84(3):427–9. doi:10.1007/BF02275480.
30. Van Rensburg L, Krüger GHJ, Krüger H. Proline accumulation as drought-tolerance selection criterion: its relationship to membrane integrity
and chloroplast ultrastructure in Nicotiana tabacum L. J Plant Physiol. 1993;141(2):188–94. doi:10.1016/S0176-1617(11)80758-3.
31. Naser L, Kourosh V, Bahman K, Reza A. Soluble sugars and proline accumulation play a role as effective indices for drought tolerance screening in Persian walnut (Juglans regia L.) during germination. Fruits. 2010;65(02):97–112. doi:10.1051/fruits/20010005.
32. Wang GP, Zhang XY, Li F, Luo Y, Wang W. Overaccumulation of glycine betaine enhances tolerance to drought and heat stress in wheat leaves in the protection of photosynthesis. Photosynthetica. 2010;48(1):117–26. doi:10.1007/s11099-010-0016-5.
33. Schroeder JI, Kwak JM, Allen GJ. Guard cell abscisic acid signalling and engineering drought hardiness in plants. Nature. 2001;410(6826):327–30. 34. Alcázar R, Bitrián M, Bartels D, Koncz C, Altabella T, Tiburcio AF. Polyamine metabolic canalization in response to drought stress in Arabidopsis and the resurrection plant Craterostigma plantagineum. Plant Signal Behav. 2011;6(2):243–50.
35. Montesinos-Pereira D, Barrameda-Medina Y, Romero L, Ruiz JM, Sanchez-Rodriguez E. Genotype differences in the metabolism of proline and polyamines under moderate drought in tomato plants. Plant Biol. 2014;. doi:10.1111/plb.12178.
36. Yang J, Zhang J, Liu K, Wang Z, Liu L. Involvement of polyamines in the drought resistance of rice. J Exp Bot. 2007;58(6):1545–55. doi:10.1093/jxb/erm032. 37. Cortese L, Honig J, Miller C, Bonos S. Genetic diversity of twelve
switchgrass populations using molecular and morphological markers. BioEnergy Res. 2010;3(3):262–71. doi:10.1007/s12155-010-9078-2. 38. Lu F, Lipka AE, Glaubitz J, Elshire R, Cherney JH, Casler MD, et al.
Switch-grass genomic diversity, ploidy, and evolution: novel insights from a network-based snp discovery protocol. PLoS Genet. 2013;9(1):e1003215. doi:10.1371/journal.pgen.1003215.
39. Zhang Y, Zalapa JE, Jakubowski AR, Price DL, Acharya A, Wei Y, et al. Post-glacial evolution of Panicum virgatum: centers of diversity and gene pools revealed by SSR markers and cpDNA sequences. Genetica. 2011;139(7):933–48. doi:10.1007/s10709-011-9597-6.
40. Li G, Quiros CF. Sequence-related amplified polymorphism (SRAP), a new marker system based on a simple PCR reaction: its application to map-ping and gene tagging in Brassica. Theor Appl Genet. 2001;103(2–3):455– 61. doi:10.1007/s001220100570.
41. Aneja B, Yadav N, Chawla V, Yadav R. Sequence-related amplified polymorphism (SRAP) molecular marker system and its applications in crop improvement. Mol Breeding. 2012;30(4):1635–48. doi:10.1007/ s11032-012-9747-2.
42. Lin Z, Zhang X, Nie Y, He D, Wu M. Construction of a genetic link-age map for cotton based on SRAP. Chin Sci Bull. 2003;48(19):2064–8. doi:10.1360/03wc0193.
43. Liu Y, Zhang X, Miao J, Huang L, Frazier T, Zhao B. Evaluation of salinity tolerance and genetic diversity of thirty-three switchgrass (Panicum virgatum) populations. BioEnergy Res. 2014;7(4):1329–42. doi:10.1007/ s12155-014-9466-0.
44. Zhu X, Chang G, He D, Zhao H, Ma C. Evaluation of new onion varieties using cluster analysis and principal component analysis methods. Gansu Agr Sci. 2014;10:25–8.
45. Sakhi S. Shafiq ur R, Okuno K, Shahzad A, Jamil M. Evaluation of sorghum (Sorghum bicolor) core collection for drought tolerance: pollen fertility and mean performance of yield traits and Its components at reproduc-tive stage. Int J Agric Biol. 2014;16(2):251–60.
46. Gholami M, Rahemi M, Rastegar S. Use of rapid screening methods for detecting drought tolerant cultivars of fig (Ficus carica L.). Sci Hortic. 2012;143:7–14. doi:10.1016/j.scienta.2012.05.012.
47. Nazari L, Pakniyat H. Assessment of drought tolerance in barley genotypes. J Appl Sci (Faisalabad). 2010;10(2):151–6. doi:10.3923/jas.2010.151.156. 48. Dehbalaei S, Farshadfar E, Farshadfar M. Assessment of drought tolerance
in bread wheat genotypes based on resistance/tolerance indices. Int J Agric Crop Sci. 2013;5(20):2352–8.
49. Mittler R. Oxidative stress, antioxidants and stress tolerance. Trends Plant Sci. 2002;7(9):405–10.
50. McDowell N, Pockman WT, Allen CD, Breshears DD, Cobb N, Kolb T, et al. Mechanisms of plant survival and mortality during drought: why do some plants survive while others succumb to drought? New Phytol. 2008;178(4):719–39. doi:10.1111/j.1469-8137.2008.02436.x. 51. Rachmilevitch S, Huang B, Lambers H. Assimilation and allocation of