Efficient and Fair Bandwidth Scheduling in Cloud
Environments
Mustafa Khaleel
1and Mengxia Zhu
21Department of Computer, College of Science, University of Sulaimani, Kurdistan Region - F.R. Iraq
2Department of Computer Science, College of Science, Montclair State University, New Jersey, USA
Abstract–Hundreds of thousands of servers from data centers are operated to provide users with pay-as-you-go infrastructure as a service, platform as a service, and software as a service. Many different types of virtual machine (VM) instances hosted on these servers oftentimes need to
efficiently communicate with data movement under current
bandwidth capacity. This motivates providers to seek for a bandwidth scheduler to satisfy objectives, namely assuring the minimum bandwidth per VM for the guaranteed deadline and eliminating network congestion as much as possible. Based on some rigorous mathematical models, we formulated a cloud-based bandwidth scheduling algorithm which enables dynamic and fair bandwidth management by categorizing the total bandwidth into several categories and adjusting the allocated bandwidth limit per VM for both upstream and
downstream traffics in real time. The simulation showed that
paradigm was able to utilize the total assigned bandwidth
more efficiently compared to algorithms such as bandwidth efficiency persistence proportional sharing (PPS), PPS, and PS at the network level.
Index Terms–Cloud infrastructure, Cloud scheduler, Pay-as-you-go, Makespan.
I. Introduction
The increasingly growing demands from a large number of active cloud users have put forward many performance challenges for both processing and bandwidth orchestration in a cloud architecture. As a result, maintaining and troubleshooting the connection among various virtual
machines (VMs) along many communication paths calls for a performance-guaranteed bandwidth scheduling strategy. Many modern datacenters (DCs) that support large-scale processing workflows require hundreds of thousands cloud-based VMs to be established and these VMs need to exchange data frequently (Saurabh, et al., 2011). According to the reported by Environmental Protection Agency (EPA) in 2007, these high-performance computing DCs consumed approximately 7.2 billion US dollars within 1 year (Jonathan, 2007 and Massoud and Inkwon, 2010). In 2013, every 60 s, 204 million emails were sent; 5 million searches were made on Google engine; 1.8 million “Likes” were posted on Facebook; 35,000 tweets were sent on Twitter; $272 thousands of commodities were sold on Amazon; and finally for sound marketing, 15,000 tracks were downloaded through iTunes according to Natural Resources Defense Council (Pierre and Josh, 2014) and the U.S. EPA (Richard, et al., 2008). The high volume of incoming and outgoing traffics requires cloud providers to dedicate an efficient network bandwidth scheduler that considers both the network proportional fairness and low risk of bandwidth congestion. As Garg stated that if cloud providers do not strive to improve resource utilization to meet the ever-increasing demands under limited resources, they might increase the cost for cloud users to maintain their profits which eventually pricing themselves out of existence (Saurabh, et al., 2009). Idle servers are usually shut down to save the power and allocated bandwidth (Giorgio, et al., 2013). Statistics shows that the average resources utilization rate in modern DCs can be as low as 20% with many idle servers. We propose a bandwidth scheduler to enhance the bandwidth utilization rate per (VMs) through dynamic classification of the total allocated bandwidth into percentage classes and providing the minimum assurance best effort bandwidth per VM for both up streaming and down streaming traffics to guaranteed deadline. Then, readjusting the limited assigned bandwidth per VM based on the necessity of available workloads. The submitted user jobs are formulated as general directed acyclic graph (DAG)-structured workflows with module dependency. The simulation results based on CloudSim (Tarun, et al., 2012) showed that our approach significantly enhanced the rates of bandwidth utilization per VM compared with other algorithms such as bandwidth efficiency persistence proportional sharing (BEPPS), PPS, and PS at the network level (Xiang and Nirwan, 2013).
ARO-The Scientific Journal of Koya University
Volume VI, No.2 (2018), Article ID: ARO.10441, 7 pages DOI: 10.14500/aro.10441
Received 29 July 2018; Accepted 8 November 2018 Regular research paper: Published 29 November 2018
II. Related Work
Many performance metrics including job makespan, energy cost, and bandwidth fairness have been considered in many cloud computing research. Researchers are trying to find an equilibrium point between high bandwidth utilization and high-resource utilization for cloud resources. For instance, a concept of providing bandwidth control as a service was proposed by classifying the network connections into groups and adjusting the weights over the links connecting different VMs (Anthony, 2016). However, BEPPS at network level was presented to increase the provider’s profits through disbanding the unfair bandwidth utilization (Xiang and Nirwan, 2013). The bandwidth allocated for the communicating VM pairs which utilizes the bottleneck link will be increased. Furthermore, the downlink spectrum efficiency was enhanced by incorporating coalitions of remote radio head (RRH) (Zhuofu, et al., 2016). Each RRH can be attached or dispatched per coalition for better utilization. A prototype system was proposed with a single joint optimization function considering both efficiency of energy and spectral efficiency. Orthogonal frequency division multiplexing-based networks were used to improve the functionality of RE (Dingzhu, et al., 2017). Data replication
was used to reduce the network delays while achieving the quality of service (QoS) (Dejene, et al., 2015).
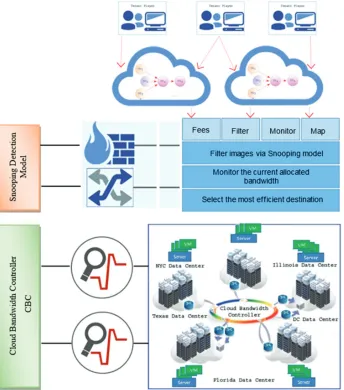
III. Cloud Conceptual Framework
Cloud tenants submit their job requests either as a single independent task or as a DAG-structured workflow to the cloud meta-scheduler. The cloud scheduler applies four main duties after applying topological sorting for the DAG: First, detecting any anomalous behaviors via cloud snooping module; second, pricing the providers in case of deadline violation; third, initiating the minimum assurance best effort per VM for the guaranteed deadline and monitoring the allocated bandwidth through sending and receiving status requests to and from the cloud bandwidth controller; and finally, based on bandwidth and computing capacities, the scheduler maps the workflow tasks to the appropriate VMs. Cloud bandwidth controller readjusts the inner allocated bandwidth per VM when the level of workloads increases. Based on the bandwidth availability, the cloud bandwidth controller will assign new percentage values to the current bandwidth allocated to enhance the system utilization rates. Fig. 1 demonstrates our prototype architecture.
IV. Mathematical Model
For decades, researches have considered the efficiency as one of the major parameters when it comes to establishing a fair data transporter. Nowadays, increasing cloud provider’s interests through bargaining both the overhead of cloud-based bandwidth and workflow’s execution time become researcher’s primary concern. According to Dara, et al., 2009 and Anshul, et al., 2009, the cost consumed by idle resources is about 70% of the total aggregate cost exhausted by fully operated resources. As these servers are fully interconnected through high dedicated bandwidth, the idle resources will make those high dedicated bandwidths unproductive (Yogesh, et al., 2016 and Dinh-Mao, et al., 2017). These challenges motived us to formulate a conceptual framework with the aim of achieving bandwidth proportionality fairness among fully interconnected VMs. This heuristic is based on two main ideas; first, the total bandwidth allocated is categorized to classes with different bandwidth capabilities. Second, a minimum assurance bandwidth is assigned per VM and will be adjusted by cloud bandwidth controller depending on the workloads. Mathematically, we have provided the model for executing a single module mi over a VM Vmj from time 0 to time n in equation (1) and the running time for executing a batch of modules mapped onto node Vj in equation (2). Where, ϑ (ui) is the total aggregate data input for the module
ui and ξi (.) is the complexity of the same assigned module. C_(vm_mk∈vj ) is the normalized computing power of virtual
Vmk to execute module ui.
Texe(mi, vmj)=∑(α(T)×δi(T)/P(vj)τ0,τn) (1)
( ) ()
(
)
0 0 , , , , . / m jn mk j
n i m j
M
ô ô i i vm v
u M
u
î
J ∈ τ τ
∈
=
∑
×
(2)
Subject to: ui∈ CP (Wi) Where, 0 ,
,mn j
M
τ τ
is the running time of a batch of modules
Mm mapped over server j’s Vth VM starts at time τ0 and ends at time τn. CP(Wi) is the critical path that exists in workflow
i. C(DCd [τ0,τn]) is the normalized computing power of datacenter DCd during time τ0 to τ1.
V. DAG - Scientific Workflow
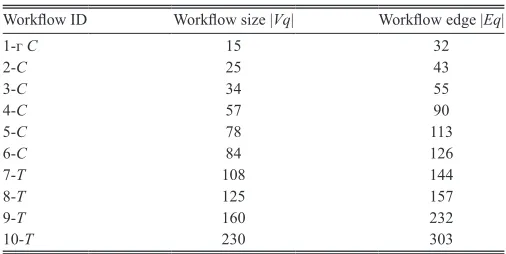
DAG as defined in Maria and Rajkumar, 2017 includes dual major parameters, namely vertices |va| and the edges |Ea|, among these modules. The first parameter consists of an array of the batch of module applications {a1, a2, a3,…, aq}
which initiates with a1 and terminates with aq. The second parameter represents the weights from a module to others. There are various types of scientific workflows where researchers conduct them to improve the QoS specified in service level agreement. A tremendous advantage of scheduling cloud images as workflows is the dependency and parallelism which embedded in the structure of workflows. Some required conditions are as follows: First, the modules should be dispatched collectively as a group which increases the execution efficiency. Second, none of prepared modules can start its execution unless it receives the total aggregated input from its preceding modules. Third, the complexity function of each module will be added to its total input
data size. Finally, when a specific module executed through specific computing resource, the outcome result will be transferred to the module’s succeeding module. However, the running time for executing a workflow Wi over cloud server vj from time 0 to time n is given in equation (3) and the total cost of running the entire workflows mapped onto cloud DCs is given in equation (4). Table 1 illustrates the sample workflows with their sizes and edges that have been conducted in our paradigm’ simulation.
( )
( )
0(
0( )
)
, , , m j n n j d M j st
i j sh
v
t τ Idle t
τ τ τ ∀ ∈
=
∑
+ + +
(3)
( )
(
[
0]
)
1 1
/ ,
i d n
i= d=
ς =
∑
∑
τ τ (4)
Where, tst is the initial startup times, Idle (vj) is the idle time for node vj, and tsh is the shutdown times. C(DCd[τ0,τn]) is the normalized computing power of datacenter d during times τ0, τn.
VI. Cloud Bandwidth Controller
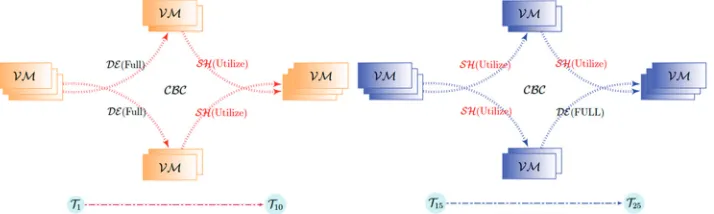
One of the major cloud bandwidth controller (CBC) duties is to map the allocated total aggregated bandwidth into group of percentage classes for dynamic bandwidth management. Each class has specific characteristics in terms of inner VM connections. At the first glance, when the scheduling of DAG - scientific workflows initiates to be processed over cloud-based VM infrastructure, CBC assigns the minimum assurance best effort bandwidth per VM where each connection is fully utilized within limited incoming and outgoing traffics. Right after the network becomes oversubscribed, the CBC will adjust the preassigned allocated bandwidth per VM. Equations 5 and 6 formulate the cloud bandwidth controller and efficiency, respectively.
CBC=Tς⁄min(ass(βvi,vj,τ0,τn)) (5)
EFF=Total Bandwidth Allocated⁄min(assurance Best
Effort Bandwidth Per VM) (6)
Where, (βvi,vj,τ0,τn) is the allocated bandwidth from vi to vj
from time 0 to time n. Illustration (2) explains how the cloud bandwidth controller works during the module execution time. As the process launches at period 1–10, the available bandwidth would be free and the VMs will be assigned fixed bandwidth limits. At time 15 s, when the network’s load becomes heavier, the CBC will readjust those channels that
TABLE I
Scientific Workflow Configuration
Workflow ID Workflow size |Vq| Workflow edge |Eq|
1-ᴦ C 15 32
2-C 25 43
3-C 34 55
4-C 57 90
5-C 78 113
6-C 84 126
7-T 108 144
8-T 125 157
9-T 160 232
would otherwise enter congestion status. The system becomes oversubscribed at time 25 s and the CBC will assign new bandwidth values per VM to accommodate the current need.
VII. Problem Formulation
As many tenants share the same underlying cloud infrastructure, the problem arises when the network bandwidth may not be allocated efficiently and results in low performance. This results in unpredictable bandwidth utilization and needs to be addressed through allocating more bandwidth to big jobs and allocates less bandwidth to small jobs while assuring the bandwidth availability and eliminating network congestion.
Definition 1: Given a DAG-structured workflow Gt=(Vt,Et) and underlying heterogeneous cloud hardware Gm=(Vm,Em), where each computing server is allocated with a minimum bandwidth for the guaranteed deadline, we concentrate on finding a workflow mapping schedule that the fairness is increased under the certain MEED constraint and avoid congestion.
∀ possible mappingincrease
(
s,d( )
)
(7)Conns,d
T MEED ubject to < congestion
∉
Where, Fvs,vd, with source and destination server as
vs,vd, is the fairness for all allocated bandwidth. KConnvs,vd is the entire connections between the source and destination servers. MEED is the minimum end-to-end delay that cannot be violated.
VIII. Performance Evaluation
A. Experimental Setup
For this testbed evaluation, several workflows with different workloads have been estimated using the well-known open source Java-based CloudSim toolkit (Tarun, et al., 2012). However, these workflows are scheduled over heterogeneous cloud-based data centers where each one includes 100 computing servers. The CPU frequencies are ranged from 0.8 GHz to 2.5 GHz with the random access memory. Furthermore, various VMs with different instance types have been assigned to each computing server to serve the
user’s needs on different cost types. For the cloud provider’s interest, we set the unit price for each module execution as $0.6/h and the VM’s initiating time and eliminating time to 100 and 8 s, respectively. To evaluate network bandwidth efficiency, we have compared our paradigm with algorithms, namely BEPPS, PS, and PPS, at network level (Xiang and Nirwan, 2013).
B. Experimental Results
To visualize the full coverage of bandwidth efficiency persistence propositional at network layer, five performance metrics have been used in this experiment. They include bandwidth utilization rate, incoming bandwidth limits, outgoing bandwidth limits, and provider’s interest. Since we have evaluated 10 different workflows scheduled over 10 heterogeneous cloud data centers, it is not feasible to plot all 20 workflows under all different data centers. Selected experiments have been presented as shown in Figs. 3-12. Based on server’s capabilities in terms of workflow module execution, we have selected six DCs from the total of 10 DCs to evaluate bandwidth utilization rate in Fig. 3. According
to Fig. 3, our paradigm achieved the highest utilization rates, especially in DCs 4, 5, and 6 compared to the other algorithms BEPPS, PS, and PPS. Our lowest difference rate in datacenter 1 is 0.22 compared to PPS, 0.35 compared to PS, and 0.16 compared to BEPPS, whereas the highest difference rate can be observed in datacenter 6 which is 0.15 compared to PPS, 0.18 compared to PS, and 0.11 compared to BEPPS. We have repeated the same scenario for assigned workflows in Fig. 4. Among the six workflows, the highest utilization rates achieved in both workflows 3 and 4 are 0.99. The lowest bandwidth utilization rates are seen in workflows 5 and 6. The diversity in both workflows 3 and 4 is exaggerated compared to workflows such as 1, 5, and 6. The worst case can be observed compared with algorithm PS. The highest rates are 0.7 and 0.72, whereas the lowest rates are 0.12 and 0.15. We also have evaluated the cloud interest over six workflows and DCs as demonstrated in Figs. 5 and 6. First, we have calculated the interest per DCs in diagram (5) and our heuristic gains the highest payoff compared to methods BEPPS, PS, and PPS. In datacenter 2, our algorithm is supreme to earn approximately $563, whereas the minimum revenue is achieved in datacenter 4 which is $294. The test scenario is repeated for algorithm PS which accomplished the worst case, especially in datacenter 1 with profit of $230.
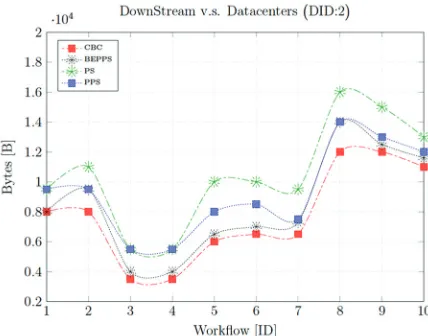
Our technique has achieved the highest output in workflows 3 and 4 which are $397 and $470, respectively. For both metrics incoming and outgoing bandwidth limits, we have evaluated a total of 10 workflows under one datacenter as well as 10 DCs for a single scheduled workflow as illustrated in Figs. 7-10. For incoming and outgoing bandwidth limits versus DCs, the total bandwidth allocated is used as baseline for the comparison as shown in Figs. 7 and 9, respectively. It can be seen that the other two algorithms, namely PS and PPS, violated the baseline bandwidth, whereas our paradigm maintained the workload under deadline as shown in Fig. 7.
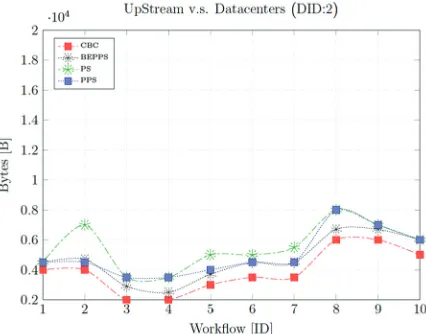
The main reason is that our heuristic allocated bandwidth fairly per VM. In terms of assigned workflows metric, the best fairness case can be observed within our pattern, whereas the BEPPS is achieved better fairness compared to the other two algorithms PS and PPS. However, for outgoing bandwidth limit metric, the values of our algorithm have changed over each datacenter consecutively as in Fig. 9. PS algorithm is inferior to others, especially under DCs ID
Fig. 3. Bandwidth utilization versus datacenters.
Fig. 4. Bandwidth utilization versus workflows scheduling.
Fig. 5. Cloud provider profit versus datacenters.
Fig. 6. Cloud provider profit versus workflows scheduling.
Fig. 7. Downstream traffics versus datacenters.
= 2 and 6. Furthermore, CBC heuristic attains steady rates when the workflows are scheduled over datacenter ID = 2. The other two algorithms PS and PPS have the same rates over most workflows. Moreover, we also have integrated the evaluation for the module application completion time (Makespan) against batch of workflows and eight different DCs. In Fig. 11, our paradigm executed the scheduled workflows in less time compared to BEPPS, PS, and PPS. We can observe that the other three algorithms either have violated the tenant’s deadlines or close to violate them. Our objective’s bandwidth fairness technique is based on utilizing cloud resources more efficient while executing modules applications within tenant’s deadline. However, in Fig. 12, CBC heuristic achieved better completion time, especially in datacenter 2, 4, and 6. The worst case can be seen for PS algorithm in both figures. It required more times to complete the execution process.
IX. Conclusion
Cloud providers would like to execute as many tasks as possible from multiple tenants for high system throughput and resource utilization. Efficiently allocating and utilizing
bandwidth resources among communicating VMs are a critical task to achieve the throughput and efficiency. A bandwidth scheduler was proposed in this paper to meet objectives of assuring the minimum bandwidth per VM for the guaranteed deadline and reducing network congestion as much as possible. Our approach exploited the idea of dynamic bandwidth utilization by categorizing the total allocated bandwidth into percentage values and regulating the bandwidth per VM based on upstream and downstream traffics. The simulation results have shown that our heuristic preserved a considerable amount of bandwidth through utilizing the allocated bandwidth more efficiently compared to algorithms such as BEPPS, PS, and PPS at network level (Xiang and Nirwan, 2013).
References
Anshul, G., Mor H.B., Rajarshi, D., and Charles, L., 2009. Optimal power allocation in server farms. Proceedings of the eleventh international joint conference on Measurement and modeling of computer systems. (SIGMETRICS ‘09). ACM, New York, USA, pp.157-168.
Anthony, A. Jr., 2016. Improving Bandwidth Allocation in cloud Computing Environments via Bandwidth as A Service Partitioning. Available from: https:// www.digital.library.txstate.edu/handle/10877/6315. [Last accessed on 2018 Aug 01].
Fig. 9. Upstream traffics versus datacenters.
Fig. 10. Upstream traffics versus workflow scheduling.
Fig. 11. Execution time versus datacenters.
Dara, K., Jeffery, O.K., James, E.H., Nagarajan, K., and Guofei J., 2009. Power and performance management of virtualized computing environments via look ahead control. Cluster Computing, 12(1), pp.1-15.
Dejene, B., Dzmitry, K., Fabrizio, G., Pascal B., and Albert. Y.Z., 2015. Energy-efficient data replication in cloud computing datacenters. Cluster Computing, 18(1), pp.385-402.
Dingzhu, W., Guanding, Y., Rongpeng, L., Yan, C., and Geoffrey, Y.L., 2017. Results on energy-and spectral-efficiency tradeoff in cellular networks with full-duplex enabled base stations. IEEE Transactions on Wireless Communications, 16(3), pp.1494-1507.
Dinh-Mao, B., YongIk, Y., Eui-Nam, H., SungIk, J., and Sungyoung, L., 2017. Energy efficiency for cloud computing system based on predictive optimization. Journal of Parallel and Distributed Computing, 102, pp.103-114.
Giorgio, L.V., Samee. K., and Pascal B., 2013. Energy-efficient resource
utilization in cloud computing. Large Scale Network-Centric Distributed
Systems, 45, pp.377-408.
Jonathan, G.K., 2007. Estimating Total Power Consumption Report by Servers in the US and the World. Available from: http://www-sop.inria.fr/mascotte/ Contrats/DIMAGREEN/wiki/uploads/Main/svrpwrusecompletefinal.pdf. [Last accessed on 2016 Jul19].
Maria, A.R., and Rajkumar, B., 2017. Budget-driven scheduling of scientific workflows in IaaS clouds with fine-grained billing periods. ACM Transactions on Autonomous and Adaptive Systems, 12(2), DOI: https://doi.org/10.1145/3041036. Massoud, P., and Inkwon, H., 2010. Power and Performance Modeling in a
Virtualized Server System. 39th International Conference on Parallel Processing
Workshops (ICPPW), San Diego, CA, USA: September 13-16.
Pierre, D., and Josh, W., 2014. Scaling Up Energy Efficiency Across the Data Center Industry: Evaluating Key Drivers and Barriers. Available from: https:// www.nrdc.org/sites/default/files/data-center-efficiency-assessment-IP.pdf. [Last accessed on 2014 Aug 29].
Richard, B., Eric, M., Bruce, N., Bill, T., Arman, S., John, S., Jonathan, K., Dale, S., and Peter, C., 2008. Report to Congress on Server and Data Center Energy Efficiency: Public Law 109-431. Lawrence Berkeley National Laboratory. Saurabh, K.G., Chee, S.Y., Arun A., and Rajkumar, B., 2011. Environment-conscious scheduling of HPC applications on distributed cloud-oriented data
centers.Journal of Parallel and Distributed Computing, 71(6), pp.732-749.
Saurabh, K.G., Chee, S.Y., Arun, A., and Rajkumar, B., 2009. Energy-Efficient Scheduling of HPC Applications in Cloud Computing Environments. Ithaca, New York, CoRR, abs/0909.1146.
Tarun, G., Ajit, S., and Aakanksha, A., 2012. Cloudsim: Simulator for
cloud computing infrastructure and modeling. Procedia Engineering,
(38), pp.3566-3572.
Xiang, S., and Nirwan, A., 2013. Improving Bandwidth Efficiency and fairness in cloud computing. IEEE Global Communications Conference (GLOBECOM). Atlanta, GA, USA: December 9-13.
Yogesh, S., Bahman, J., Weisheng, S., and Daniel, S., 2016. Reliability and energy efficiency in cloud computing systems: Survey and taxonomy. Journal of Network and Computer Applications, 74, pp.66-85.
Zhuofu, Z., Jun, P., Xiaoyong, Z., Kaiyang, L., and Fu, J., 2016. A
game-theoretical approach for spectrum efficiency improvement in cloud-RAN. Mobile