DOI: 10.30954/0974-1712.12.2018.3
©2018 New Delhi Publishers. All rights reserved
GENETICS AND PLANT BREEDING
Evaluation of Genetic Divergence Analysis in Wheat for Yield
and its Component Characters
Chitralekha Shyam*, P.K. Chandrakar, N.K. Rastogi and Umakant Banjare
Department of Genetics and Plant Breeding, Indira Gandhi Krishivishwavidyalaya, Raipur, Chhattisgarh, India *Corresponding author: [email protected] (ORCID ID: 0000-0001-7311-2255)Paper No. 748 Received: 16-07-2018 Accepted: 24-11-2018
ABSTRACT
Genetic diversity plays an important role because hybrids between lines of diverse origin generally, display a greater heterosis than those between closely related parents. Genetic diversity arises due to geographical separation or due to genetic barriers to crossability. In this study, genetic diversity of twenty two genotypes of wheat was evaluated for fourteen characters using Mahalanobis D2 statistics. The wheat genotypes were grouped into three clusters. The cluster III was the largest group which consist of 9 genotypes followed by cluster II (7 genotypes) and cluster I (6 genotypes). From the clustering pattern, it was found that the wheat genotypes were genetically diverse to each other. Hence, the genotypes studied are reliable enough for selection of parents making crosses. The maximum intra cluster distances were observed in cluster III (2.945) followed by cluster I (2.463) and cluster II (2.324). The selection of divergent genotype from above clusters would produce a broad spectrum of variability for quantitative traits studied, which enable further for selection and improvement. The maximum inter cluster distance was observed in between cluster I and cluster III (4.987) followed by between clusters II and cluster III (4.355) and cluster I and cluster II (3.717). This suggested that the hybridization programme involving parents from these clusters is expected to give higher frequency of better segregantes or desirable combination for development of useful genetic stocks or varieties.
Highlights
mThe maximum intra cluster distances were observed in cluster III (2.945) followed by cluster I (2.463) and cluster II (2.324).
mThe maximum inter cluster distance was observed in between cluster I and cluster III (4.987) followed by between clusters II and cluster III (4.355) and cluster I and cluster II (3.717).
Keywords: D2 statistics, genetic divergence, traits, wheat
Wheat has been the prime and staple food crop of many human civilizations in the world. It is the second staple food in India after rice. It is cultivated for dual purpose grain and straw in India, Pakistan, Burma and Thailand. In India also the larger area is under wheat cultivation. About 90 percent of total wheat production is contributed by five states viz., Uttar Pradesh, Punjab, Haryana, Madhya Pradesh and Rajasthan. The other wheat producing states are Bihar, Gujarat, Jammu and Kashmir, Maharashtra, West Bengal and Chhattisgarh. The area, under wheat in India during 2000 to 2014 is increased from 25.73 to 30.00 million hectare where,
during 2011-12 that is 1.31 percent and least during 2002-03 that is 1.30 percent. The average increase in the growth rate of area under wheat during 2000 to 2014 is 1.30 percent in India (Anonymous 2014 a). The average growth rate in the production and yield per hectare during 2000-2014 is 3.7 and 3.9 percent respectively. Uttar Pradesh ranks first in production of wheat with record of 30.30 metric tonnes among the wheat growing states of the country followed by Punjab (16.11) and Madhya Pradesh (13.13) metric tonnes (Anonymous, 2013). Botanically, wheat is a diverse family of related species. Over two dozen individual species have been characterized as members of the genus Triticum. Of these, only four (Triticum monococcum L., Triticum turgidum L., Triticumtimopheevii Zhuk. and L. em thell.) are widely cultivated. Globally Triticumaestivum wheat is most important species which covers 90 percent of the area under cultivation. Total number of species in wheat is 16, out of which 4 species viz., Triticumaestivum L., T. durum L., T. dicocum L., and T. sphaerococcum L. are under cultivation. In India T. sphaerococcum L., has now practically gone out of cultivation because of its low productivity and high susceptibility to disease rust. The common bread wheat (T. aestivum L.) is the most important species,occupying more than 90 percent of the total wheat area in the country. The macaroni wheat (Triticum durum L.) is the second most important species, occupy nearly 10 percent of the total wheat area in India. Earlier, its cultivation was primarily confined to the central and southern India, with very small area in Punjab and West Bengal. It is used in the form of chapatti, bread, naan, tandoori, rumali, roti, puri, pudding, bhatore, bran and fodder etc. (Singh etal. 2013). Most of the agronomic characters in crop plants are quantitative in nature. Yield is one such character that results due to the actions and interactions of various component characters (Graficus 1960). In this study, genetic divergence analysis of twenty two genotypes of wheat was evaluated for fourteen characters using Mahalanobis D2 statistics.
MATERIALS AND METHODS
Twenty two wheat genotypes including seven check varieties were used in this study. All the twenty two genotypes were grown in Randomized Block Design with three replications during Rabi
2013-14 at the Instructional cum Research Farm, Indira Gandhi Krishi Vishwavidyalaya, Raipur. In each replication twenty two genotypes were grown in 10 rows, 5 m long and 20 cm apart. Chhattisgarh is located in the east - central part of the country between 17°14’N and 24°45’ N latitudes and 73°30’ E and 84°15’ E longitudes. The crop was provided with protective irrigations and recommended doses of fertilizers. Five randomly selected plants from each treatment were chosen for recording the observations on quantitative characters, viz., Days to 50% flowering, Days to maturity, Plant height, Number of tillers per plant,Spike length, Number of spikelets per spike, Number of seeds per spikelet, Number of seeds per spike, Number of seeds per plant, 1000-seed weight, Seed yield per plant, Biological yield per plot, Seed yield per plot and Harvest Index. Genetic divergence analysis measures by two method as metroglyph and D2 statistics method. D2 statistics was developed by P.C. Mahalanobis in 1928. This is one of the potential techniques of measuring genetic divergence. Rao, (1952) suggested the application of this technique for the assessment of genetic divergence in plant breeding. Thus, genetic divergence was computed by D2 statistics and varieties were grouped into a number of clusters. The varieties were grouped into a number of clusters as per the standard procedure described by Spark (1973).
RESULTS AND DISCUSSION
genotypes into relatively homogeneous groups in such a way that within cluster diversity is minimized and between clusters diversity is maximized. The respective genotypes from diverse clusters can be utilized in breeding programme depending upon the breeding objectives.
Clustering pattern in genotypes
A set of 22 genotypes of wheat were subjected to D2 analysis for fourteen characters. Based on D2 values three clusters were formed (Table 1). This indicated that substantial diversity exists in the available genotypes of wheat. Results of cluster analysis revealed that the cluster III was the largest group consisting of 9 genotypes followed by cluster II (7 genotypes) and cluster I (6 genotypes). From the clustering pattern, it was found that the wheat genotypes were genetically diverse to each other. Hence, the genotypes studied are reliable enough for hybridization and selection. HD varieties are distributed over I and II clusters, HI varieties are distributed over I, II and III clusters, GW varieties are distributed over I and II clusters and CG varieties are also distributed over II and III clusters indicating there is little role of geographical origin in genetic diversity.
Table 2: Inter and Intra cluster distance of genotypes in wheat
Cluster I II III
I 2.463
II 3.717 2.324
III 4.987 4.355 2.945
On the other hand, the MACS varieties, MP varieties and MPO varieties were grouped exclusively in Cluster I, I and II respectively, indicating some role of geographical origin in the composition of
clusters. So, the role of geographical origin cannot be overruled as a whole in cluster composition. Present results confirms the finding of previous workers Kumar et al. (2009), Ferdous et al. (2011), Ajmal et al. (2013), Kumar et al. (2013), Verma et al. (2013), Verma et al. (2014) and Yadav et al. (2014).
2.463
2.945 2.324
3.717
4.355
4.987 I
II III
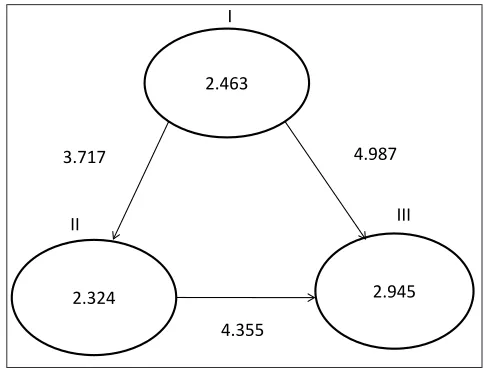
Fig. 1: Digrammatic representation of different inter and intra cluster distance in wheat
Intra and inter cluster distance
The maximum inter cluster distance was observed in between cluster I and cluster III (4.987) followed by between cluster II and cluster III (4.355) and cluster I and cluster II (3.717). This suggested that the hybridization programme involving parents from the diverse clusters is expected to produce better desirable segregants for development of useful genetic stocks or varieties. The minimum inter cluster distance was observed in between cluster I and cluster II (3.717). The maximum intra cluster distances were observed in cluster III (2.945) followed by cluster I (2.463) and cluster II (2.324). The selection of divergent genotype from above clusters would produce a broad spectrum
Table 1: Grouping of twenty two wheat genotypes in different clusters
Cluster No. of
genotypes Name of genotypes
I 6 HD2932 (IARI, New Delhi), HD4728 (IARI, New Delhi), MACS6604 (ARI, Pune, MH), MP3382 (JNKVV, Jabalpur, MP), HI8750 (IARI, Indore, MP), GW451 (Kusinagar, Gujrat)
II 7 HD4730 (IARI, New Delhi), HI8736 (IARI, Indore), MPO1215 (Powarkheda, MP), HI8498 (IARI, Indore), HI8737 (IARI, Indore), CG1304 (Bilaspur, IGKV), GW322 (Kusinagar Gujarat)
of variability for quantitative traits studied, which enable further for selection and improvement. The minimum intra cluster distance was observed in cluster II (2.324). Present results confirm the finding of previous worker Singh et al. (2014). Many researchers in different crops have also reported that selection of parents for hybridization should be done from two clusters having wider inter-cluster distance to get maximum variability in segregating generations. Heterosis is generally attributed to genetic divergence among the parental lines involved in the cross. Nevertheless, the genetic divergence for the maximum expression of the heterotic effects has a limit as suggested by Moll et al. (1965) and Arunachalam and Bandyopadhyay (1984).
Components of cluster mean
The comparison of cluster means revealed
considerable differences among the clusters of different quantitative characters (Table 3). The cluster I had the higest mean value for number of seeds per spikelets (2.78), number of seeds per spike (44.61), number of seeds per plant (215.33), seed yield per plant (8.58), biological yield per plot (7.78), seed yield per plot (6180.56) and harvest index (43.11) similarly, genotypes included in cluster II recorded the highest mean value for days to 50 % flowering (60.00) and 1000 seed weight (47.81) whereas, the cluster III exhibited highest mean value for days to maturity (103.67), plant height (89.61), number of tillers per plant (4.65), spike length (9.09) and number of spikelets per spike (16.59). Present results confirms the finding of previous workers Kumar et al. (2009), Kumar et al. (2013), Verma et al. (2013), Yadav et al. (2014) and Singh et al.(2014).
Table 3: Mean performance of genotypes in individual cluster for seed yield and its components in wheat
Characters
Clusters Entries
Days to 50% flowering Days to maturity Plant height
(cm)
No. of tillers per plant Spike length (cm) No. of
spikelets per
spike
No. of seeds per spikelet No. of seeds per spike No. of seeds per plant 1000 seed weight (g) Seed yield per plant(g) Biological yield per plot
(g)
Seed yield per
plot (g)
Harvest index
(%)
I 6 52.94 97.22 71.08 4.07 8.31 15.50 2.78 44.61 215.33 43.05 8.58 7.78 6180.56 43.11 II 7 60.00 99.38 70.19 3.55 6.88 15.19 2.53 38.10 158.90 47.81 7.62 5.72 5373.09 42.69 III 9 59.96 103.67 89.61 4.65 9.09 16.59 2.61 41.48 148.26 39.70 7.20 2.96 3798.15 36.62
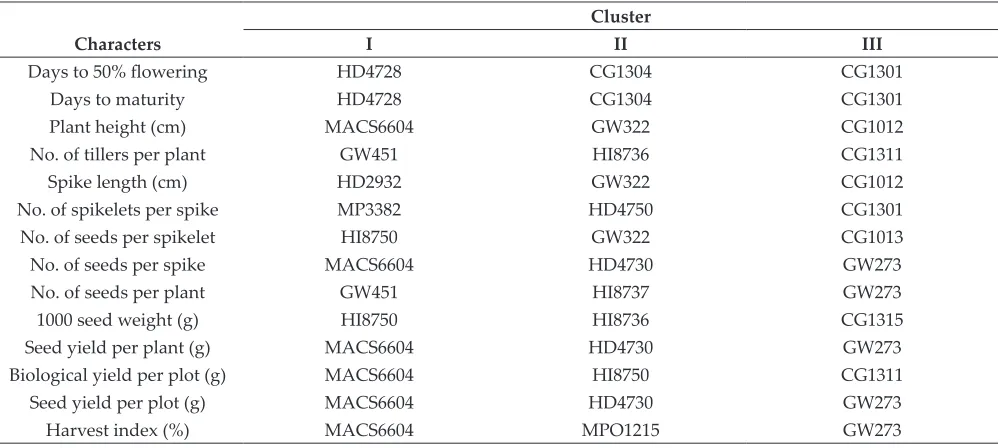
Table 4: Desirable genotype based on cluster performance in wheat
Cluster
Characters I II III
Days to 50% flowering HD4728 CG1304 CG1301
Days to maturity HD4728 CG1304 CG1301
Plant height (cm) MACS6604 GW322 CG1012
No. of tillers per plant GW451 HI8736 CG1311
Spike length (cm) HD2932 GW322 CG1012
No. of spikelets per spike MP3382 HD4750 CG1301
No. of seeds per spikelet HI8750 GW322 CG1013
No. of seeds per spike MACS6604 HD4730 GW273
No. of seeds per plant GW451 HI8737 GW273
1000 seed weight (g) HI8750 HI8736 CG1315
Seed yield per plant (g) MACS6604 HD4730 GW273
Biological yield per plot (g) MACS6604 HI8750 CG1311
Seed yield per plot (g) MACS6604 HD4730 GW273
Desirable genotypes based on cluster performance
The better genotypes were identified in respect of most of the characters on the basis of mean performance in the cluster (Table 4). The result revealed that the genotype CG1301 of cluster III possessed the highest mean value for days to 50% flowering (70.00) and days to maturity (114.00). The genotype CG1012 (98.53 cm) of cluster III possessed the highest mean value for plant height. The genotype GW451 (5.60) of cluster I and CG1311 (5.60) of cluster III displayed highest mean value for number of tillers per plant. The genotype CG1012 (9.57 cm) of cluster III possessed the highest mean valuefor spike length. The genotype CG1301 (18.53) of cluster III was characterized by highest mean value for number of spikelets per spike. The genotype HI8750 (3.00) of cluster I possessed the highest mean value for number of seeds per spikelet. The genotype GW273 (208.00) of cluster III possessed the highest mean value for number of seeds per plant. HI8736 (52.11) of cluster II showed the highest mean value for 1000-seed weight. Genotype MACS6604 of cluster I showed the highest mean value for seed yield per plant (48.00), biological yield per plot (15000.00), seed yield per plot (6750.00), seeds per spike (48.00) and harvest index (48.00). The mean value of different characters of three clusters indicated the superior expression of some characters in different clusters. Present results confirm the finding of previous workers like Verma et al. (2013) and Singh et al. (2014). The importance of genetic diversity in wheat to recover transgressive segregants has also been emphasized by Jatasara and Paroda (1983) and Nimbalkar et al. (2002). According to Rahim et al. (2010) who demonstrated that the hybrids of genotypes with maximum distance resulted in high yield, the cross between these genotypes can be used in breeding programs to achieve maximum heterosis. Cluster I and III showed maximum inter cluster distance and crossing of genotypes from cluster I with genotypes from cluster III would like to produce desirable recombinants in segregating generations with improvement in traits to enhance the yield. Thus, it is evident from the present finding that substantial genetic divergence was envisaged in genetic stock of wheat. The varieties of same
geographical region clustered with the varieties of other geographical region due to selection pressure and genetic drift. This indicates that there is no parallelism between genetic diversity and geographical region except in some cases. Hybridization between the genotypes of different clusters can give high amount of hybrid vigour and good recombination.
CONCLUSION
Maximum inter cluster distance was foundbetween the genotypes of cluster I and III. So, if crossing is done between genotypes of cluster I with III. Then crosses between the genotypes of cluster I with III would like to exhibit high heterosis and produce recombination’s with desired traits and also generate wide variability in genetic architecture.
REFERENCES
Ajmal, S.U., Minhas, N.M., Hamdani, A., Shakir, A., Zubair, M. and Ahmad, Z. 2013. Multivariate analysis of genetic divergence in wheat (Triticum aestivum L.) germplasm. Pak. J. Bot.,45(5): 1643-1648.
Anonymous, 2013. Department of Economics and Statistics, Govt. of India.
Anonymous, 2014 a. FAO STAT and IGC Report, pp-1-3. Anonymous, 2014 b. Department of Economics and Statistics,
Govt. of India.
Arunachalam, V. and Bandyopadhyay, A. 1984. Limit to genetic divergence for occurrence of heterosis: Experimental evidence from crop plants. Indian J. Genet., 44: 548-554.
Ferdous, M., Nath, U.K. and Islam, A. 2011. Genetic divergence and genetic gain in bread wheat through selection practices. J. Bangladesh Agril. Univ.,9(1): 1-4. Gelalcha, S. and Hanchinal, R.R. 2013. Correlation and path
analysis in yield and yield components in spring bread wheat (Triticum aestivum L.) genotypes under irrigated condition in Southern India. Afri. J. Agril. Res.,8(24): 3186-3192.
Grafius, J.E. 1960. Does overdominance exist for yield in corn. Agron. J.,52: 361.
Jatasara, D.S. and Paroda, R.S. 1983. Genetic divergence in wheat. Indian J. Genet.,43: 63-67.
Kumar, B., Lal, G.M.R. and Upadhyay, A. 2009. Genetic variability, diversity and association of quantitative traits with grain yield in bread wheat (Triticum aestivum L.). Asia. J. Ag. Sci., 1(1): 4-6.
Mahalanobis, P.C. 1936. On generalized distance in statistics. Proce. of Nat. Institute of Sci.,2: 49-55.
Moll, R.H., Lonniquist, J.H. and Johnson E.C. 1965. The relation of heterosis and genetic divergence in maize. Gen.,52: 139-144.
Nimbalkar, C.A., Navale, P.A. and Biradar, A.B. 2002. Generalized D² and genetic diversity in wheat. J. Maharashtra Agr. Univ.,27(1): 43-45.
Rahim, M.A., Mia, A.A., Mahmud, F., Zeba, N. and Afrin, K. 2010. Genetic variability, character association and genetic divergence in mungbean (Vigna radiate L. Wilczek). Plant Omic.,3: 1-6.
Rao, C.R. 1952. Advanced statistical methods in biometrical research. John Wiley and Sons, New York, USA.
Singh, G., Khan, M.H. and Bhan, S.K. 2008. Genetic divergence in wheat (Triticum aestivum L.). New Bot.,35(1-4): 65-69. Singh, S.V., Yadav, R.K. and Singh, S.K. 2013. Stability analysis
for yield and its contributing traits in wheat (Triticum aestivum L.). Inter. J. of Agri. Sci.,9(2): 480-485.
Singh, P., Singh, A.K., Sharma, M. and Salgotra, S.K. 2014. Genetic divergence study in improved bread wheat varieties (Triticum aestivum). Afri. J. of Agri. Res., 9(4): 507-512.
Verma, N.P., Singh, N.B. and Yadav, K.R. 2013 b. Genetic variability and divergence analysis of yield and its contributing traits under sodic soil condition in wheat (Triticum aestivum L.). Inter. J. of Agri. Sci.,3(2): 395-399. Verma, P.N., Singh, B.N., Singh, G., Singh, M.K. and Setter,
T.L. 2014. Genetic diversity analysis for yield and other agronomic traits in bread wheat under water logged sodic soil condition. J. Wheat Res.,6(1): 51-58.