A Study on the Shape Control of Multiple Layers for PES
Nanofiber Using Electrospinning Method of Top-down
Spinning
Nam
-
Su Kwak, Choul
-
Jun Choi
*, Jeong
-
Gi Lee
Department of Smart Appliances Innovation Support Center, Korea Electronics Technology Institute, 226, Cheomdangwagi-ro, Buk-gu, Gwangju, 61011, Republic of Korea.
* Corresponding author. Tel.: +82-62-975-7015; email:[email protected] Manuscript submitted June 4, 2019; accepted August 20, 2019.
doi: 10.17706/ijmse.2019.7.3.81-88.
Abstract: In this study, we investigated the diameter and pore control of PES nanofibers by focusing on the process parameters such as concentration of polymer solution, applied voltage of spin column, and injection rate of polymer solution among various electrospinning parameters. The device for electrospinning was designed by modularizing to be able to cope with changes in test conditions and large area.
The detailed device consists of a fabric feeding part, a spinning part, a soaking part, a drying part, and a fabric transfer part, the spinning device is based on top-down spinning and the spinning column is composed of 12 columns with 10 nozzles per column. The results obtained from this study are as follows. The maximum pore diameter is less than 22 kV at an applied voltage of 20 kV, the standard deviation of nanofiber diameter at each applied voltage means that the fibers radiated at 20 kV from 18 kV to 245.84 nm, 20 kV at 183.52, and 22 kV at 232 kV were more uniformly emitted, it has been proved that the nanofibers are radiated unevenly due to the effect of the strong applied voltage at 22 kV.
Key words: Electrospinning, PES(Poly-Ether-Sulfone), multiple layer, nano fiber, SEM(Scanning Electron Microscope).
1.
Introduction
Recently, there has been a surge of fine dust emissions and alarms according to the influence of long-distance movement of dust from China due to the indiscriminate industrialization in domestic and abroad. In addition, respiratory and cardiovascular diseases due to long-term human exposure of fine dusts are rapidly and markedly increasing [1]-[4].
Air pollution is mostly caused by fine dusts, such as gas from factories and automobile. This is divided according to particle size, fine dust (PM10) with a diameter of 10 μm or less, fine dust (PM2.5) with a diameter of 2.5 μm or less. Meta-analysis of the recent 24 articles has shown that exposure to short-term air pollution affects chronic obstructive pulmonary disease and asthma exacerbations, resulting in asthma-COPD overlap syndrome and the risk of poisoning increased.
Therefore, in order to reduce exposure of human dust to (micro) dust, various researches have been actively carried out such as protection products, a fine dust reduction technique, and an air purification technique [5]-[8].
fiber in the process of fabricating filter fabric through electrospinning of polyether sulfone (PES) material. In order to evaluate the structural effect of the PES filter fabric according to the electrospinning conditions, the density of the polymer mixed solution, the applied voltage of the electrospinning column nozzle, the injection rate of the polymer mixed solution, and the feed rate of the fabric were varied.
The analysis of the filter structure influence on electrospinning condition was confirmed by measuring the diameter, orientation and density of the nanofiber filter.
2.
Experiment of Condition for Electrospinning
Configuration of Electrospinning System
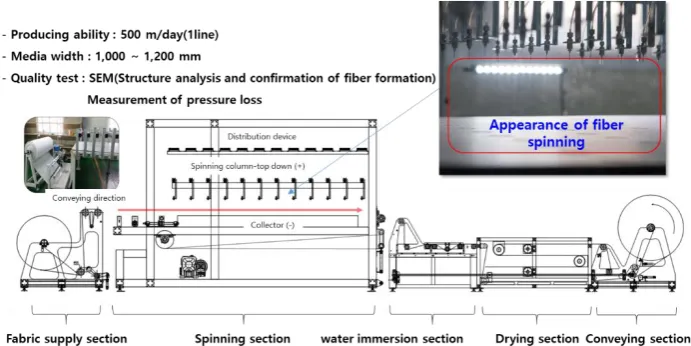
The device for electrospinning was designed by modularizing to be able to cope with changes in test conditions and large area. The detailed device consists of a fabric feeding part, a radiation part, a soaking part, a drying part, and a fabric transfer part, as shown in Figure 1. The radiation device is based on top-down radiation and the radiation column is composed of 12 columns with 10 nozzles per column.
To verify the effect of the electric field generated in the electrospinning, we made it individually controlled. Collector substrate applied (-) voltage is made of stainless steel and the electrospinning is performed by transferring the PES fabric to the upper surface of the substrate or stainless steel substrate.
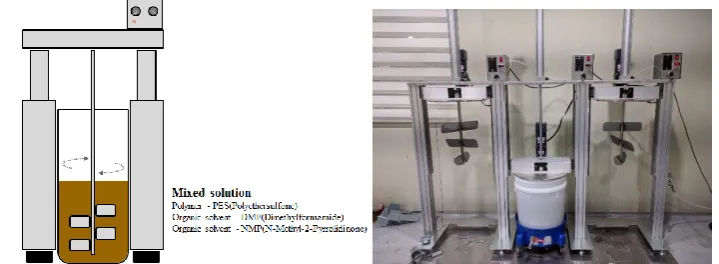
Polyether sulfone (PES), which takes into account physical properties such as tensile strength, elongation, and heat resistance, was used for electrospinning. Dimethylformamide (DMF), N-methyl- Pyrrolidone (N-Methyl-2-pyrrolidinone, NMP) was used at a constant ratio.
Fig. 1.Configuration of electrospinning system.
Experiment of Condition
In this study, we investigated the diameter and pore control of PES nanofibers by focusing on the process parameters such as concentration of polymer solution, applied voltage of spin column, and injection rate of polymer solution among various electrospinning parameters. Polyether sulfon (PES, BASF6020P) was used as a reagent for the test. Dimethylformamide (DMF), N-methyl-2-pyrrolidone -2-pyrrolidinone, NMP) was used for organic solvent.
degree of integration of the nanofiber filter.
The diameter of the nanofibers was measured by analyzing 100 fibers at random using ImageJ an image analysis program, also to check the structural characteristics of the nanofiber filter pores, an automated capillary flow porometer (CFP-1200AEL) was used, the filtration efficiency and the pressure loss characteristics of the filter characteristics were measured through Fractional Efficiency Filter Tester-Neutrailzer type, TSI 3160
Fig. 2.Configuration of agitator and physical composition.
3.
Results of Electrospinning Experiment
Analysis of Nanofiber Diameter by Concentration of PES
Electrospinning was carried out to the mixed polymer solution under the conditions shown in Table 1. Samples with different PES concentrations emitted in the same electrospinning process parameters were analyzed by scanning electron microscope for nanofiber diameter except for the fabric feed rate, the data measured and calculated by Capillary Flow Porometer and the data obtained by Automated Capillary Flow Porometer are shown on Table 2.
Table 1. Condition of Electrospinning for the Effect of PES Concentration
Concentration(wt%) 26, 28, 30
TCD(mm) 175
Applied voltage(kV) 20
Injection rate (cc/min) 0.5
Conveyingspeed(mm/min) 50, 100, 150
Table 2. Results of Capillary Flow Porometer
Concen-tration
(wt%)
Fiber diameter
(nm)
Capillary Flow Porometer Filter characteristic
Quality Factor largest pore
diameter
(㎛)
mean pore diameter
(㎛)
Differential pressure (mmAq)
Filter efficiency
(%)
26 449.60 2.89 1.79 11.95 95.88 0.27
28 626.26 4.58 2.42 8.99 93.57 0.31
30 643.48 6.28 3.11 4.88 60.16 0.19
increases, the density also decreases.
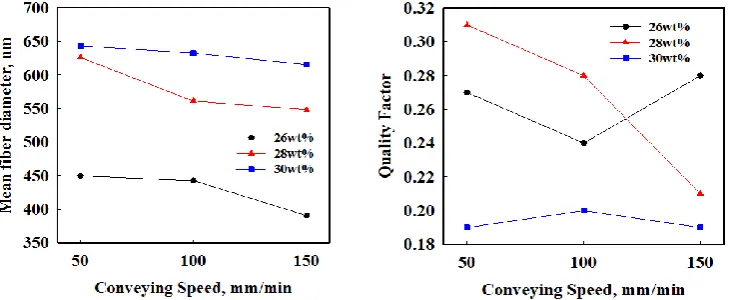
It was also confirmed that the polymer concentration increased from 26 wt% to 30 wt% at the same material transfer rate and the average pore size also increased. In addition, as a result of SEM photograph, shown in Fig. 3, as the concentration of the polymer increases from 26 wt% to 30 wt%, the fiber diameter tends to increase.
The average diameter was measured 449.60 nm at 26wt% of the feed rate of 50 mm / min, and the average diameter was 626.26 nm at 28wt% from the randomly sampling. The average diameter was gradually increased from 30wt% to 643.48 nm in Table 2 and Fig. 4.
Fig. 3.Results of SEM image by concentration of PES.
Fig. 4.Results of diameter change and quality factor by concentration of PES solution.
Analysis of Nanofiber Diameter by Applied Voltage
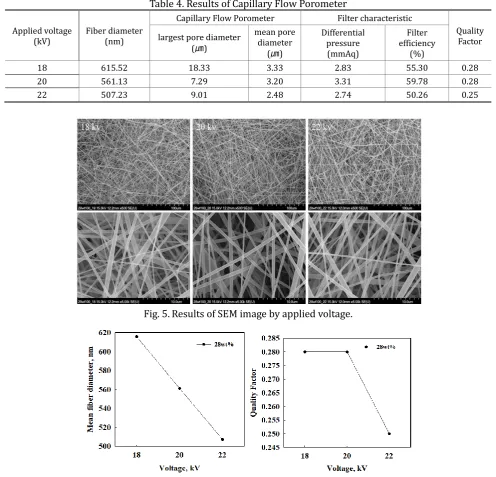
Table 3 shows the conditions of applied voltage for electrospinning. In Table 4 and Fig.. 6, the average diameter of nanofibers tended to decrease linearly at 615.72 nm at 20 kV, 561.13 nm at 20 kV and 507.23 nm at 22 kV as the applied voltage increased from 18 to 22 kV.
Table 3. Condition of Electrospinning for an Applied Voltage
Applied voltage(kV) 18, 20, 22
TCD(mm) 175
Concentration(wt%) 28
Injection rate (cc/min) 0.5
Conveying speed(mm/min) 50, 100, 150
the nanofibers are thick and thin, including beads that are elongated. The diameter deviation between the beads and each fiber gradually decreases as the applied voltage increases. The standard deviation of nanofiber diameter at each applied voltage is 245.84 at 18 kV, 183.52 at 20 kV, 232.43 at 22 kV, and 20.4 kV at 20 kV. It means more evenly emitted, it indicates that the nanofibers are unevenly radiated due to the effect of a strong applied voltage at 22 kV. Therefore, it is judged that the maximum pore diameter at 20 kV generally, uniformly radiated is smaller than the pore diameter at 22 kV.
Table 4. Results of Capillary Flow Porometer
Applied voltage
(kV) Fiber diameter(nm)
Capillary Flow Porometer Filter characteristic
Quality Factor largest pore diameter
(㎛)
mean pore diameter
(㎛)
Differential pressure (mmAq)
Filter efficiency
(%)
18 615.52 18.33 3.33 2.83 55.30 0.28
20 561.13 7.29 3.20 3.31 59.78 0.28
22 507.23 9.01 2.48 2.74 50.26 0.25
Fig. 5.Results of SEM image by applied voltage.
Fig. 6.Relation of diameter change and quality factor by applied voltage.
Analysis of Nanofiber Diameter by Injection rate
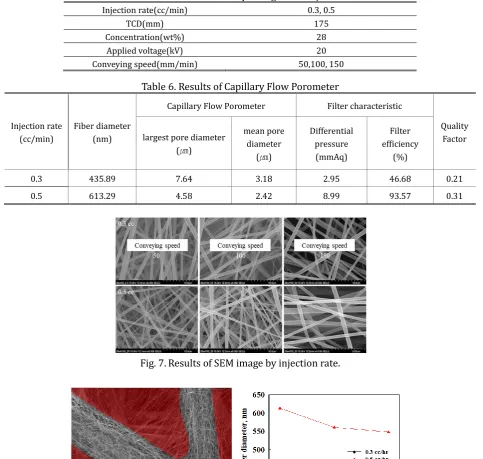
Table 5 shows the conditions of applied injection rate for electrospinning. SEM Analyzed in Fig. 7, the nanofibers were wholly reduced in diameters at feed rates of 50, 100 and 150 when the discharge rate per hour decreased from 0.5 cc to 0.3 cc.
covered. As table 6 shows, The average pore size was increased from 3.20 μm to 4.26 μm by 1.06 μm when the amount of polymer solution was decreased from 0.5 cc / hr to 0.3 cc / hr at the fabric transfer rate ‘100 mm / min.’, the maximum pore diameter increases from 7.29 um to 12.58 um. As the pore diameter increases, the differential pressure decreases as compared with 0.5 cc / hr, and the overall filter filtration efficiency also decreases. In the case of Quality Factor, when the feed rate of the polymer solution was 50 and 100, the injection rate of 0.3 cc / hr was lower than that of 0.5 cc / hr, which is the same as the analyzed in a tendency. As shown in Fig. 9~ Fig. 10, it is believed that this is due to the fact that it is dense to the PES fiber which is the substrate and cannot sufficiently cover the large pores of the fabric.
Table 5. Condition of Electrospinning for an Injection Rate
Injection rate(cc/min) 0.3, 0.5
TCD(mm) 175
Concentration(wt%) 28
Applied voltage(kV) 20
Conveying speed(mm/min) 50,100, 150
Table 6. Results of Capillary Flow Porometer
Injection rate (cc/min)
Fiber diameter (nm)
Capillary Flow Porometer Filter characteristic
Quality Factor largest pore diameter
(㎛)
mean pore diameter
(㎛)
Differential pressure
(mmAq)
Filter efficiency
(%)
0.3 435.89 7.64 3.18 2.95 46.68 0.21
0.5 613.29 4.58 2.42 8.99 93.57 0.31
Fig. 7.Results of SEM image by injection rate.
Fig. 9.Results of quality factor by injection rate and PES Media.
Fig. 10.Results of filter efficiency and differential pressure by PES media.
4.
Conclusion
The results obtained from this study are as follows.
It is related to density of nanofiber web, as the feed rate of fabric increases. The density is also lower, it was also confirmed that the polymer concentration increased from 26 wt% to 30 wt% and the average pore size also increased at the same material transfer rate.
The maximum pore diameter is less than 22 kV at an applied voltage of 20 kV, the standard deviation of nanofiber diameter at each applied voltage means that the fibers radiated at 20 kV from 18 kV to 245.84 nm, 20 kV at 183.52, and 22 kV at 232 kV were more uniformly emitted, it has been proved that the nanofibers are radiated unevenly due to the effect of the strong applied voltage at 22 kV. The average pore size increased 1.06 ㎛ much from at 3.20 ㎛ to 4.26 ㎛, when the feeding rate of the fabric was 100, in the case the amount of the polymer solution was decreased from 0.5 cc / hr to 0.3 cc / hr, it is verified that the maximum pore diameter increased from 7.29 ㎛ to 12.58 ㎛.
Acknowledgment
This research was supported by Particle Matter National Stratagem Program through the National Research Foundation of Korea(NRF) funded by the Ministry of Science and ICT (No. 2017M3D8A1091959)
References
[1] Zhang, S., Li, G., Tian, L., Guo, Q., & Pan, X. (2016). Short-term exposure to air pollution and morbidity of COPD and asthma in East Asian area: A systematic review and meta-analysis. Environ Res., 148, 15-23.
[3] Bell, M. L., Davis, D. L., & Fletcher, T. (2004). A retrospective assessment of mortality from the London smog episode of 1952: the role of influenza and pollution. Environ Health Per., 112, 6-8.
[4] Kwon S. B., Jeong, W., Park, D., Kim, K. T., & Cho, K. H. (2015). A multivariate study for characterizing particulate matter (PM 10, PM 2.5, and PM 1) in Seoul metropolitan subway stations, Korea. J Hazard
Mater., 297, 295-303.
[5] Lee, B. E., Park, H. S., Kim, Y. J., Park, E. A., Hong, Y. C., & Ha, E. H. (2004). Air pollution exposure and health effects in fetus. J PrevMed Public Health, 37, 291-299.
[6] Seaton, A., MacNee, W., Donaldson, K., & Godden, D. (1995). Particulate air pollution and acute health effects. Lancet, 345, 176-178.
[7] Li, M. H., Fan, L. C., Mao, B., Yang, J. W., Choi, A. M., & Cao, W. J. (2016). Short-term exposure to ambient fine particulate matter increases hospitalizations and mortality in COPD: A systematic review and meta-analysis. Chest, 149, 447-458.
[8] Wanka, E. R., Bayerstadler, A., Heumann, C., & Nowak, D. (2014). Weather and air pollutants have an impact on patients with respiratory diseases and breathing difficulties in Munich. Germany Int. J.
Biometeorol, 58, 249-262.
Nam-Su Kwak majored in mechanical engineering in Korea and earned his Ph.D. in 2015 for research on non-contact ultrasonic testing and control technology. His major fields are system design and flow analysis. Recently, He is concentrating on filter pack research to improve the air quality according to the worse air quality in Korea. Especially, he is concentrating on high efficiency and long life enhancement technology by applying nanofiber to develop eco-friendly filter packs. In addition to filtration filters, air purification systems and control technologies for electric dust collection systems are also being studied by him.
Choul-Jun Choi majored in precision mechanical engineering in Korea and earned his Ph.D. in 2018 for optical fiber transmission technology research. He is working at the Korea Electronics Technology Institute and is the head of the Air Appliances Development Team at the Air Products Innovation Support Center. His major fields are system design and structural analysis. Recently, he is studying air purification tower design and control technology for air quality improvement and pollutant reduction in outdoor environment.