Differences in Genetic Structure among Fagus orientalis
Lipsky (Oriental Beech) Populations under Different
Management Conditions: Implications for
in situ Gene Conservation
P. Salehi Shanjani,
1,*G. Giuseppe Vendramin,
2and M. Calagari
11Research Institute of Forests and Rangelands, P. O. BOX 13185-116, Tehran, Islamic Republic of Iran 2Institute of Plant Genetic, CNR, Via Madonna del Piano, I-50019 Sesto Fiorentino, Firenze, Italy
Received: 27 September 2009 / Revised: 7 February 2011 / Accepted: 20 February 2011
Abstract
Resource sustainability requires a thorough understanding of the influence of
forest management programs on the conservation of genetic diversity in tree
populations. To observe how differences in forest management affect the genetic
structure of
Fagus orientalis
Lipsky (oriental beech), we evaluated thirteen beech
sites across Hyrcanian forests, based on six microsatellite loci. Significant
differences between managed (mostly shelter wood system) and unmanaged
populations was revealed. Inbreeding coefficient in managed populations was
higher than unmanaged populations. A low, but significant, differentiation among
all populations was found which reveals a clear geographic structure. Although
the results indicate that the shelter wood system has minimum impact on the
genetic diversity on a short term in oriental beech, but definitely inbreeding can
increase in beech populations under intense management for long periods of time.
According to these results, 4 populations from different part of Hyrcanian forests
are suggested as potential
in situ
conservation sites.
Keywords: Fagus orientalis Lipsky; In situ conservation; Genetic diversity; Hyrcanian forests;
Forest management
* Corresponding author, Tel.: +98(21)44580280, Fax: +98(21)44580223, E-mail: [email protected]
1 The watershed of the Elborz on the Caspian coast is characterized by mesophilous forest vegetation, originating from the Tertiary,
therefore being very ancient. Beech in this zone survived intense climate and geological changes during the Quaternary because the populations lived in this area not reached by ice periods; only they have been influenced indirectly from glacial. From the point of view of its floristic composition, the beech belt is linked with European forests. This level particularly has some affinities with the beech forests of Balkans. The lower levels, on the contrary, are much more specific and include subtropical elements.
Introduction
Fagus orientalis Lipsky (oriental beech) is a widespread monoecious and wind-pollinated tree
species. The Iranian beech forests as part of the Hyrcanian forests are located on the northern slopes of Elborz Mountains1, within an altitude of about 600-2000
700 km length that is located in 3 provinces of Guilan, Mazandaran and Golestan. Pure and mixed beech (F. orientalis) forests are the most important elements of this ecosystem, making up the richest and the most beautiful forests of Iran. Beech forests represent about 18 % of Hyrcanian forests surface and form about 30 % of forest trees volume in Iran. Therefore, from the economic point of view, beech forests are the most valuable populations in Caspian zone and allocate the most rate of timber production in Iran. Hyrcanian commercial forests in Iran were nationalized in 1963. Since then, the area has declined significantly from 3.4 to less than 1.3 million ha in 1998. Beech forests in Iran are considered as even-aged forests and managed mostly by shelter wood silvicultural system.1 Most of
the beech dominated forests suffer from human interference and are continuously decreasing in area. Unsuitable harvesting methods during last 45 years and lack of forest protection are the two main technical reasons for failure of the shelterwood system in these forests [18].
A fundamental requirement for improved forest management is an understanding of the dynamics of genetic variation within and among tree populations. The gene pools of natural populations are not static, but constantly changing through the interactions of site characteristics (e.g., density, age structure, and dispersal distance) with the forces of evolution (mutation, mating system, gene flow, genetic drift, and natural selection). Forest management practices can alter these interactions and hence alter the partitioning of genetic variation within populations. Therefore, characterization of the changes in genetic diversity that result from forest management is essential for sustaining forest resources [28]. While easily measured phenotypes such as stem form, crown mass, and diameter growth are often used to evaluate the successful management of the quality of crop trees, effects at the genetic level have largely been ignored and are rarely incorporated into forest management programs [10].
Knowledge of genetic variation in the species is necessary if genetically well-adapted seed sources of Hyrcanian oriental beech are to be identified and used to establish populations. This type of information is also required to make sound decisions on how to protect the genetic diversity of the species and ensure sustainable forest management [20, 26, 31]. The conservation and
1Even-aged silvicultural system in which a new stand is
established under the protection of a partial canopy of trees. The mature stand is generally removed in a series of two or more cuts, the last of which is when the new even-aged stand is well developed.
protection of this tree species is most promising in situ, within the frame of forestry management, with the aim of combining gene conservation efforts and the production of high quality timber.
A new type of in situ gene conservation programs is developing the Gene Management Unit (GMU) concept, allowing evolutionary processes to take place in populations of plant and animal species while protecting genetic resources of important tree species as well as wild relatives of species. The selection of the GMU sites should be based on some knowledge of past and present human influence, mating conditions, and the size of minimum viable population; and of adaptively homogenous areas. Selected locations for GMU should adequately represent the spatial genetic and ecological variation pattern of the species, but the consideration of adaptive variation pattern should have priority. Knowledge of within-species genetic patterns arising from within-species gene flow and genetic adaptation is therefore essential for the decision on in situ gene conservation units [30].
Information on crucial life-history characteristics of forest tree species (e.g. mating system, pollen and seed dispersal) and their patterns of genetic variation is still lacking. In this context, the application of molecular genetic techniques to the conservation of forest tree species is anticipated to bring valuable data that could be used to extract relevant biological information, to document hotspots of genetic diversity, and to infer their phylogeography [36]. Salehi Shanjani et al. [39] used isozymes to study genetic diversity and differentiation beech populations in Hyrcanian forests. Like in European beech and many other trees species [3-7,13,15,16,22,27,29,32,33] high levels of diversity at isozyme loci and typically low population differentiation were observed. The lack of sufficient isozyme polymorphism among different populations limited their use. Molecular methods, at the DNA level, are now increasingly being used to study genetic diversity. One of the most reliable molecular marker systems is mircrosatellites, or simple sequence repeats (SSRs) which are abundant and well distributed throughout the nuclear genomes of eukaryotes. These are mostly present in non-coding DNA, which can accumulate mutations more rapidly than the coding DNA. SSRs can be used effectively to determine the magnitude and pattern of genetic variation in forest tree populations due to their high levels of polymorphism, high degree of reliability and reproducibility, and co-dominant mode of inheritance, and be a useful tool for quick decision making process in conservation of genetic resources in situ [45].
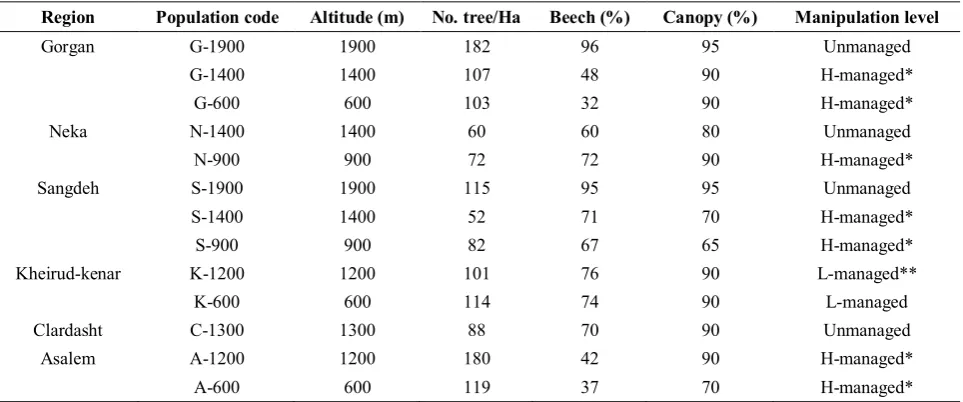
Table 1. Site characteristics of the studied beech populations
Region Population code Altitude (m) No. tree/Ha Beech (%) Canopy (%) Manipulation level
Gorgan G-1900 1900 182 96 95 Unmanaged
G-1400 1400 107 48 90 H-managed*
G-600 600 103 32 90 H-managed*
Neka N-1400 1400 60 60 80 Unmanaged
N-900 900 72 72 90 H-managed*
Sangdeh S-1900 1900 115 95 95 Unmanaged
S-1400 1400 52 71 70 H-managed*
S-900 900 82 67 65 H-managed*
Kheirud-kenar K-1200 1200 101 76 90 L-managed**
K-600 600 114 74 90 L-managed
Clardasht C-1300 1300 88 70 90 Unmanaged
Asalem A-1200 1200 180 42 90 H-managed*
A-600 600 119 37 70 H-managed*
*: High management density, under shelterwood system **: limited management, by improvement or release cutting
Table 2. Characteristics of the 6 polymorphic nuclear microsatellite markers used to analyse genetic diversity in the Iranian beech populations
Microsatellite locus Repeat Observed allele size range (bp) Observed number of alleles Annealing temp. (°C)
FS1-15 (GA)26 69-131 26 60
FS1-03 (GA)18 68-120 18 60
FS1-11 (GA)15 92-126 17 63
FS3-04 (GCT)5(GTT)3(GCT)6 192-207 6 60
FS4-46 (TGA)23 170-311 41 60
FCM5 (AG)10 260-346 36 60
situ conservation sites in Hyrcanian forests, a few oriental beech populations covering a large part of the distribution range of F. orientalis in North of Iran were selected. This study aimed mainly to assess the general pattern of genetic variability of Hyrcanian beech forests at tree different geographical scales (among individuals within populations, among populations within natural regions, and between the regions). The implications of the results of this study for in situ conservation of genetic resources of Hyrcanian beech forests as Gene Management Units are also discussed. Additionally, the data were used for describing the impact of forest management on genetic diversity in oriental beech.
Materials and Methods
DNA from bud material was extracted using a DNeasy Plant mini Kit (Qiagen). All trees were genotyped using six primer pairs of microsatellite loci (FS1-15, FS1-03, FS1-11, FS3-04, FS4-46 and FCM5) described in Pastorelli et al. [37]. All six SSR primers were approved to be of mendelian inheritance among crosses of F. sylvatica [37] and mapped to different linkage groups [41]. PCR process was performed following Pastorelli et al. [37]. PCR products were electrophoresed and visualized using an Amersham ALF Express automatic sequencer.
Data Analysis
Data of all individuals were scored as a co-dominant marker and the following statistics of genetic variation within populations were computed as averages over loci using the GENAlEX 6 software [38]: mean number of alleles per locus (Na), effective number of alleles (Ne), number of rare alleles (Nr), the observed heterozygosity (Ho), expected heterozygosity (He) computed according to Nei’s 1978 coefficient [35]. An estimator of Wright's Fst was calculated to assess population differentiation. Gene flow rate was estimated indirectly from the proportion of the total diversity found among populations (Fst, 47, 48). Wright’s fixation index (Fis), averaged over all loci, was calculated and deviation from Hardy-Weinberg expectations were determined using GENEPOP 3.3. A paired t-test was performed to test for differences between the genetic diversity estimates in the populations with different management levels. Genetic distances were estimated according to Nei’s 1978 coffeicient [35] and Neighbor-Joining (NJ) analysis were performed [14]. The NJ dendrogram was constructed with the MEGA 4 software [44]. To examine the relationship between the genetic distance and the geographic distance a Mantel test on the matrix of Fst values and that of the geographic distances was performed (1000 permutations) using GENEPOP 3.3. The results of the analysis were visualized by plotting the Fst values against the distances. A simulated annealing procedure implemented in the SAMOVA algorithm [8] was used to define groups of populations that are geographically homogeneous and maximally differentiated from each other. The program iteratively seeks the composition of a user-defined number K of groups of geographically adjacent populations that maximizes FCT, the proportion of total genetic variance
due to differences among groups of populations. The program was run for 10000 iterations for Ke {2, . . ., 8} from each of 500 random initial conditions. For each K, the configuration with the largest FCT values after the 500 independent simulated annealing processes was
retained as the best grouping of populations.
Results
Genetic Diversity
A total of 144 alleles were detected ranging from 6 to 41 alleles, with an average of 24 alleles per locus (Table 2). The oriental beech forests in Hyrcanian zone are genetically diverse. All six microsatellite loci analyzed in this study were highly polymorphic, displaying a high number of alleles and a wide range of PCR products. Heterogeneity (p<0.01) in allele frequencies among the populations detected at all loci. Table 3 describes the polymorphism of studied samples. Most loci in all regions showed significant deviations from expected Hardy-Weinberg frequencies. In most populations there were more homozygous genotypes than expected. Two exceptional populations N-1400 and S-1900, both unmanaged, showed more heterozygosity than the amount expected (Table 3). Mean number of alleles per locus varied between 7.67 in G-1900 population to 11.67 in S-1900 and S-900 populations. Across all the loci examined 20 specific alleles (which occurred at low frequencies) were observed, distributed in 11 out of 13 populations. The overall allelic richness for Gorgan region was considerably lowest than others. Due to different manipulation levels, significant difference in average number of alleles per locus appeared within regions. There is no clear trend for differences in the diversity measures between the managed and unmanaged populations within a region, even between different altitudes (Table 3). Differences in heterozygosity within a region were considerable and significant. Observed heterozygosity was the highest (0.72) in N-1400 (unmanaged) and the lowest (0.48) in A-600 (managed under shelterwood system) populations. The expected heterozygosites ranged between 0.58 (in G-1400, managed population) and 0.72 (in C-1300, unmanaged, and K-1200, limited-managed populations). Mean heterozygoshty for all populations was 0.61 observed and 0.67 for expected. The observed heterozygosity was slightly lower than the expected heterozygosity (He), causing a low but significantly positive, mean inbreeding coefficient (Fis=0.061). The mean Fis was low, indicating that within population structure (inbreeding) was not significant. However some loci showed high values of Fis, indicating deficiency or excess of heterozygotes. Effective number of alleles,ne, ranged between 3.29 (in G-1400, managed
showed significant differences between the populations with different management levels.
Genetic Differentiation
The overall Fst was low (0.058), but differed significantly from zero (P<0.001), meaning that 5.8% of
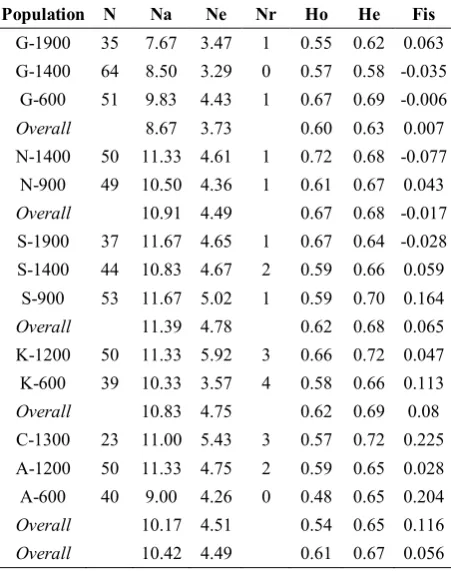
Table 3. Genetic variability at six microsatellite loci in 13 beech populations. sample size (N), mean number of alleles per locus (Na); effective number of alleles (Ne); observed (Ho) and expected (He) heterozygosities and fixation index (Fis)
Population N Na Ne Nr Ho He Fis G-1900 35 7.67 3.47 1 0.55 0.62 0.063 G-1400 64 8.50 3.29 0 0.57 0.58 -0.035
G-600 51 9.83 4.43 1 0.67 0.69 -0.006
Overall 8.67 3.73 0.60 0.63 0.007 N-1400 50 11.33 4.61 1 0.72 0.68 -0.077
N-900 49 10.50 4.36 1 0.61 0.67 0.043
Overall 10.91 4.49 0.67 0.68 -0.017 S-1900 37 11.67 4.65 1 0.67 0.64 -0.028 S-1400 44 10.83 4.67 2 0.59 0.66 0.059
S-900 53 11.67 5.02 1 0.59 0.70 0.164
Overall 11.39 4.78 0.62 0.68 0.065 K-1200 50 11.33 5.92 3 0.66 0.72 0.047 K-600 39 10.33 3.57 4 0.58 0.66 0.113
Overall 10.83 4.75 0.62 0.69 0.08 C-1300 23 11.00 5.43 3 0.57 0.72 0.225 A-1200 50 11.33 4.75 2 0.59 0.65 0.028 A-600 40 9.00 4.26 0 0.48 0.65 0.204
Overall 10.17 4.51 0.54 0.65 0.116
Overall 10.42 4.49 0.61 0.67 0.056
Table 4. F-statistics and gene flow values among beech populations using six microsatelites
Reigon N Fis Fit Fst Nm
1) Among all
populations 13 0.060 0.115 0.058 4.060 2) Pair-wise per
region
Gorgan 3 0.006 0.048 0.041 5.840 Neka 2 -0.016 -0.001 0.015 16.540 Sangdeh 3 0.062 0.080 0.018 13.522 Kheirud-kenar 2 0.082 0.103 0.025 9.764 Asalem 2 0.117 0.124 0.010 24.468
total variation were among populations (Table 2). Also pair-wise comparisons of the populations within a region revealed very low Fst-values (P<0.001). The Asalem populations showed the lowest differentiation (Fst = 0.10) while the Gorgan populations were most divergent (Fst = 0.041) (Table 4).
For the description of the differentiation pattern, the genetic distances between populations were calculated using Nei´s unbiased estimator. The NJ phenogram was constructed using Nei's genetic distance (Fig. 2). The NJ tree had long terminal branches, which suggested that the populations were well differentiated, and that the relationships among the regions were well resolved. The branching order and the grouping of populations (clades) were consistent and supported the phenetic analysis. In clusteing analysis, two main branches were observed. The first main branch covered the regions Asalem, Clardasht and one population of Kheirud-kenar. The second main branch covered the regions Gorgan, Neka, Sangdeh and one population of Kheirud-Kenar. Gorgan-1900 population was the most genetically distant from all other populations and is significantly differentiated.
The genetic divergence between the 13 populations is a function of the geographic distance. A positive and significant correlation coefficient was calculated between the pair-wise Fst values and the geographic distances (R2 = 0.52, P = 0.0003, Mantel test).
SAMOVA results also revealed a clear geographic pattern of the diversity among the analysed populations. Fct values increased progressively as K was increased, reaching a plateau (Fct = 10%) at k ≈ 4, with the Asalem and Clardasht and G-1900 populations sig-nificantly separated from the other populations (Fig. 3).
Discussion
Inbreeding
24). Also other wind-pollinated, broad-leaved tree species, including other Fagus species showed heterozygote deficiencies such as F. crenata (average Fis = 0.095, 1),
Fraxinus
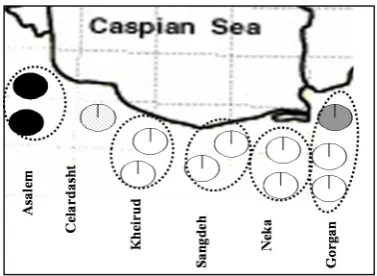
excelsior (significant Fis = 0.014; 17, Fis = 0.292; 34), oak (Fis = 0.07; 42). MostFigure 1. Distribution of studied regions.
Figure 2. Dendrogram of different populations produced by the neighbour-joining clustering method.
Figure 3. Group structure of the 13 beech populations defined by SAMOVA (samples with the same patterns
belong to the same group).
authors explain positive inbreeding coefficients in beech as a result of a non-random microspatial structure probably due to mating in close neighborhood [5, 7, 32, 46]. Also more recently, Vornam et al. [45], who studied the spatial distribution of genetic diversity in a naturally regenerated beech population with microsatellites detected high Fis values and found a strong family structure up to 30 m.
In most cases, Fis values were highest in intensively managed populations within a region, suggesting that human interference or management increase inbreeding levels. This is because, for wind-pollinated species, a low density population of mature trees is expected to increase the spatial genetic structure of the population by increasing the probability of pollination by spatially proximal relatives [11]. Likewise, inbreeding should be limited in a high density forest because the pollen cloud for a tree in a dense population would contain a relatively small proportion of its own pollen; therefore, most seeds would be a product of outcrossing [9, 12, 21]. Clearly, inbreeding can increase in oriental beech populations under intense management for long periods of time.
Genetic Differentiation between Beech Populations Microsatellites showed that most of the genetic diversity was attributed within the populations and that there was little, but significant differentiation between the populations (Fst = 0.058). This pattern of variation is thought to be the consequence of the dominant life history characteristics of forest trees, i.e. long life span, allogamy, wind-pollination, their continuous distri-bution and monoecy, and also may be with a high rate of gene flow (15). This low differentiation is in concordance with Fst values reported with isozymes in Hyrcanian beech forests (Fst = 0.034, 39), and with SSRs (Fst = 0.058, 2) and isozymes (Fst = 0.03–0.07, 3), which have been performed with many European beech populations over a wide range of the species distribution. Moreover, despite the low genetic differentiation among the populations, a clear geographical pattern was observed.
Cluster analysis (dendrogram) based on Nei’s 1978 genetic distance also showed that all populations were separated according to their location in eastern or western part of Hyrcanian forests. Considerable amount of gene flow between the populations of each cluster probably occurs considering the topography of the area, prevailing wind direction and physical distance between these populations. In the first cluster the G-1900 population was the most distantly clustered one compared to other populations of eastern part. These
Sangdeh-1900 Sangdeh-1400 Gorgan-600 Neka-1400 Kheirud-600 Neka-900 Sangdeh-900 Gorgan-1400 Gorgan-1900 Kheirud-1200 Clardasht-1300 Asalem-1200 Asalem-600
findings are not surprising since G-1900 population occurs in extreme habitats (e.g., high elevation, shallow soil), at the eastern edge of the species range in Hyrcanian forests. On the other hand, S-900 and N-900, which are in the same cluster, suffered from sever management practices. The only exception is K-600, which we expected to group in the second cluster close to K-1200. In second cluster, K-1200 was clearly separated from the other three populations. A-600 and A-1200 were the most closely related ones.
The SAMOVA analysis showed that the eastern populations are more similar to each other and are distinct from the central and western populations. This division is most obviously a result from historical migration of the species in Hyrcainan forests, which is from West to East [40].
Effect of Forest Management on Beech Populations In this study, the potential effects of forest management on beech populations were examined. Natural beech populations were used as a reference for comparison of genetic diversity in populations which undergone a forest management treatment. The pair-wise comparison revealed no differences in genetic diversity measures among the populations with different management history and therefore it can be concluded that the management practiced in these populations did not influence the level of genetic diversity at the genetic markers used. Other studies in European beech aimed at studying the effect of management on the genetic diversity did not find also an effect ([2], suggesting the shelterwood system has no or minimum impact on genetic diversity in European beech. Furthermore, they observed Linkage disequilibrium for some loci pairs in their study, but no more in the managed populations than in the limited populations within a region. Hussendörfer and Konnert [19] compared isozyme data of 112 managed and 13 natural, unmanaged beech forests located in South Germany, but did not find significant differences in genetic diversity parameters. Two other studies focused on the effect of forest management, such as thinning [25] and diameter oriented selection felling [22] on the diversity: also in these cases no biological significant differences were detected. On the other hand, a study in a related beech species (F. crenata Blume) showed that forest cutting decreased the genetic variability and increased the genetic clustering in the population [43]. Furthermore, they observed significant linkage disequilibrium in the population with a cutting history, but none in the primary population. The effects of forest cutting were explained by the limited number of reproductive trees
that were left after cutting and consequently reduced mixing of the progenies.
Finally, it can be concluded from our results that the shelter wood system is adequate to avoid changes of the genetic composition on a short-term in oriental beech. It is likely that this type of management has minimum impact on the diversity in beech, at least for the genetic markers used, because the management mimics natural regeneration processes. However our results clearly showed that inbreeding can increase in oriental beech populations under intense management for long periods of time. Only with an increased understanding of the changes that occur as a result of forest management will it be possible to conserve genetic diversity in tree populations - a crucial step for sustainable resource management.
Geographic Diversity and in Situ Gene Conservation Protection of all studied beech populations in the Hyrcainan forests may not be economically feasible. The number and size of Gene Management Unit (GMU) as an in situ reserve could not be determined by the genetic data presented here alone since there will be other biological, economical and administrative issues which should be considered during decision making. However based on present genetic data, we could point out some potential populations as GMU sites along with distribution range of beech forests to help forest managers and conservation biologists in their decision making.
We applied SAMOVA for our data, which defined 4 groups of populations in Hyrcanian zone that are geographically homogeneous and maximally differentiated from each other (Fig. 3). The SAMOVA approach also suggests the different groups in very close populations, e.g. populations from different elevation of region Gorgan or two populations in two sides of a valley (populations Kelardasht and Kheirud-kenar). To explain it, the presence of a very efficient barrier to gene flow, this would have prevented short-range migrations between populations from these regions.
higher heterozygosity) originated from different lineages can be considered as in situ reserves. K-1200 and C-1300 populations in middle of distribution range of beech in Hyrcanian forests have rare alleles and the highest heterozygosity and originated from different lineages could be taken into consideration for in situ conservation.
However, for the final decision on Gene Management Unit selection in beech forests as in situ reserve, genetic diversity of a species is not the unique criterion. Other factors such as presence of other economically important species and degree of biological diversity in the site, accessibility and suitability of the area for in situ preservation and protection should be also taken into consideration.
Acknowledgment
This project was supported by the International Plant Genetic Resource Institute, Bioversity International, formerly IPGRI (project D06C Fellowships). Parvin Salehi Shanjani received Vavilov-Frankle Fellowshio (2003) from Bioversity International, formerly IPGRI.
References
1. Asuka Y., Tomaru N., Nisimura N., Tsumura U., and Yamamoto S. Heterogeneous genetic structure in a Fagus crenata population in an old-growth beech forest revealed by microsatellite markers. Mol. Ecol., 13: 1241–1250 (2004).
2. Buiteveld J., Vendramin G.G., Leonardi S., Kamer K., and Geburek, T. Genetic diversity and differentiation in European beech (Fagus sylvatica L.) stands varying in management history. For. Ecol. Manag., 247: 98-106 (2007).
3. Comps B., Gömöry D., Letouzey J., Thie´baut B., and Petit R.J. Diverging trends between heterozygosity and allelic richness during postglacial colonization in the European beech. Genetics, 157: 389–397 (2001).
4. Comps B., Ma´tya´s C., Letouzey J., and Geburek T. Genetic variation in beech populations (Fagus sylvatica L.) along the alpine chain and in the Hungarian basin. For. Genet., 5 (1): 1–9 (1998).
5. Comps B., Thie´baut B., Paule L., Merzeau D., and Letouzey J. Allozymic variability in beech woods (Fagus sylvatica L.) over Central Europe: spatial differentiation among and within populations. Heredity, 65: 407–417 (1990).
6. Comps B., Thiebaut B., Sugar I., Trinajstic I., and Plazibat M. Genetic variation of the Croatian beech stands (Fagus sylvatica L.): spatial differentiation in connection with the environment. Ann. For. Sci., 48: 15–28 (1991).
7. Cuguen J., Merzeau D., and Thiebaut B. Genetic structure of the European beech stands (Fagus sylvatica L.): F-statistics and importance of the mating system characteristics in their evolution. Heredity, 60: 91–100
(1988).
8. Dupanloup I., Schneider S., and Excoffier L. A simulated annealing approach to define genetic structure of populations. Mol. Ecol.,11: 2571– 2581 (2002).
9. El-Kassaby Y.A., Dunsworth B.G., and Krakowski J. Genetic evaluation of alternative silvicultural systems in coastal montane forests: western hemlock and amabilis fir.
Theor. Appl. Genet.,107: 598–610 (2003).
10. Ennos R.A., Worrell R., and Malcolm D.C., The genetic management of native species in Scotland. Forestry, 71: 1-23 (1998).
11. Epperson B.K. Geographical Genetics. Princeton University Press, Princeton, N.J., 230 p. (2003).
12. Farris M.A., and Mitton J.B. Population density, outcrossing rate, and heterozygote superiority in ponderosa pine. Evolution, 38: 1151-1154 (1984).
13. Gömöry D., Vyšny` J., Comps B., and Thiebaut B. Geographical patterns of genetic differentiation and diversity in European beech (Fagus sylvatica L.) populations in France. Biológia (Bratislava), 47: 571–579 (1992).
14. Gower J.C. Some distance properties of latent root and wector methods used in multivariate analysis. Biometrika, 53: 325-338 (1966).
15. Hamrick J.L., Godt M.J.W., and Sherman-Broyles S.L. Factors influencing levels of genetic diversity in woody plant species. New Forestry, 6, 95–124 (1992).
16. Hazler K., Comps B., Sugar I., Melovski L.J., Tashev A., and Gračan J. Genetic structure of Fagus sylvatica L. populations in Southeastern Europe. Silvae Genetica, 46(4): 229–236 (1997).
17. Heuertz M., Hausman J.-F., Tsvetkov I., Frascaria-Lacoste N., and Vekemans X. Assessment of genetic structure within and among Bulgarian populations of the common ash (Fraxinus excelsior L.). Mol. Ecol., 10: 1615–1623 (2001).
18. Hosseini S., Madjnonian B., and Nieuwenhuis M. Damage to natural regeneration in the Hyrcanian forests in Iran: a comparison of two typical timber extraction operations. J. For. Eng., 11: 69-73 (2000).
19. Hussendörfer E., and Konnert M. Untersuchungen zur Bewirtschaftung von Weisstannen- und Buchenbeständen unter dem Aspekt der Erhaltung genetischer Variation.
For. Snow Landsc. Res., 75(1.2): 187–204 (2000). 20. Kaya Z., Kün E., and Güner A. National plan for in situ
conservation of plant genetic diversity in Turky. Milli Eğitim Basimevi, İstanbul, 123 p. (1997).
21. Knowles P., Fumier G.R., Aleksiuk M.A., and Perry D.J. Significant levels of self-fertilization in natural populations of tamarack. Canadian J. Bot., 65: 1087-1091 (1987).
22. Konnert M., and Spiecker H. Beeinflussen Nutzungen einzelner Bäume die genetische Struktur von Beständen?
AFZ-Der Wald, 51(23): 1284–1291 (1996).
23. Konnert M., Ziehe M., Tröber U., Maurer W., Janssen A., Sander T., Hussendörfer E., and Hertel H. Genetic variation of beech (Fagus sylvatica L.) in Germany: joint evaluation of genetic inventories from several federal states. For. Holz., 13: 403–408 (2000).
Res., 11: 220–232 (1996).
25. Lauber von U., Rotach, P., and Hussendörfer, E. Auswirkungen waldbaulicher Eingriffe auf die genetische Structur eines Buchen-Jungbestandes (Fagus sylvatica L.).
Schweiz Forstwes., 148(11): 847–862 (1997).
26. Ledig T.F. Genetic variation in Pinus. In: Richardson D.M. (Ed.), Ecology and biogeography of Pinus. Cambridge University Press, New York, pp. 251-280 (1998).
27. Leonardi S., and Menozzi P. Genetic variability of Fagus sylvatica L. in Italy: the role of postglacial recolonisation.
Heredity, 75: 35–44. (1995).
28. Lindenmayer D., and Franklin J. Transitions to ecological sustainability in forests - a synthesis. In: Lindenmayer D.B., and Franklin J.F. (Eds.), Towards forest sustainability. Island Press, Washington, D.C., pp. 205-213 (2003).
29. Magri D., Vendramin G.G., Comps B., Dupanloup I., Geburek T., Gömöry D., Latalowa M., Litt T., Paule L., Roure J.M., Tantau I., van der Knaap W.O., Petit R.J., and de Beaulieu J.-L. A new scenario for the Quaternary history of European beech populations: palaeobotanical evidence and genetic consequences. New Phytologist, 171: 199–221 (2006).
30. Mátyás C.S. Population, conservation and ecological genetics. In: Burley J., Evans J., Youngquist J. (Eds.),
Encyclopedia of Forest Sciences. Elsevier Major Reference Works, Oxford., 240 p. (2004).
31. Meffe G.K., and Carroll C.R. Principels of conservation Biology. Sinauer Associates, Inc. Sunderland, Massachusetts, 600 pp. (1994).
32. Merzeau D., Comps B., Thiebaut B., Cuguen J., and Letouzey J. Genetic structure of natural stands of Fagus sylvatica L. (beech). Heredity, 72: 269–277 (1994a). 33. Merzeau D., Comps B., Thiebaut B., and Letouzey J.
Estimation of Fagus sylvatica L. mating system parameters in natural populations. Ann. For. Sci., 51: 163– 173 (1994b).
34. Morand M.-E., Brachet S., Rossignol P., Dufour J., and Frascaria-Lacoste N. A generalized heterozygote deficiency assessed with microsatellites in French common ash populations. Mol. Ecol.,11: 377–385 (2002). 35. Nei M. Estimation of average heterozygosity and genetic
distance from a small number of individuals. Genetics, 89: 583-590 (1978).
36. Newton A.C., Allnutt T.R., and Gillies A.M. Molecular phylogeography, intraspecific variation and the conservation of tree species. Trends Ecol. Evol., 14:
140-145 (1999).
37. Pastorelli R., Smulders M.J.M., Van’T Westender W.P.C., Vosman B., Giannini R., Vettori C., and Vendramin G.G. Characterization of microsatellite markers in Fagua sylvatica L. and Fagus orientalis Lipsky. Mol. Ecol. Notes,3: 76-78 (2003).
38. Peakal R., and Smouse P.E. GenAlEx 6: genetic analysis in Excel. Population genetic software for teaching and research. Mol. Ecol. Notes,6: 288–295 (2006).
39. Salehi Shanjani P., Paule L., Khavari-Nejad R.A., Gömöry
D., Sagheb-Talebi K. Allozymic variability in beech (Fagus orientalis Lipsky) forests over Hyrcanian zone.
For. Genet.,9(4): 297-297 (2002).
40. Salehi Shanjani P., Vettori C., Giannini R., and Khavari-Nejad R.A. Intraspecific variation and geographic patterns of Fagus orientalis Lipsky chloroplast DNA. J. Silveae Genetica,53 193-197 (2004).
41. Scalfi, M., Troggio, M., Piovani, P., Leonardi, S., Magnaschi, G., Vendramin, Menozzi, P. 2004. A RAPD, AFLP and SSR linkage map, and QTL analysis in European beech (Fagus sylvatica L.). Theoretical Applied Genetics 108, 433–441.
42. Streiff R., Labbe T., Bacilieri R., Steinkellner H., Glössl J., Kremer A. Within-population genetic structure in
Quercus robur L. and Quercus petraea (Mattl) Liebl. assessed with isozymes and microsatellites. Mol. Ecol.,7: 317–328. (1998).
43. Takahashi M., Mukouda M., and Koono K. Differences in genetic structure between two Japanese beech (Fagus crenata Blume) stands. Heredity, 84: 103–115 (2000). 44. Tamura K., Dudley J., Nei M., Kumar S. MEGA4:
Molecular Evolutionary Genetics Analysis (MEGA) software version 4.0. Mol. Biol. Evol., 24; 1596-1599 (2007).
45. Vendramin G.G., Scotti I., Ziegenhagen B. Microsatellites in forest trees: characteristics, identification and applications. In: Kumar S., and Fladung M. (Eds.),
Molecular Genetics and Breeding of Forest Trees. The Haworth Press, Inc. Bringhamton, NY, USA, pp. 359-386 (2004).
46. Vornam B., Decarli N., Gailing O. Spatial distribution of genetic variation in a natural beech stand (Fagus sylvatica
L.) based on microsatellite markers. Conserv. Genet., 5: 561-570 (2004).
47. Wright S. Evolution in mendelian populations. Genetics, 16: 97-159 (1931).