Semnan University
Journal of Heat and Mass Transfer Research
Journal homepage: http://jhmtr.journals.semnan.ac.ir
Numerical Investigation of Roofing Materials Effect on Solar
Heat Gain in Different External Conditions
Milad Mahmoodzadeh
a, Rouhollah Fatehi
b,c *a Department of Mechanical Engineering, University of Victoria, Victoria, BC, Canada
b Department of Mechanical Engineering, School of Engineering, Persian Gulf University, Bushehr 75169, Iran. c Oil and Gas Research Center, Persian Gulf University, Bushehr 75169, Iran.
P A P E R I N F O A B S T R A C T
Paper history:
Received: 2017-01-20 Received: 2018-09-03 Accepted: 2018-09-08
In this study, the thermal performance of three kinds of roofs with different heat capacity and thermal conductivity under different external conditions has been investigated using a numerical method. For this purpose, the combined solar radiation, conduction and convection heat transfer were calculated implicitly in terms of a one-dimensional finite difference method. Different high and low solar radiation conditions in two common climates in the Middle East, including hot-humid and hot-dry, were considered. The effect of roofing materials was investigated in terms of their thermal storage and overall heat transfer coefficient. Moreover, the time lags and decrement factors were evaluated to compare the performance of the roof. The numerical model has been validated using EnergyPlus. The results indicate that the roof with high thermal storage and low thermal conductivity has better performance in comparison to others. However, the total heat gains are not linearly proportional to the overall heat transfer coefficients, e.g. here, the ratios of a total loadof roof 1 to roofs 2 and 3 are about 12 percent lower than the ratio of overall heat transfer coefficients. Furthermore, the solar radiation intensity had considerable effects on time lags. Finally, it can be concluded that the external conditions have no significant effect on the decrement factor.
DOI: 10.22075/jhmtr.2018.3059.1143
Keywords:
Roofing materials; Thermal storage; Heat gain; Cooling load; Time lags.
© 2019 Published by Semnan University Press. All rights reserved.
1.
Introduction
Today, buildings are one of the major consumers of energy and make up a considerable portion in the generation of greenhouse gases. Approximately 25-30 percent of the world’s energy is consumed in buildings. Nearly 80 percent of this energy is utilized for cooling and heating the space in commercial and residential buildings [1]. The amount of energy used by air conditioning systems depends on the buildings location and the climatic conditions. Therefore, in order to reduce energy consumption and the cost of energy, energy efficiency in buildings should be improved by enhancing the building construction systems and using new technologies [2].
According to the IEA (International Energy Agency), more than half of total electricity and one-third of natural
*Corresponding Author: R. Fatehi, Department of Mechanical Engineering, School of Engineering, Persian Gulf University, Bushehr 75169, Iran.
Email: [email protected].
means that for different climate zones, different designs should be considered. The suitable design would help to create comfortable conditions and also helps to decrease energy for cooling and heating the spaces [5].
Furthermore, there are many effective design parameters which should be considered to have an appropriate indoor condition and better energy consumption in buildings. These factors are the site and the building situation and form, the distance between buildings, and the physical properties of materials used in the building envelope. Among these parameters, the building elements such as walls and roofs, which are exposed to external conditions, are the most important factors [3].
In recent years, analysis of thermal properties of building elements for studying their thermal performance has become more common. Investigations in this field, on the one hand, would help to decrease the energy consumption in buildings by choosing components with more appropriate thermal properties. On the other hand, they help to reduce the size of air conditioning systems while comfortable indoor temperatures are provided for residents [6]. As a building element, the roof is influenced mostly by external climatological parameters and approximately half of the cooling load of a one- or two-story building is received through the roof in arid areas [7]. Also, roofs had a major portion of total heat gain in Indian concrete buildings during the tropical summer, which ranged from 40 % to 75 % [8].
On the other hand, the roof is considered as one of the most important parts of the buildings when the passive strategy is considered for buildings. For instance, shading the roof, increasing the roof thickness and surface reflectivity, optimizing the thermal insulation thickness, using vegetated roofs and roof ponds are the main passive strategies to reduce the energy consumption in buildings [9]. Daouas [10] in his study analyzed the influence of external long-wave radiation on the optimum thermal insulation thickness of roofs in Tunisian buildings. The study concluded that the long-wave radiation has a major effect on the annual heat gain and optimum thickness of insulation. Also, another study evaluated the effect of surface color on the optimum thermal insulation thickness of residential buildings in different climates in China which experience hot summers [11].
Although the previous studies mainly focused on the reduction of the cooling load by implementing the passive strategies such as cool roofs, vegetated roofs, and optimization of thermal insulation thickness, the effects of thermal capacity on the cooling load reduction in arid and humid climates have not been sufficiently investigated. One possible way of research could be managing the thermal capacity instead of adding extra thermal insulation to control total heat gain and peak load in buildings.
In this article, the thermal performance of three different roofs in two different climate conditions was compared and evaluated. Here, the mass and thermal capacities of the roofs were the main focus. Consequently,
three cases, including one light and two heavy roofs which are commonly used in Iran and similar countries in the Middle East, were considered. Unfortunately, in Iran, 33% of total electricity consumption is contributed to the residential buildings. Furthermore, buildings energy consumption is six times greater than average consumption in European countries and twice more than the global usage [12, 13]. Therefore, in order to reduce the amount of energy utilization in the building sector, the Iranian Ministry of Housing and Urbanism has introduced Code No. 19 [14]. In the mentioned code, the heat loss coefficient of a building (W/m) is calculated considering the steady-state heat transfer through the building envelope, i.e., U-value and the heat losses due to the building envelope thermal bridges. The main limitation of this method is that the thermal energy storage characteristic of materials would be neglected. Hence, this code and other related guidelines have focused on improving the thermal performance of building envelopes by adding extra thermal insulation [15]. However, performing a dynamic simulation instead of a steady-state analysis enhances the limitation of Code No. 19 for evaluating the thermal performance of walls and roofs. For instance, Mohammad and Shea conducted a dynamic analysis for different wall assemblies used in residential buildings of Tehran (Iran) so as to identify the most energy-efficient wall type [13].
Zaki [29] in their studies illustrated the effect of insulation and thermal storage in elements layers on the cooling load of buildings.
Although the roof has a great contribution to cooling and heating loads in buildings, a few studies have been conducted to analyze the effect of roofing materials on energy consumption in the buildings. Also, since countries in the Middle East consume a huge amount of energy during the summer for air conditioning systems, improving the thermal performance of roof could be an appropriate way to reduce the energy consumption in this region. Hence, in this study, the thermal performance of three kinds of roofs with different materials in different external conditions have been compared. The result of this study indicates the importance of thermal storage as a passive strategy for reducing the energy usage of buildings in cooling dominated areas. Also, as the intensity of absorbed solar radiation is influenced by clouds, shading from neighboring buildings and the color of the roof, the roofs thermal performance would be evaluated in these conditions. Finally, the study shows the importance of dynamic analysis on the evaluation of the roofs thermal performance, which should be performed instead of the steady-state analysis method of national building regulations (Code No. 19) [14]. To this end, a transient numerical method was used to evaluate the time evolution of the heat gain of each roof in different conditions. The results were validated with building energy simulation tool EnergyPlus. In the following, the materials selected for the roofs are described, the mathematical formulation and numerical method are explained, and the numerical results of the hourly analysis are discussed.
2.
Problem Definition
In this article, the heat transfer through flat roofs of different materials is considered. For simplicity, it is assumed that the temperature is one-dimensional in the x-direction, as shown in Fig. 1. In this figure, x=0 represents the inner surface, and x=L represents the outer surface. The external surface is exposed to the convection heat transfer, solar radiation, and reflected radiation from the surface.
In fact, the one-dimensionality assumption is not the case for the actual condition, including stud-and-block roofs. However, in these types of roofs, some portion of the area is occupied by studs which are usually of the identical materials in different types of the roof. Further, the portion of this part is less than that of the blocks. Thus, in this study, only heat transfer through the blocks has been investigated.
Also, the following assumptions were considered: 1. Solar radiation and ambient temperature vary
periodically with time.
2. The material properties are constant.
3. Coefficients of convection heat transfer for indoor and outdoor air are constant.
4. The indoor temperature is kept constant by a proper cooling system.
5. The radiation heat transfer at the inner surface is neglected.
6. Thermal conductivity is not a function of temperature as the temperature variation in each layer is small.
2.1 Materials
In recent years, in Iran and other countries in the Middle East, the use of manufactured blocks in the roofs has significantly grown. This kind of roof has suitable acceptability because of good resistance against earthquakes. Both concrete block and expanded polystyrene block could be used in the construction of this kind of roof.
In this study, three roofs with different materials were considered. As described in Table 1, the first case is a roof with concrete blocks which has a high heat transfer coefficient equal to 1.28𝑊/𝑚2𝐾. To improve the thermal performance of the roof type 1, an insulation layer was added to the arrangements of the layers in the roof type 2. This modification lowers the overall heat transfer coefficient down to 0.2 𝑊/𝑚2𝐾 while the weight per area remains approximately unaffected. The third type in Table 1 is a roof with expanded polystyrene block. This roof was set to have an overall heat transfer coefficient equal to that of the second roof type. However, the other thermal properties, especially the heat capacities, are not the same.
The properties of the employed materials are listed in Table 1, according to the data given in [14]. As can be seen, concrete block has high density and high thermal conductivity while for expanded polystyrene block, these properties are considerably lower. Based on this table one can calculate that the total thermal capacity of roofs 1 and 2 per unit area is 606 kJ/m2K while for roof 3, it is 245 kJ/m2K, i.e., 60 percent lower. This difference in thermal capacity provides a suitable situation for comparison of heat transfer rates of the roofs reported above in different climates.
2.2 Climate conditions
𝑇𝑠𝑘𝑦 = 𝜀𝑠 1 4 . 𝑇
𝑎𝑚𝑏𝑖𝑒𝑛𝑡 (1)
Where, 𝑇𝑎𝑚𝑏𝑖𝑒𝑛𝑡 is the outdoor absolute temperature
and 𝜀𝑠 is the diffuse sky coefficient, which is calculated
from the Eq. (2).
𝜀𝑠=0.787 + 0.764 Ln𝑇273𝑑𝑒𝑤 .𝐹𝑐𝑙𝑜𝑢𝑑 (2)
Figure 1. Schematic of a multi-layer roof with outdoor and indoor convection and solar irradiation.
Table 1. Details of layers of thermal properties used for the three types of roofs [14].
Layer
No. Materials
Thicknes s (m) k (
𝑾 𝒎.𝑲)
𝑪𝒑
(𝒌𝒈.𝑲𝒌𝑱 )
(𝒎𝒌𝒈𝟑)
Roof type 1
1 Waterproofing layer 0.005 0.15 0.90 2500 2 Cement plaster 0.02 1.15 1.00 2100 3 Pumice rocks 0.075 0.15 0.90 600 4 Concrete 0.05 1.79 0.85 2300 5 Concrete block 0.20 1.25 0.88 2100 6 Cement plaster 0.015 1.15 1.00 2100 7 Gypsum plaster 0.01 0.36 1.00 1300
Mean U=1.28 W/(𝒎𝟐𝑲) 0.89 1811 Roof type 2
1 Waterproofing layer 0.005 0.15 0.90 2500 2 Cement plaster 0.02 1.15 1.00 2100 3 Pumice rocks 0.075 0.15 0.90 600 4 Concrete 0.05 1.79 0.85 2300 5 Concrete block 0.20 1.25 0.88 2100 6 Cement plaster 0.015 1.15 1.00 2100
7 Polyurethane
insulation 0.126 0.03 1.50 30 8 Gypsum plaster 0.01 0.36 1.00 1300
Mean U=0.20 W/(𝒎𝟐𝑲) 0.89 1362
Roof type 3
1 Waterproofing layer 0.005 0.15 0.90 2500 2 Cement plaster 0.02 1.15 1.00 2100 3 Pumice rocks 0.075 0.15 0.90 600 4 Concrete 0.05 1.79 0.85 2300
5 Expanded
polystyrene 0.175 0.04 1.21 40 6 Cement plaster 0.015 1.15 1.00 2100 7 Gypsum plaster 0.01 0.36 1.00 1300
Mean U=0.20 W/(𝒎𝟐𝑲) 0.919 760
In this equation, 𝑇𝑑𝑒𝑤 is the dew point temperature and
𝐹𝑐𝑙𝑜𝑢𝑑 is the cloud cover coefficient which was chosen here as 1 equivalent to the cloudless sky.
As it is illustrated in Fig. 2, in the hot-humid climate, due to high latent heat, the temperature difference between day and night is lower than that of the hot-dry climate. On the other hand, as described in the next subsection, the solar radiation in the hot-humid climate in this study was higher due to the lower latitude angle. So, these two climates are comparable.
2.3 Solar radiation
The amount of clear day irradiation on the roof surface can be incident up to almost 1 kW/m2 and between 20 and 95 percent of this radiation is absorbed depending on the color of roof surface [32]. Solar radiation incident to the surface consists of short-wave radiation that can be absorbed, reflected, and comes to the building and influences the internal and external surface temperature [33]. A portion of the heat absorbed by the outer surface is transferred to other layers by conduction. The other part may be released through convection and long-wave radiation to the sky.
The total solar radiation consists of three parts: direct radiation 𝐺𝐷, diffuse radiation 𝐺𝑑, and ground-reflected radiation 𝐺𝑔.
𝐺𝑇= 𝐺𝐷+ 𝐺𝑑+𝐺𝑔 (3)
In this study, the ground reflection was ignored. Here, two high and low conditions for solar radiations were considered. High radiation, in this case, was when both the direct and diffuse radiations are considered, and the color of the roof surface is black with an emissivity coefficient ε equal to 0.9. For the low radiation condition, only the diffuse radiation was considered, with a white color surface for which ε is 0.2. These two conditions in this paper are denoted by H and L, respectively. The comparison was carried out on July 21, since the solar radiation intensity on the horizontal surface is the maximum on this day.
The value of solar radiation varies with time and depends on climate and places. The components of solar radiation are shown in Fig. 3 for each selected climate. The solar radiation GT (t) for the roofs were calculated hourly with the method given in the ASHRAE Fundamental handbook [34]. Ground-reflected radiation 𝐺𝑔 for a horizontal surface is 0.
In Fig. 3, it is seen that there is a delay with the time that solar radiation reaches its peak in both climates. The reason is that there is a difference between the local solar time (LST) and local civil time (LCT), which is indicated by the clock. The LST is based on the apparent daily motion of the sun in the sky, and the difference between these times is due to irregularities of earth orbit and tilt of its axes. Here, one hour is the difference between the two climates for the solar radiation peak.
3.
Mathematical
and
Numerical
Models
3.1 Transient vs. steady-state analysis
Heat transfer through building envelopes such as roof and walls can be analyzed using either transient or steady approach. Selection of the appropriate analysis method depends on the external condition and the goal being pursued. In the steady approach, inside and outside conditions such as temperature and solar radiation are assumed to be constant and do not vary with time; while in the transient method, outside conditions vary with time and because of thermal storage of the materials, the rate of heat transfer is not uniform through the envelope, i.e., heat transfer rate is a function of both time and space. The governing equation here is:
∂2Tj 𝜕2𝑥 =
1 𝛼𝑗(
𝜕𝑇𝑗
𝜕𝑡) j=1,…..,n (4)
where α is the thermal diffusion coefficient, T is temperature, x is the distance from the inner surface and t
is time. Also, j indicates the number of the layer in the roof.
Sometimes, the variation of the temperature through the envelope is described by the propagation of waves. In this way, the magnitude of the waves represents the temperature. The amplitude of heat waves at the outer surface depends on solar radiation and convection heat transfer with outdoor air temperature. While the wave propagates through the roof toward the inner surface, the magnitude of the temperature waves and the amount of the net heat transfer rate decreased because of thermal storage. In other words, when the wave reaches the indoor space, its amplitude is less than that on the external surface [20]. The decrease in the ratio of temperature value during the transient process is called “decrement factor” [22] i.e.
f = 𝑇𝑇𝑖,𝑚𝑎𝑥−𝑇𝑖,𝑚𝑖𝑛
𝑜,𝑚𝑎𝑥−𝑇𝑜,𝑚𝑖𝑛 (5)
where 𝑇𝑜,𝑚𝑖𝑛, 𝑇𝑜,𝑚𝑎𝑥, 𝑇𝑖,𝑚𝑖𝑛, and 𝑇𝑖,𝑚𝑎𝑥 are the
maximum and minimum amounts of temperature on the exterior and interior roof boundaries, respectively.
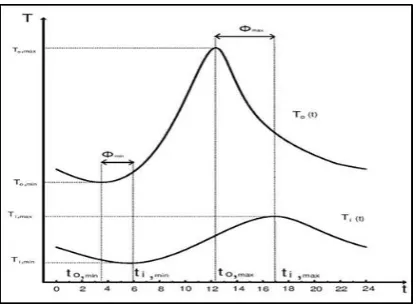
In addition to the reduction of wave amplitude, the phase of the wave is delayed with the propagation of the wave. The difference between the times that maximum or minimum temperatures of outside conditions reach the inside is called “time lag” ϕ. Following Asan and Sancaktar [22], here, these factors are defined as:
𝜙𝑚𝑎𝑥=𝑡𝑖,𝑚𝑎𝑥-𝑡𝑜,𝑚𝑎𝑥, 𝜙𝑚𝑖𝑛=𝑡𝑖,𝑚𝑖𝑛-𝑡𝑜,𝑚𝑖𝑛, (6)
where 𝑡𝑖,𝑚𝑎𝑥 , 𝑡𝑜,𝑚𝑎𝑥 , 𝑡𝑖,𝑚𝑖𝑛 and 𝑡𝑜,𝑚𝑖𝑛 represent the
times that outside and the inner side of the roof surface reach their maximum and minimum, respectively. The above-defined factors depend on the thermal properties, the thickness of the roof layers, and solar absorptivity, which are important in the selection of the cooling system. The time lags, decrement factor, and schematics of temperature oscillations are shown in Fig. 4.
When the outside boundary condition is periodic and harmonic, 𝜙𝑚𝑎𝑥and 𝜙𝑚𝑖𝑛 are the same. In this situation,
the pseudo-steady-state solution of the governing
differential equation (4) is achievable. Although the variation of ambient temperature (Fig. 2) may be approximated with a sine-type function, in the presence of the solar radiation, the outside condition is not a harmonic function [21, 25]. Hence, 𝜙𝑚𝑎𝑥would may be unequal to
𝜙𝑚𝑖𝑛.
3.2 Initial and Boundary conditions
For these roofs with different thickness and thermal properties, transient equation without generation is considered as represented in Eq. (4). The geometry of the problem is shown in Fig. 5. The inner surface condition was assumed an air-conditioned space, and the temperature is constant.
Here, the interface resistance between layers was neglected. Consequently, the temperature and heat flux are continuous, and the inter-layer boundary conditions are:
𝑇𝑗 = 𝑇𝑗+1 j = 1,..., N (7)
Figure 2. Ambient, sky, and dew point temperatures variations for the two selected climates for 21 July based on Ref. [30].
Figure 3. The solar radiation components for the two selected climates based on Ref. [30].
0 5 10 15 20 25 30 35 40 45
1 3 5 7 9 11 13 15 17 19 21 23
Te
mp
e
ra
tu
re
(C
◦
)
Time (h)
humid climate-ambient temperature
dry climate-ambient temperature
dry climate- sky temperature
humid climate-sky temperature
dry climate-dew point
humid climate-dew point
0 200 400 600 800 1000 1200
1 3 5 7 9 11 13 15 17 19 21 23
So
la
r
Ir
ra
d
ia
n
ce
(
W
/m
2
)
Time (h)
humid climate-direct radiation
humid climate-diffuse radiation
humid climate-total radiation
dry climate-direct radiation
dry climate-diffuse radiation
Figure 4. The schematic representation of the temperature oscillation on the inner and outer surfaces of the roof and definition
of the time lags 𝜙𝑚𝑎𝑥 and 𝜙𝑚𝑖𝑛. 𝑘j
∂𝑇𝑗 𝜕𝑥 = 𝑘𝑗+1
𝜕𝑇𝑗+1
𝜕𝑥 j = 1,…, N (8)
In the above equation, 𝑘𝑗 and 𝑘𝑗+1 are thermal
conductivity and j and j+1 are layer numbers.
In order to solve the Eq. (4), one initial condition and two boundary conditions are required. For initial condition, it was assumed that the temperature in all layers in t=0 is uniform and equal to 𝑇0 , i.e., 𝑇𝑗(x, 0) = 298 K.
To avoid the effect of initial condition on results, the solution has to be continued in time repeatedly until temperature distribution, and other variables become periodic. For this solution, 20 days has been found sufficient.
Two boundary conditions in x=0 and x=L were considered. The boundary condition at the inner surface (x=0) is:
-𝑘1𝜕𝑇𝜕𝑥 = ℎ𝑖 (𝑇𝑖𝑛-𝑇𝑥=0). (9)
In Eq. (9), ℎ𝑖 is the internal convection heat transfer
coefficient and 𝑇𝑖𝑛 is the air-conditioned space
temperature.
For external surface (x=L): -𝑘𝑛𝜕𝑇𝜕𝑥 =
-𝛼𝑠𝐺𝑇- ε σ (𝑇4𝑠𝑘𝑦-𝑇4𝑜) + ℎ0(𝑇𝑜-𝑇𝑎𝑚𝑏𝑖𝑒𝑛𝑡).
(10)
In this equation, 𝐺𝑇 is the total intensity of solar
radiation given in Fig. 3, ε is the long-wave emissivity of the outer surface of the roof, and 𝛼𝑠 is the solar
absorptivity of the outer surface of the roof which is assumed here to be equal to ε. Also, σ is the Stefan-Boltzmann coefficient 5.67e-8 W/(𝑚2𝐾4) and 𝑇𝑜 and
𝑇𝑎𝑚𝑏𝑖𝑒𝑛𝑡 are the external surface and the outdoor
temperatures, respectively.
By calculating the temperature gradient 𝜕𝑇𝜕𝑥 in x=0, the rate of heat gain through the roof would be computed.
q=-𝑘1𝜕𝑇𝜕𝑥. (11)
3.3. Numerical method
To calculate the heat transfer and analyze the thermal performance of elements, different methods were utilized. One of them is the finite difference method, which is
applicable for multilayers roof or wall if the internal boundary conditions (as mentioned in Section 2) are considered. Wide ranges of studies have been conducted by the finite difference method for analyzing the transient heat transfer through multilayers walls and roofs. Al-Regib and Zubair [18], Ozel and Pihtili [35], and Al-Sanea [19] used this method in their studies. Han et al. [6] applied the finite difference method to analyze light roofs with different insulations. In this study, the finite difference method was used to calculate the heat flux through the roof and evaluate the effects of different materials on heat transfer, decrement factor, and time lag.
Here, Backward-in-Time-Central-in-Space (BTCS) discretization scheme was employed to solve the governing equation (4) numerically.
𝑇𝑝𝑛+1−𝑇 𝑝𝑛 ∆𝑡 = 𝛼𝑝
𝑇𝑝+1𝑛+1−2𝑇 𝑝𝑛+1+𝑇𝑝−1𝑛+1
∆𝑥2 . (12)
In Eq. (12), the subscript p denotes the node number and superscripts n and n+1 denote the current and the next time levels respectively. One can rewrite the Eq. (12) as:
-s𝑇𝑝+1𝑛+1+ (1+2s) 𝑇𝑝𝑛+1 - s𝑇𝑝−1𝑛+1 = 𝑇𝑝𝑛, (13)
where s=𝛼∆𝑥𝑝∆𝑡2. Since Eq. (12) is implicit, and all the
coefficients are constant, the numerical method is unconditionally stable, i.e., there is no restriction on the time-step size ∆𝑡. Instead, a linear system of equations should be solved. The implicit method described in Eq. (13) is second-order accurate in space and first-order accurate in time (i.e., O (∆𝑡,∆𝑥2)).
To obtain grid-independent results, the grid was refined until no significant change in the temperature is noticed. Here, three grid sizes 5, 2.5, and 1 mm have been tested. Finally, 1 mm grid size was selected. For all cases, the time-step size was set to 360 seconds.
4.
Results and Discussion
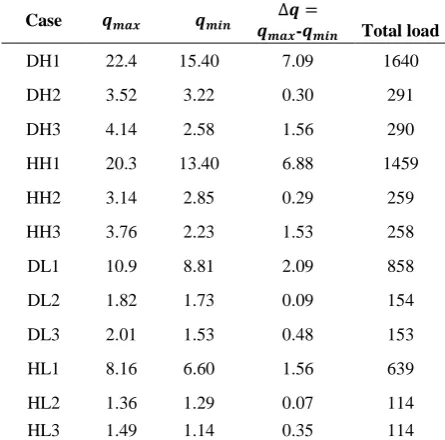
In this study, the aforementioned numerical method was applied to the introduced roof types in different conditions. All the cases are listed in Table 2. In this section, the obtained results are presented and discussed. For each case, all points are initialized using a uniform temperature. Then, the simulation is carried out until the inner surface heat transfer flux described in Eq. (11) becomes 24-hour periodic. This result is shown in Fig. 6 for the case DH2 as an example. As it is observed, the obtained heat flux is periodic after about 15 days. Hence, the results of the last 24 hours represent the pseudo-steady-state solution of Eq. (4). Here, to ensure the pseudo-steady condition, for all cases, the results of the 30th day have been used.
4.1 Validation
Figure 5. The schematic of the problem geometry, which describes the notation used in the numerical solution.
Table 2. The list of studied cases and their abbreviations.
Case
Name Climate Radiation Roof type (from Table 1)
DH1
Dry
High
1
DH2 2
DH3 3
DL1
Low
1
DL2 2
DL3 3
HH1
Humid
High
1
HH2 2
HH3 3
HL1
Low
1
HL2 2
HL3 3
Figure 6. Numerical results of heat flux vs. time on the inner surface of the roof obtained for the case DH2.
EnergyPlus calculates the required energy for heating, cooling, lighting, and ventilating as well as water in buildings considering all outdoor and indoor parameters including geographical location, outside temperature, solar radiation intensity and direction, wind speed and direction, glazing shading and radiation characteristics, generated heat by internal loads such as occupant density and activities, lightening and miscellaneous equipment, infiltration, etc. EnergyPlus calculates the heat flux through the surfaces based on BLAST conduction transfer function (CTF). Moreover, conduction finite difference (CondFD) solution algorithm has been integrated into EnergyPlus [36]. Here, the EnergyPlus heat balance algorithm was defined based on the conduction finite difference method, and the results were compared with those of the numerical code.
In order to validate the method presented in this study, all cases in Table 2 were simulated by EnergyPlus, and the results were compared with those of the method mentioned in Section 3.
Table 3 shows the relative differences between total loads of the finite difference method and EnergyPlus for different cases. The results of the cases with “high radiation” are presented here which are close to differences of about 10% and below. This approves the validity of the code.
For better comparison, the results of the outer surface temperature are compared in Fig. 7 for case DH2 as an example. It is seen that the results are close together, and the difference is only near noon when the solar radiation is at its peak.
4
.2 Temperature variation
The temperature variation for the inner and outer surfaces for the same case DH2 is plotted in Figs. 8 and 9. The outer surface temperature in Fig. 8 is highly dependent on solar radiation. By comparison with Fig. 3, it is obvious that the high rate of change in temperature in Fig. 8 from hour 6 to hour 12 is caused by solar radiation. In contrast, the inner surface temperature in Fig. 9 is smoother, and its maximum is far away from 12 o’clock. The time lag defined in Eq. (6) can be calculated from these two figures as 𝜙𝑚𝑎𝑥=13 and 𝜙𝑚𝑖𝑛=11 hours.
4.3 Heat gain and time lags
Table 3. Comparison between the results of the present numerical method and EnergyPlus software.
Case
Present method (kJ/m2)
EnergyPlus (kJ/m2)
Relative Difference
(%)
DH1 1640 1592 2.95 DH2 291 301 -3.29 DH3 290 321 -10.70 HH1 1459 1346 7.76
HH2 259 266 -2.86
HH3 258 287 -11.20
Figure 7. Comparison of the results of the present method and EnergyPlus for outer surface temperature variations for the last
24 hour period for the case DH2.
Figure 8. The results of outer surface temperature variations for the last 24 hour period for the case DH2.
Figure 9. The results of inner surface temperature variations for the last 24 hour period for the case DH2.
Furthermore, in Table 4, the total heat gain (load) of a unit area of each roof is reported in the last column. One may conclude that this quantity depends only on thermal resistance and ambient condition. However, the comparison of the total load for the roof types 2 and 3 in corresponding conditions (for example HH2 and HH3) does not show sensible differences. Since the main difference between these roofs is their heat capacity, it can be realized that the total load and consequently, average heat fluxes are not meaningful functions of thermal storage of the roof.
It is also notable that for all ambient conditions, the ratio of the total load of the roof type 1 to that of the roof type 2 or 3 is equal to 5.6. This value is slightly less than the ratio of the overall heat transfer coefficient, i.e., 6.4. It means that if one computes the total loads using the steady-state method instead of the hourly analysis, it has about 12 percent error.
The obtained time-variations of heat transfer rates at the inner surface are plotted versus time in Figs. 10 and 11. In Fig. 10, the roofs are compared for the high radiation condition and in Figs. 11 for the low radiation condition. To have a better comparison, the results of roof type 1 have been shown separately in these figures.
Comparison of roof 2 with 3 in both climates in Fig. 10 (b) along with the values in Table 3, demonstrates that the difference between maximum and minimum heat rates in roof 2 is always less than that of roof 3. Similar results could be seen in Fig. 11(b) for low radiation cases. However, in this condition, the values ∆𝑞 are much less than the corresponding values for the high radiation condition. The lower values of ∆𝑞 in roof type 2 are due to its higher heat capacity in comparison with roof 3. From Table 1, one can calculate that a square meter of roof types 1 and 2 have 611 kJ/K of total heat capacity while for the roof type 3 this value is 244 kJ/K, i.e., 40% of the heat capacity of roof type 2. The difference between the maximum and minimum heat rates in the dry climate is more than humid climate due to the higher temperature difference during the 24-hour (See Fig. 2).
Table 5 gives the times at which the outer and inner surfaces temperatures reach their maximums and minimums, i.e., 𝑡𝑖,𝑚𝑎𝑥, 𝑡𝑖,𝑚𝑖𝑛, 𝑡𝑜,𝑚𝑎𝑥 and 𝑡𝑜,𝑚𝑖𝑛. For the case with high radiation, the time of maximum temperature for outer surface highly depends on the solar radiation. In the dry climate where the solar peak is at 12 a.m. (See Fig. 3), 𝑡𝑜,𝑚𝑎𝑥 is 2 p.m. However, in humid climate, the peak of solar radiation is at 1 p.m. (See Fig. 3) and 𝑡𝑜,𝑚𝑎𝑥 is at 3 p.m. This shift in radiation peak has a direct effect on the times of maximum and minimum loads for the cases with high radiation, i.e., the first six cases. As shown in Table 5, the times at which loads reach maximum and minimum for cases DH1 to DH3 are one hour sooner than those of the humid climate (cases HH1 to HH3).
On the other hand, when the radiation is low (cases DL1 to DL3 and HL1 to HL3) the time 𝑡𝑜,𝑚𝑎𝑥 depends only on the time of maximum ambient temperature, which is 4 p.m. for both climates in Fig. 2. Similarly, in all cases,
0 10 20 30 40 50 60 70 80
1 3 5 7 9 11 13 15 17 19 21 23
Tem
pe
rat
ur
e
(c
◦
)
Time (h)
EnergyPlu s
Numerica l Method
20 25 30 35 40 45 50 55 60 65 70
1 3 5 7 9 11 13 15 17 19 21 23
Tem
pe
rat
ur
e
(c
◦
)
Time (h)
25.130 25.135 25.140 25.145 25.150 25.155 25.160 25.165 25.170
1 3 5 7 9 11 13 15 17 19 21 23
Tem
pe
rat
ur
e
(c
◦
)
the time 𝑡𝑜,𝑚𝑖𝑛 is also independent of the time of radiation peak, and is equal to the time of minimum of the ambient temperature (i.e., 5 a.m.). Both of the above values are in agreement with the numerical results reported in Table 5.
The variation of 𝑡𝑖,𝑚𝑎𝑥 and 𝑡𝑖,𝑚𝑖𝑛 could be explained by the time lags 𝜙𝑚𝑎𝑥 and𝜙𝑚𝑖𝑛. If one simulates the behavior of the roofs by a series of resistances parallel with capacitors, it can be shown that the phase lag between temperature difference and heat rate is a function of resistance multiplied by capacity similar to the Resistance-Capacitor (RC) electrical circuits studied in the context of alternating currents (AC) circuits [37]. In this way, time lags for the roof type 2 are expected to be more than the other types. Although roofs 2 and 3 have the same total resistance, the thermal capacity of roof 2 is much more. On the other hand, the mass and heat capacity of roofs 1 and 2 are almost the same, but the thermal resistance of roof 2 is more. The results in Table 5 confirm the above statement.
On the other hand, the results in Table 5 show that in the low radiation condition, 𝜙𝑚𝑎𝑥 and 𝜙𝑚𝑖𝑛 are the same. The reason is that without the presence of direct solar radiation, the external condition could be estimated as sine-type. Consequently, the problem is completely similar to the AC circuit discussed above and the time lags are equal. However, direct solar radiation would affect this similarity. Since the radiation profiles in Fig. 3 are not sine-type, 𝜙𝑚𝑎𝑥 and 𝜙𝑚𝑖𝑛 are not equal for the cases with high radiation. The results in Table 5 show one or two hours difference between 𝜙𝑚𝑎𝑥 and 𝜙𝑚𝑖𝑛 for the first six cases. The fact that 𝜙𝑚𝑎𝑥 is greater than 𝜙𝑚𝑖𝑛 has also been stated in the literature. For instance, see [25]. However, 𝜙𝑚𝑖𝑛 is one hour more in humid climate cases than their dry counterparts.
Table 4. The results of heat flux and total heat gain (𝑊
𝑚2) of
roofs in different external conditions.
Case 𝒒𝒎𝒂𝒙 𝒒𝒎𝒊𝒏 𝒒 ∆𝒒 =
𝒎𝒂𝒙-𝒒𝒎𝒊𝒏 Total load
DH1 22.4 15.40 7.09 1640
DH2 3.52 3.22 0.30 291
DH3 4.14 2.58 1.56 290
HH1 20.3 13.40 6.88 1459
HH2 3.14 2.85 0.29 259
HH3 3.76 2.23 1.53 258
DL1 10.9 8.81 2.09 858
DL2 1.82 1.73 0.09 154
DL3 2.01 1.53 0.48 153
HL1 8.16 6.60 1.56 639
HL2 1.36 1.29 0.07 114 HL3 1.49 1.14 0.35 114
Table 5. The results of times, time lags, and decrement factors of roofs in different external conditions.
Case
𝒕𝒊,𝒎𝒂𝒙 h
𝒕𝒊,𝒎𝒊𝒏 h
𝒕𝒐,𝒎𝒂𝒙 h
𝒕𝒐,𝒎𝒊𝒏 h
𝝓𝒎𝒂𝒙 h
𝝓𝒎𝒊𝒏 h
f
DH1 24 13 14 5 10 8 0.0160 DH2 3 16 14 5 13 11 0.0007 DH3 23 12 14 5 9 7 0.0035 HH1 1 14 15 5 10 9 0.0163 HH2 4 17 15 5 13 12 0.0007 HH3 24 13 15 5 9 8 0.0036 DL1 2 15 16 5 10 10 0.0154 DL2 5 18 16 5 13 13 0.0006 DL3 1 14 16 5 9 9 0.0034 HL1 2 15 16 5 10 10 0.0157 HL2 5 18 16 5 13 13 0.0007 HL3 1 14 16 5 9 9 0.0035
Table 6. Equivalent cooling loads of the roofs based on the triple-time tariff.
Apart from these parameters, the decrement factor is another important parameter in the evaluation of material performance in buildings, and the lower amount for this factor is desirable. As shown by Asan [20], by decreasing the thermal resistance and/or capacity, the decrement factor increases. It is in agreement with the results in Table 5 in which the roof type 1 with the thermal resistance lower than that of the roof type 2 has a higher decrement factor. Also, the roof type 2 has lower decrement factor than type 3 because of greater thermal capacity.
It is observed in Figs. 10 and 11 that the inner surface temperature starts to decrease from the latest hours of the night to the afternoon. For instance, in roof type 2, in the dry climate and high radiation condition (DH2), the maximum inner surface temperature occurs at 3 a.m., and the minimum temperature of it occurred 2 hours after the outer surface reaches its maximum value. After 4 p.m., the inner surface increases gradually to the middle of the night, at 3 a.m. and causes the high 𝜙𝑚𝑎𝑥 since the outer surface reaches its maximum value early. This behavior of roof indicates that during the time that the inner surface temperature is decreasing, it absorbs the energy and then releases it at midnight. This behavior is repeated for the other roofs and in all conditions.
Case
Cooling loads (kWh)
Low-load hours
Normal
hours Peak-load hours
Total Equivalent
Figure 10. Heat flux through (a) roof type 1 (b) roof types 2 and 3 in the high radiation condition in both climates.
(a)
(b)
Figure 11. Heat flux through (a) roof type 1 (b) roof types 2 and 3 in
4.4 Economic study
In this section, the economic aspects of thermal storage are studied. It is obvious that the heat gain from the roof is only a part of the total load of the air conditioning system. However, here, the amount of the heat gain from a square meter of the roofs (obtained in the previous section) has been converted to an equivalent kWh based on the tariff of the electricity in Iran.
The price of electricity has been divided into three parts in this meter based on the time of usage, including low-, medium- and peak-load hours and in various hours, the price of electricity is different. In peak hours, the price is twice as much as normal hours; while the price of the low-load hours is half of the normal. In this definition, the hours from 19 p.m. to 23 p.m. are considered as peak-load hours and the hours between 24 p.m. and 7 a.m. and from 7 a.m. to 19 p.m. are low and medium-load hours, respectively. The equivalent electricity consumption is equal to the total electricity consumption plus peak-load hours consumption minus low-load hours consumption.
The equivalent loads of the roofs have been calculated based on the hourly heat fluxes of the previous section and reported in Table 6. Again, it is seen that roofing type 2 has better performance, and the equivalent consumption is lower than others in both climates. However, in the dry climate, it is more evident because the effect of thermal storage is more sensible here rather than the humid climate.
5.
Conclusions
In this article, a numerical method was applied so as to analyze the thermal performance of three kinds of roofs in different external conditions. For this purpose, the roof type 1 was selected as a heavy roof with a relatively high overall heat transfer coefficient. The roof types 2 and 3 had lower heat transfer coefficients. While the thermal capacity of the roof type 2 was the same as type 1, the thermal capacity of the roof type 3 was 60 percent lower. The pseudo-steady-state thermal performance of these roofs has been evaluated numerically in terms of an implicit finite difference method. The results are summarized below:
The high heat capacity of roof type 2 decreases the difference between its maximum and minimum loads relative to the roof type 3.
The thermal capacity has a small effect on the total heat gain. Roof types 2 and 3 have almost equal total load because of similar heat transfer coefficient. For roof 1, the total load was about 5.6 times bigger than that of roofs 2 and 3. However, this is 12 percent lower than the ratio of their heat transfer coefficient.
In the high radiation condition, the times 𝑡𝑖,𝑚𝑎𝑥,
𝑡𝑖,𝑚𝑖𝑛, and 𝑡𝑜,𝑚𝑎𝑥 depend on the time of solar noon. Nevertheless, 𝑡𝑜,𝑚𝑖𝑛 depends only on the
time-variation of the ambient temperatures.
In summer, high 𝜙𝑚𝑖𝑛 is better because the minimum
6 7 8 9 10 11 12
1 3 5 7 9 11 13 15 17 19 21 23
q ( W/
m
2
)
Time (h)
DL1
HL1
0.9 1.1 1.3 1.5 1.7 1.9 2.1
1 3 5 7 9 11 13 15 17 19 21 23
q ( W/
m
2
)
Time (h)
DL2
DL3
HL2
HL3 12
14 16 18 20 22 24
1 3 5 7 9 11 13 15 17 19 21 23
q ( W/
m
2
)
Time (h)
DH1
HH1
2 2.3 2.6 2.9 3.2 3.5 3.8 4.1 4.4
1 3 5 7 9 11 13 15 17 19 21 23
q ( W/
m
2
)
Time (h)
DH2
DH3
HH2
indoor temperature occurs in the hottest external condition, and vice versa. From this point of view, the roof type 2 has better performance than roof types 1 and 3, since for this type, 𝑡𝑖,𝑚𝑎𝑥 happened 3 and 4
hours after roof types 1 and 3 respectively.
The roof type 2 has the lowest decrement factors because of its low thermal conductivity and high heat capacity.
The roofs have lower decrement factor in the dry climate compared to the humid climate as heat capacity is more effective in dry climate due to the higher temperature difference between day and night.
Cooling system size was determined for the peak load. As a result, the roof 1 is not suitable due to its high peak in comparison to other types, and roof type 2 has the lowest peak load.
In the comparison of roof types 2 and 3, in spite of their almost equal total loads, roof 2 has lower equivalent consumption due to its lower loads in peak hours.
Finally, roof type 1 because of the high total loads and high electricity consumption is not appropriate. Roof 2 has better thermal behavior and is more economic than roof type 3. In general, the performance of roofs in the dry climate is similar to that in the humid climate.
Nomenclature
𝑐𝑝 Specific heat capacity ( 𝐽
𝑘𝑔.𝐾)
𝐹𝑐𝑙𝑜𝑢𝑑 Cloud cover coefficient
f Decrement factor
𝐺 Radiation (W/𝑚2)
ℎ Convection heat transfer coefficient
(W/𝑚2K)
𝑘 Thermal conductivity (W/mK)
N Number of roof layers
q Heat flux density (W/𝑚2)
t Time (s)
T Temperature (°C)
𝑇0 Initial temperature (°C)
𝑇𝑠𝑘𝑦 Sky temperature (°C)
𝑇𝑎𝑚𝑏𝑖𝑒𝑛𝑡 Outdoor ambient temperature (°C)
U Overall heat transfer coefficient of roof
(W/𝑚2K)
x Coordinate direction normal to roof (m)
Greek symbols
𝛼 Thermal diffusivity (𝑚2/s)
𝛼𝑠 Solar absorptivity
ℰ Surface emissivity for long-wave thermal
𝜙 Time lag
Density
σ Stefan-Boltzmann constant (W/(𝑚2𝐾4))
Superscripts
n Current time level value
n+1 New time level value
Subscripts
d Diffuse
D Direct
dew Dew point
g Ground-reflected
i Inner surface
in Indoor
j Layer number
max Maximum
min Minimum
o Outer surface
p Node number
T Total
References
[1] B. Yesilata, H. Bulut, P. Turgut, “Experimental study on thermal behavior of a building structure using rubberized exterior-walls,” Energy and Buildings, 43(2-3), 393-399, (2011).
[2] C. Martins, P. Santos, L.S. da Silva, “Lightweight steel-framed thermal bridges mitigation strategies: A parametric study,” Journal of Building Physics, 39(4), 342-372, (2016).
[3] Z. Yılmaz, “Evaluation of energy efficient design strategies for different climatic zones: Comparison of thermal performance of buildings in temperate-humid and hot-dry climate,” Energy and buildings, 39(3), 306-316, (2007).
[4] C. Balaras, “The role of thermal mass on the cooling load of buildings. An overview of
computational methods,” Energy and
Buildings, 24(1), 1-10, (1996).
[5] S. Maneewan, J. Khedari, B. Zeghmati, J. Hirunlabh, J. Eakburanawat, “Investigation on generated power of thermoelectric roof solar collector,” Renewable Energy, 29 (5), 743-752, (2004).
[6] J. Han, L. Lu, H. Yang, “Investigation on the thermal performance of different lightweight roofing structures and its effect on space cooling load,” Applied Thermal Engineering, 29(11-12), 2491-2499, (2009).
[7] T. Runsheng, Y. Etzion, E. Erell, “Experimental studies on a novel roof pond configuration for the cooling of buildings,” Renewable Energy, 28(10), 1513-1522, (2003).
[8] K. Vijaykumar, P. Srinivasan, S. Dhandapani, “A performance of hollow clay tile (HCT) laid reinforced cement concrete (RCC) roof for tropical summer climates,” Energy and Buildings, 39(8), 886-892, (2007).
review,” Applied energy, 160, 336-357, (2015).
[10] N. Daouas, “Impact of external longwave radiation on optimum insulation thickness in Tunisian building roofs based on a dynamic analytical model,” Applied Energy, 177, 136-148, (2016).
[11] J. Yu, L. Tian, C. Yang, X. Xu, J. Wang, “Optimum insulation thickness of residential roof with respect to solar-air degree-hours in hot summer and cold winter zone of china,” Energy and Buildings, 43(9), 2304-2313, (2011).
[12] S.M. Heibati, F. Atabi, M. Khalajiassadi, A. Emamzadeh, “Integrated dynamic modeling for energy optimization in the building: Part 1: The development of the model,” Journal of Building Physics, 37(1), 28-54, (2013). [13] S. Mohammad, A. Shea, “Performance
evaluation of modern building thermal envelope designs in the semi-arid continental climate of Tehran,” Buildings, 3(4), 674-688, (2013).
[14] Bureau for Compiling and Promoting National Regulations for Buildings; Code No. 19, Isfahan, Iran, (2010).
[15] R. Fayaz, B.M. Kari, “Comparison of energy conservation building codes of Iran, Turkey, Germany, China, ISO 9164 and EN 832,” Applied Energy, 86(10), 1949-1955, (2009). [16] G. Barrios, G. Huelsz, J. Rojas, “Thermal
performance of envelope wall/roofs of intermittent air-conditioned rooms,” Applied Thermal Engineering, 40, 1-7, (2012).
[17] C. Mackey, L. Wright, “Periodic heat flow—
composite walls or roofs”, ASHVE
Transactions, 52(283), 194-196, (1946). [18] E. Al-Regib, S.M. Zubair, “Transient heat
transfer through insulated walls,” Energy, 20(7), 687-694, (1995).
[19] S.A. Al-Sanea, “Thermal performance of building roof elements”, Building and Environment, 37(7), 665-675, (2002). [20] H. Asan, “Numerical computation of time
lags and decrement factors for different
building materials,” Building and
Environment, 41(5), 615-620, (2006). [21] S.F. Larsen, C. Filippín, G. Lesino, “Thermal
behavior of building walls in summer: Comparison of available analytical methods and experimental results for a case study,” Building Simulation, 2(1), 3-18, (2009). [22] H. Asan, Y. Sancaktar, “Effects of wall's
thermophysical properties on time lag and decrement factor,” Energy and Buildings, 28(2), 159-166, (1998).
[23] H. Asan, “Investigation of wall's optimum insulation position from maximum time lag
and minimum decrement factor point of view,” Energy and Buildings, 32(2), 197-203, (2000).
[24] K. Kontoleon, E. Eumorfopoulou, “The influence of wall orientation and exterior surface solar absorptivity on time lag and decrement factor in the Greek region,” Renewable Energy, 33(7),1652-1664, (2008). [25] L.E. Mavromatidis, M.E. Mankibi, P. Michel, M. Santamouris, “Numerical estimation of time lags and decrement factors for wall complexes including Multilayer Thermal Insulation, in two different climatic zones,” Applied Energy, 92, 480-491, (2012).
[26] L. Zhang, J. Zhang, F. Wang, Y. Wang, “Effects of wall masonry layer’s thermophysical properties and insulation position on time lag and decrement factor,” Indoor and Built Environment, 25(2), 371-377, (2016). [27] G. Athanassouli, P. Massouros, “A model of
the thermal restoration transient state of an opaque wall after the interruption of solar radiation,” Solar energy, 66(1), 21-31, (1999). [28] S.F. Larsen, G. Lesino, “A new code for the hour-by-hour thermal behavior simulation of buildings,” Proceedings of VII International Building Simulation Congress (Brazil), 75-82, (2001).
[29] A. Al-Turki, G. Zaki, “Cooling load response for building walls comprising heat storing and thermal insulating layers”, Energy Conversion and Management, 32 (3), 235-247, (1991).
[30]Available from:
https://energyplus.net/weather/sources [31] G.N. Walton, Thermal analysis research
program reference manual, National Bureau of Standards, (1983).
[32] H. Suehrcke, E.L. Peterson, N. Selby, “Effect of roof solar reflectance on the building heat gain in a hot climate”, Energy and Buildings, 40(12), 2224-2235, (2008).
[33] H. Shen, H. Tan, A. Tzempelikos, “The effect of reflective coatings on building surface temperatures, indoor environment and
energy consumption—An experimental
study”, Energy and Buildings, 43(2-3), 573-580, (2011).
[34] American Society of Heating, Air-Conditioning and Refrigeration Engineers, Inc, ASHRAE Handbook, Fundamentals, Atlanta, (2005).
[35] M. Ozel, K. Pihtili, “Optimum location and distribution of insulation layers on building walls with various orientations”, Building and Environment, 42(8), 3051-3059, (2007). [36] Energyplus, EnergyPlus Engineering
![Table 1. Details of layers of thermal properties used for the three types of roofs [14]](https://thumb-us.123doks.com/thumbv2/123dok_us/41853.2004984/4.595.65.282.77.265/table-details-layers-thermal-properties-used-types-roofs.webp)
![Figure 3. The solar radiation components for the two selected climates based on Ref. [30]](https://thumb-us.123doks.com/thumbv2/123dok_us/41853.2004984/5.595.298.536.281.486/figure-solar-radiation-components-selected-climates-based-ref.webp)