1. Introduction
Pyrolysis is a process by which a solid fuel (biomass or coal) thermally decomposes in the absence or under a limited supply of oxygen/air to char, tar, and gaseous products. This process plays a vital role in the thermochemical conversion of solid biomass. The study of biomass gasification processes requires a detailed understanding of pyrolysis and the behavior of biomass particles in a reacting medium. The overall pyrolysis process appears simple, but the sequence of reactions is complex and involves both endothermic and exothermic processes, whose thermodynamics and kinetics are poorly understood [1]. Under such complex phenomena, formulating a
complete mathematical pyrolysis model that remains mathematically tractable is impossible. As a compromise between mathematical tractability and
descriptive accuracy, simplified models are
employed under certain defined conditions to predict the process that underlies the conversion of biomass particles. The need for simple rational models of pyrolysis as a basis for reactor design has been identified in an examination of the low-temperature (i.e., less than 600°C) pyrolytic conversion of biomass into usable forms of energy; this identification was prompted by the fact that the complications encountered in the numerical solutions of more sophisticated models make them unsuitable for design and prediction purposes [1]. One angle of
Analysis of heat transfer in the pyrolysis of differently shaped biomass
particles subjected to different boundary conditions: integral transform
methods
Gbeminiyi Musibau Sobamowo
a,*, Sunday Joshua Ojolo
b, Charles Attah Osheku
c, and Abiola
John Kehinde
da, bDepartment of Mechanical Engineering, University of Lagos, Akoka, Lagos, Nigeria.
cCentre for Space Transport and Propulsion, National Space Research and Development Agency, Federal Ministry of Science
and Technology, FCT, Abuja, Nigeria.
dDepartment of Chemical Engineering, University of Lagos, Akoka, Lagos, Nigeria.
Journal of Heat and Mass Transfer Research
Journal homepage: http://jhmtr.journals.semnan.ac.ir
A B S T R A C T
The conversion and utilization of biomass as an alternative source of energy have been subjects of interest in various countries, but technical barriers to the technology and design of conversion plants have considerably impeded the development and use of alternative power sources. Theoretical studies on the conversion process enhance our understanding of the thermochemical conversion of solid fuels. Carrying out such research necessitates the development of thermal and kinetic models of pyrolysis, on which the conversion process integrally depends. Another requirement is to analytically solve the aforementioned models to derive valuable insight into the actual process of biomass conversion. Accordingly, this study used Laplace and Hankel transforms to obtain analytical solutions to heat transfer models of rectangular, cylindrical, and spherical biomass particles. Pyrolysis kinetic models were also analytically solved using the Laplace transform. The study then investigated the effects of particle shape, particle size, isothermal and non-isothermal heating conditions, and convective and radiative heat transfer (calculated using a modified Biot number) on the pyrolysis of a biomass particle. This work is expected to substantially contribute to the design of pyrolysis reactors/units and the optimal design of biomass gasifiers.
© 2017 Published by Semnan University Press. All rights reserved. DOI: 10.22075/jhmtr.2017.1503.1100
PAPER INFO History:
Submitted:2016-07-09
Received: 2017-04-12 Accepted: 2017-04-16
Keywords:
Pyrolysis; Biomass Particles; Integral Transform Method;
Analytical Solution.
approach to the development of simple and economic models is the aggregation of the more important aspects of event sequence as a solid sample is pyrolyzed. The heat conduction equations for a pyrolyzing solid fuel, such as wood, were first combined with those for heat generation by Bamford [2], who assumed a first-order single-step reaction. The model developed by the author has been used by various researchers [3–5], including Matsumoto et al. [6], Roberts [7], and Kung [8], who later incorporated the effects of internal convection and variable transport properties into Bamford’s model. Kung [8] examined the effects of char formation, and
Matsumoto et al. [6] modeled the rate of char
removal by oxidation. Temperature-dependent
variations in the properties of solid fuels were explored by Matsumoto et al. [6], Kung [8], Maa and Baille [9], Kansa et al. [10], and Chan et al. [11]. Multi-step reaction schemes were presented by Kung [8], Chan et al. [11], and Koufopanos et al. [12]. The heat of reaction of pyrolysis was modeled by Lee et al. [13], and the effects of anisotropy of a pyrolyzing
medium was considered by Kansa et al. [10]. Maa
and Baille [9] proposed an “unreacted shrinking core model” for high-temperature pyrolysis. Miyanamie [14] probed into the effects of heat of reaction and Lewis number in the pyrolysis model. For the motion of gases within a solid, a study included a momentum equation [10]. Fan et al. [15] developed a “volume reaction” model that takes into account simultaneous heat and mass transfer in a particle. Pyle and Zaror [1] experimentally investigated the pyrolysis of biomass. Simmons [16] analyzed a simplified heat transfer model with an assumed first-order reaction to estimate an upper bound for biomass particle size in the implementation of
experimental pyrolysis kinetics. Villermaux et al.
[17] presented a volatilization thermal penetration model for any kind of solid reaction, wherein volatilization is controlled by heat conduction from an outer surface. In modeling the pyrolysis of biomass particles, particularly in relation to kinetic, thermal, and heat transfer effects, Koufopanos et al. [12] assumed the pyrolysis process to be constituted by primary and secondary kinetic reactions. Di Blasi [18] delved into the effects of convection and secondary reactions within porous solid fuels that undergo pyrolysis. Melaaen and Gronli [19] presented models on moist wood drying and pyrolysis, and Jalan and Srivastava [20] explored kinetic and heat transfer effects on the pyrolysis of a single biomass cylindrical pellet. Ravi [21] proposed a semi-empirical model for the pyrolysis of sawdust in an annular packed bed by using a pseudo first-order reaction for the chemical reactions occurring during pyrolysis. In their model, Babu and Chaurasia [22] considered the time-dependent density and temperature-dependent specific heat capacity of biomass to investigate the dominant design variables involved in the pyrolysis of geometrically different
biomass particles in a thermally thick regime. In recent research, Sheth and Babu [23] presented a kinetic model for biomass pyrolysis and concluded that pyrolysis in wood is typically initiated at 200°C and lasts up to 450°C–500°C, depending on wood
species. Yang et al. [24] indicated that the major
stage of biomass pyrolysis occurs between 250°C
and 450°C. Mandl et al. [25] pointed out that the
pyrolysis of softwood pellets takes place at around 425 K and that char particles and volatiles are formed at this temperature. Weerachanchai et al. [26] submitted that the major decomposition of all biomasses occur in the range of 250°C–400°C. In
their study on poplar wood, Katarzyna et al. [27]
concluded that the decomposition of hemicelluloses and cellulose take place in active pyrolysis at a range of 473–653 K and 523–623 K, respectively. They further stated that lignin decomposes in both active and passive pyrolysis at a range of 453–1173 K without characteristic peaks.
In providing solutions to the heat conduction equations for pyrolyzing solids, most published studies have resorted to numerical methods (approximation methods) because of the nonlinear nature of developed models. Some other research works have followed suit, using numerical approaches to solve nonlinear problems [2–4]. Nevertheless, the classical method of identifying analytical solutions remains essential because it serves as an accurate benchmark for numerical solutions. Experimental data facilitate access to mathematical models but are never sufficient to verify the numerical solutions of established mathematical models. Comparisons of numerical calculations and experimental data often fail to reveal the compensation done for modeling
deficiencies through computational errors or
unconscious approximations in establishing
applicable numerical schemes. Analytical solutions to specified problems are essential for the
development of efficient applied numerical
costs, as well as the task involved in the analysis of real-world problems. Moreover, the analytical solutions (exact/closed-form solutions) of models developed in the study under investigation have been
stated to be “involved” [28]. Ojolo et al. [29]
developed an analytical solution for kinetic and heat transfer models in the slow pyrolysis of cylindrical biomass particles in conditions wherein the outer boundary of the particles is subjected to convective and radiative heat transfer. Bidabadi et al. [30] put forward an analytical model for flame propagation through moist lycopodium particles, and Dizaji and Bidabadi [31] analytically examined the kinetics of different processes in the pyrolysis of lycopodium
dust. Recently, Lédé, and Authier [32] advocated for
criteria for characterizing fast pyrolysis on the basis of the temperature and heating rate of solid particles that undergo thermal decomposition.
Previous studies have been limited to a specific biomass shape when the outer boundary of biomass particles is subjected to convective and radiative heat transfer. To the best of the authors’ knowledge, no research has been carried out on the analytical solutions of thermal models for differently shaped biomass particles, the analytical study of the effects of biomass particle shapes on the thermal decomposition of the particles, and the effects of different outer boundary and heating conditions on the pyrolysis of biomass. Likewise, little effort has been exerted to quantify the heating rates of different pyrolysis technologies, which are paramount to biomass conversion processes. To address these deficiencies, the current study developed analytical solutions of kinetic and heat transfer models for the pyrolysis of biomass particles with different regular shapes under different outer boundary and heating conditions. Simulations were carried out to illuminate the effects of various parameters on the pyrolysis of the particles.
2. Theoretical background
Gaseous surroundings transfer heat to the surface of biomass particles through conduction, radiation, and/or convection and then to the interior of the particles mainly by conduction. The temperature inside the particles increases as heat increasingly penetrates into the interiors of the solid, thereby causing moisture evaporation (i.e., The interiors dry out.). The rate of drying depends on the temperature, velocity, and moisture content of a drying gas, as well as the external surface area of a feed material, the internal diffusivity of moisture, the nature of bonding between moisture and the material, and radiative heat transfer. As temperature increases, the biomass particles decompose into charcoal, tar, and gaseous products. The quantities of each of these products vary, depending on the zonal temperature, rate of heating, structure, and composition and size of catalysts. At high temperatures, the rate of thermal decomposition or pyrolysis is not only controlled by
heat transfer but also influenced by heat of reaction, bed or particle shape/length, air flow rate, and the initial moisture content of solid fuel.
3. Model assumptions
The following basic assumptions were formulated in the development of the models used in this work:
i. The properties of the solid fuel (biomass) are
constant and independent of temperature, and heat transfer within its particles is one-dimensional.
ii. The rate of volatilization of the solid fuel
increases with temperature, in accordance with the Arrhenius law.
iii. The reaction rate of the solid fuel is of first-order
type under both primary and secondary pyrolysis processes. The biomass is completely converted into gas, char, and tar.
iv. The contribution of the bulk motion (i.e.,
convection) of gases inside the pores of a solid particle is disregarded because the resistance offered by the pores in the particle is so high that gas transport takes place essentially by a diffusion mechanism and not by bulk motion. v. The effects of the porosity of a solid pellet is
negligible given that dense particles and various kinds of hard wood are generally used in biomass pyrolysis and gasification. No moisture content and no particle shrinkage occur.
4. Heat transfer and pyrolysis kinetics of biomass particle models
4.1 Heat transfer model
Under the above-mentioned assumptions, the heat conduction equation for biomass particles of different shapes is given by
(1)
where
and
Ћ= x, n=0 for rectangular particles Ћ= r, n=1 for rectangular particles Ћ= r, n=2 for rectangular particles
The initial conditions are
(2a)
The boundary conditions are
(2b)
In the model above, the energy transport due to volatile evolution and diffusion is disregarded.
n
p n reaction
T K T
c Q
t
o
T T
t 0,
0 ,
0
0
T t
4 4
,
0 k T hT T T T
t f f
H
T R
E g Ae k
Therefore, the resultant solution holds only for relatively slow (compared with heat transfer) kinetic rates. Given that the area characterized by slow kinetic rates is the region of interest, no loss of information occurs. In cases of relatively slow kinetic reactions or studies focusing on initial rates, densities and physical properties can also be assumed constant [16].
4.2 Two-stage kinetic model
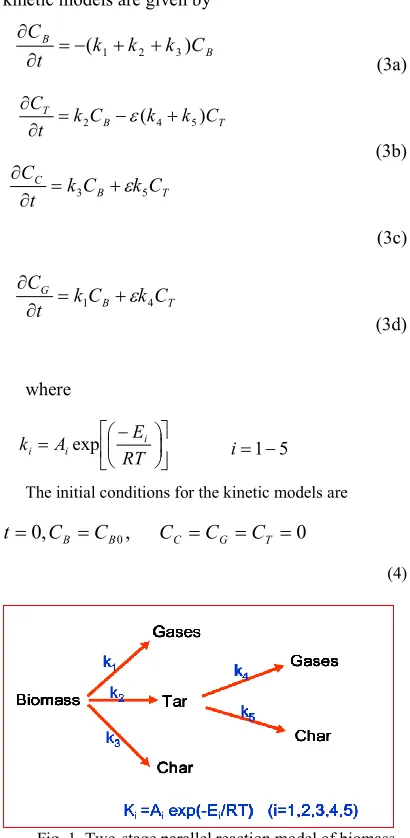
The kinetic scheme shown in Fig. 1 depicts the pyrolysis process (primary and secondary), which involves the thermal decomposition of biomass into gases, tar (liquid product of biomass pyrolysis, known as bio-oil or pyrolysis oil), and char. Tar further decomposes into char and gases.
Under the described kinetic scheme, the pyrolysis kinetic models are given by
(3a)
(3b)
(3c)
(3d)
where
The initial conditions for the kinetic models are
(4)
Fig. 1. Two-stage parallel reaction model of biomass pyrolysis
for which ‘Q’ (the term for the pyrolysis enthalpy source originating from conversion) in eq. (1) is
identified according to a two-step reaction
mechanism thus:
(5)
5. Analytical solutions for heat transfer in rectangular particles
Under the assumptions adopted in this work, the heat conduction equation for rectangular biomass particles is given by
(6)
Substituting eq. (5) into eq. (6) yields
(7)
5.1 Case 1: Particle Surface Temperature with Convective and Radiative Heat Transfer
The first case considered in this work is when the outer boundary of biomass particles is subjected to convective and radiative heat transfer. This is a common case in most studies.
The initial and boundary conditions are as follows:
(8)
5.2 Case 2: Particle surface temperature with high external heating fluxes
The second case considered is heat transfer in biomass particles during pyrolysis. It is assumed that in the second boundary condition, the surface temperature of a slab is specified with the high external heating fluxes available through the use of radiation, fluid beds, or other devices [16].
The initial and boundary conditions are
(9)
The reaction rate coefficient is “exponential” with temperature, thus rendering eq. (1) nonlinear and difficult to solve analytically. However, a linearized
2 2
p reaction
T T
c K Q
t x
o
T T
t0,
0 ,
0
0
x
x T t
4 4
,
0 hT T T T
x T k
t f f
L x
o
T T
t0,
0 ,
0
0
x x T t
0 0, x L
t T T
0
G T
C C C
C , ,
0CB CB0
t
3 5
1 4
reaction i B i i T i
i
Q k C h k C h
2 3 5
2
1 4
p i B i i T i
i
T T
c K k C h k C h
t x
B B
C k k k t C
)
( 1 2 3
T B
T k C k k C
t C
)
( 4 5
2
T B
C k C k C
t C
5 3
T B
G kC kC
t C
4 1
RT E A
k i
i
form that is expanded around the reactor temperature by using Taylor’s series significantly simplifies the calculation. The use of this expansion is justified because reaction rate drops very rapidly with temperature. Because the region of primary interest lies within about 10°C of the reactor temperature, a linearized rate constant is a good approximation [16].
(10)
Given the expansion, eq. (5) can be converted into
3 2 1 5 2 4
1 ( )
1 ( )
i
g o
i
g o
E
R T i
reaction i o B i
i g o
E R T i
i o T i
g o
E
Q A e T T C h
R T
E
A e T T C h
R T
(11a) Eq. (11a) can be expanded and expressed as3 5 1 4 3 5 2 2 1 4 ( ) i i
g o g o
i i
g o g o
E E
R T R T
reaction B i i T i i
i
E E
R T R T
i i
B i i T i i o
i g o g o
Q C h A e C h A e
E E
C h A e C h A e T T
R T R T
(11 b)Eq. (11b) can also be written as
1
(
)
reaction o o
Q
T
T
(12) where3 5
1 4
i i
g o g o
E E
R T R T
o B i i T i i
i
C h A e C h A e
3 5
1 2 2
1 4
i i
g o g o
E E
R T R T
i i
B i i T i i
i g o g o
E E
C h A e C h A e
R T R T
The expansions above can be carried out without loss of generality. Substituting eq. (12) into eq. (1) yields
(13)
Using the following dimensionless parameter to transform the equations, the initial and boundary conditions for a nondimensionless form are
(14)
The heat transfer model is developed into a dimensionless form, as shown in eq. (14).
(15)
The initial and boundary conditions are
(16)
where
5.3. Analytical solution for case 1
Applying the Laplace transform to eq. (8), we arrive at
(17)
The initial and boundary conditions in the Laplace domain are expressed thus:
(18)
Substituting the initial conditions into eq. (18) results in
(19)
The complete solution of differential eq. (19) is written as
(20)
where
Using the boundary conditions, we derive
B=0 (21) Thus, the solution in the Laplace domain is
(22)
2
1 ( )
i g o E R T i o g o E
k Ae T T
R T
2 0 12
(
)
p o
T
T
c
K
T
T
t
x
1(Tf To)
, L x X 2 0 0 2 0 0 , , , ( )
f p f
T T Kt L
T T c L K T T
2
2 (1 )
X
0, , 0 0
0, 0, 0
0, 1, m(1 )
X X X X Bi X
3 2 2 3
( f f f
m h T TT T T T
K L
Bi
) 1 ( ) 0 , ( 2 2 s X X s
0, , 0 0
0, 0, 0
1
0, 1, m
X
s X
X
s X Bi
X s 2
2 (s )
X s
cosh ( ) sinh ( )
( )
A s X B s X
s s s Bi s s s s Bi A m m cosh sinh 1 ) (
cosh ( ) 1 1
sinh cosh 1 1 1
m m
m
s X
s s s s Bi s
Bi
Bi s s
We can write eq. (22) as follows:
(23)
Applying the inverse Laplace transform to eq. (23) yields the following equation:
(24)
The rate of dimensionless heat transfer through solid particles is given by
(25)
where represents the roots of Bim cos(βn) + βn sin(βn) = 0.
Although cellulose and wood are endothermic [9, 11], for completeness, the solution for exothermic reactions is rendered as follows:
(26)
Applying the inverse Laplace transform to eq. (26) yields
(27)
The rate of dimensionless heat transfer through the solid particles is given by
(28)
5.4. Analytical solution for case 2
Following the same procedure as that in the integral solution of case 1, the solution of case 2 in the Laplace domain is given as
(29)
Applying the inverse Laplace transform to eq. (29), we obtain
(30)
The rate of dimensionless heat transfer through solid particles is derived with
(31)
For exothermic reactions, the following equation is obtained:
(32)
cosh ( )
{ ( ) sinh ( ) cosh ( )}
cosh ( )
( ){ ( ) sinh ( ) cosh ( )
1 1 1
m m
m
s X
s s s Bi s
Bi
s X
s s s Bi s
s s 2 2 ( ) ( ) 2 2 1 1
cos( ) cos( )
2 2
(1 ) (1 ) ( ){cos( ) sin( )} {(cos ) sin }
cosh 1 1 1 cosh sinh n n n n m m n n
m n n n n n n
n n
m m m
X e X e
Bi Bi
Bi
X e
Bi Bi Bi
2 2 , ( ) 2 1 ( ) 1 sin( ) 2 (1 )
( ){(cos ) sin( )}
sin( ) 2
1
{(cos ) sin }
sin cosh sinh n n R d n n m n
n n n
n
m
n n
m n
n n n
n m e Bi Bi Q e Bi Bi
n cosh ( ) 1 1
sinh cosh 1 1 1
m m
m
s X
s s s s Bi s
Bi
Bi s s
2 2 ( ) 2 1 ( ) 2 1 cos( ) (1 )
{(cos ) sin }
2
cos( ) 2
(1 )
( ){cos( ) sin( )}
cos 1 1 1 cos sin n n n m
n n n
n n m n m n
n n n
n
m m m
X e Bi Bi X e Bi X e
Bi Bi Bi
2 2 ( ) 1 ( ) 2 1 sin( ) (1 ) {(cos ) sin } 2sin( ) 2
(1 ) ( ){cos( ) sin( )}
sin cos sin n n n m
n n n
n n m d n n m n
n n n
n m e Bi Bi Q e Bi Bi
cosh ( )
1 1 1
( ) cosh
1 1 1
s X
s s s s
s s 2 2 2 2 2 1 2 1 2 1 2 3 3 1 cosh 1 1 1 cosh 2 1
( 1) cos
1 4 2
(2 1)
2 1
( 1) cos
16 2 (2 1) n n n n n n X e n e X n n e X n
2 2 2 2 2 1 2 1 1 2 1 , 2 1 3 2 1sinh 2 2 1
( 1) sin
2 cosh
1
2 1
( 1) sin
8 2 (2 1) n n n n R d n n n e Q n e n
cosh ( )
1 1 1
( ) cosh
1 1 1
s X
s s s s
Applying the inverse Laplace transform, we have
(33)
The rate of dimensionless heat transfer through solid particles is given by
(34)
5.5 Temperature distribution model for cylindrical particles
If Laplace and Hankel transforms are used for cylindrical particles in the case of convective and radiative heat transfer, we derive
(35)
where n denotes the roots of the equation for βn > 0. J0(n), J0(nβ), and J1(n) are the Bessel functions of the first kind. These are calculated as follows: 5.6 Temperature distribution model for spherical particles Applying the Laplace transform to spherical particles in the case of convective and radiative heat transfer, we have the (36) In eq. (36), represents the roots of βn cos(βn) + Bim sin(βn) = 0. The solutions of kinetic models (3a)–(3d), derived using the Laplace transform, are (37a) (37b) (37c) (37d) Table 1: Values of the parameters employed in this study S/N Parameter description Symbol Value used Source 1 Bulk density of wood ρ 650 kg/m3 [22]
2 Thermal conductivity of wood K 0.1256 W/mK [1]
3 Initial temperature of wood To 303 K [1]
4 Half-length of particle L 0.003 m [22]
5 Convective heat transfer coeff. h 8.4 W/m2K [1]
6 Final reactor temperature Tf 643 K [22]
7 Porosity of wood particle ε 0.4 [24]
8 Apparent activation energy A 300 s-1 [1]
9 Modified Biot number Bim 0.82-1.22 - 10 Specific heat transfer capacity Cp 1670 J/kgK [1]
11 Emissivity of wood ϵ 0.95 [1]
12 Stefan–Boltzmann constant σ 5.67×10⁸ W/m2K4 [37]
2 2 2 2 2 1 2 1 2 1 2 3 3 1 2 1
( 1) cos
cos 1 4 2
1 1
(2 1) cos
1
2 1
( 1) cos
16 2 (2 1) n n n n n n n e X X e n n e X n
2 2 2 2 2 1 2 1 1 2 1 , 2 1 3 2 1sin 2 2 1
1 ( 1) sin
2 cos
1
2 1
( 1) sin
8 2 (2 1) n n n n R d n n n e Q n e n
1 2 3
2
4 5
4 5 1 2 3
exp{ ( ) }
exp{ ( )
{ ( ) ( )}
Bo T
k k k t
C k C
k k t
k k k k k
3
1 2 3
1 2 3
1 2 3
1 2 3
2 5
4 5 1 2 3
4 5 4 5
[1 exp{ ( ) }]
( )
1
[1 exp{ ( ) }]
( )
1
{ ( ) ( )}
[1 exp{ ( ) }]
( )
Bo C
Bo
C k
C k k k t
k k k
k k k t
k k k
C k k
k k k k k
k k t
k k } ) (
exp{ k1 k2 k3 t
C
CB Bo
0 2 2 0 ) 1 ( ! 2 ) 1 ( ) ( m m m m m mJ
0 2 2 0 ) 1 ( ! 2 ) ( ) 1 ( ) ( m m m m m m n n
J
0 2 2 1 ) 2 ( ! 2 ) 1 ( ) ( m m m m m mJ
n 2 2 2 ( ) 1 0
2 2 2
1 0
1 0
2 2 2 2
1 0 {( ( ) ( )} ( ) { } ( )( ) ( ) 2 { ( )} ( ) ( )( ) ( ) n
n n n n
n
n n m n n
n n n
n n m n n
J J R
e
Bi J
J J R
Bi J
11 2 3
1 2 3
1 2 3
1 2 3
2 4
4 5 1 2 3
4 5
4 5
[1 exp{ ( ) }]
( )
1
[1 exp{ ( ) }]
( )
1
{ ( ) ( )}
[1 exp{ ( ) }
( )
Bo G
Bo
C k
C k k k t
k k k
k k k t k k k
C k k k k k k k
k k t k k 0 ] [ ) ( )
( 0 1
1
0
R m n R
n J Bi
R
J
2 2 ( ) 2 1 ( ) 2 1 sin( )
( ){(cos ){ } sin } 2
sin( ) ( 1)
{(cos ){ } sin }
1 2sin
1 ( 1)
cosh n n n m n
n n n
n
m
n
m n
n n n
n m R e Bi Bi R e Bi R e Bi
Table 2: Values of parameters employed for kinetics
S/N Parameter description Ai (s-1) Ei (Kj/mol) Source
1 Biomass Gas 1.3×10⁸ 140 [11]
2 Thermal conductivity of wood 2.0×10⁸ 133 [11]
3 Initial temperature of wood 1.08×10⁷ 121 [11]
4 Half-length of particle 4.28×10⁶ 107 [34]
5 Convective heat transfer coeff. 1.0×10⁶ 107 [34]
6. Results and discussion
6.1 Effects of isothermal heating temperature on biomass pyrolysis yields
The two-stage parallel reaction model used in this work (The model is the most classical one used for wood pyrolysis [39].) indicated that as the temperature in the pyrolysis zone increases, the
biomass undergoes thermal degradation in
accordance with primary reactions that generate gas, tar, and char products. Tar also undergoes secondary reactions and thus produces gas and char. As previously stated, the quantities of each of these products vary, depending primarily on the zonal temperature, rate of heating, and size of a particle. These factors were thus subjected to parametric analysis.
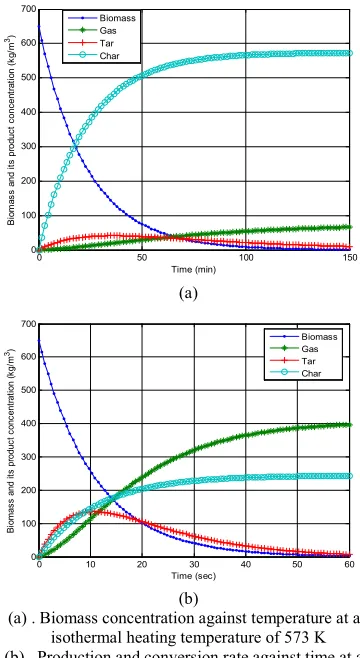
Figs. 2a and 2b illustrate the effects of isothermal heating temperature (wherein pyrolysis temperature is maintained at a constant level in a pyrolyzing chamber) on pyrolysis yield, as predicted using the model developed in this study. The results indicated that for biomass particles of the same size, thermal decomposition takes more time at temperatures of 474 and 573 K than at higher isothermal heating temperatures of 673 and 773 K. The figures show that low-temperature pyrolysis produces more char and that high-temperature pyrolysis enhances the production of gas and tar. That is, an increase in isothermal heating temperature increases the yield of gaseous products and decreases char production. The reduced production of tar and gas at low isothermal heating temperatures may be due to some resistances to mass or heat transfer inside the particles of the biomass.
Such resistances can be broken by high heating temperatures, thereby resulting in the greater primary decomposition of a sample and a higher production of gas and tar. In each case of isothermal heating, as pyrolysis reaches completion, char production becomes constant. The findings also showed that tar yield first increases and then decreases and that gas yield increases as pyrolysis temperature rises. By contrast, char yield significantly decreases as isothermal temperature increases to 573 and 673 K. The decrease in tar yield and the sudden increase in gas yield at high temperatures may be attributed to the secondary cracking of the pyrolysis liquid into a gaseous product at such temperatures. The results also suggest that the time required to achieve a certain conversion level decreases with increasing isothermal heating temperature. The trends observed in this work are qualitatively identical to those reported in the literature [23, 24].
(a)
(b)
(a) . Biomass concentration against temperature at an isothermal heating temperature of 573 K (b) . Production and conversion rate against time at an
isothermal heating temperature of 773 K
6.2 Effects of non-isothermal heating rates on biomass pyrolysis yields
Heating rate is an important parameter for the yields of different products from the pyrolysis process. To determine the effects of heating rate on the yields of the biomass pyrolysis in this research, simulations were carried out at heating rates of 10 and 50 K/s (Figs. 3a–3d, Figs. 4a–4d). The effects of non-isothermal temperature on pyrolysis yields as functions of time are presented in Figs. 3a–3d, and the effects of non-isothermal temperature on pyrolysis yields as functions of temperature at an initial particle temperature of 373 K are depicted in Figs. 4a–4d. As seen in the figures, the drying process or pre-pyrolysis generates zero production; the conversion of the products took 0–120 s at 303– 473 K, thus validating reports that pyrolysis commences at about 473 K [23]. Surprisingly, at any heating rate, char production is higher than that of tar and gas production. This result may be ascribed to the increase in resistance to mass and heat transfer; such resistance is enabled by the thick layer of the dried biomass. That is, for gas and tar to be converted from biomass particles, they have to travel through a dried layer of biomass, which in turn, comparably reduces their production rates. Note that
0 50 100 150
0 100 200 300 400 500 600 700
Time (min)
B
io
m
a
s
s
a
nd i
ts
pr
od
uc
t
c
onc
en
tr
a
ti
o
n (k
g
/m
3)
Biomass Gas Tar Char
0 10 20 30 40 50 60
0 100 200 300 400 500 600 700
Time (sec)
Bi
o
mas
s
a
n
d
it
s
p
ro
d
u
c
t
c
o
n
c
e
n
tr
a
tio
n
(
k
g
/m
3)
increasing heating rates reduces the residence time of particles; as heating rates increase, the residence time of volatiles at low or intermediate temperatures decreases. Most of the reactions that favor tar conversion into gas occur at high temperatures. At low heating rates, volatiles have sufficient time to escape from the reaction zone before significant cracking can occur. Most of the decomposition takes place at temperatures lower than 500 K, and no significant decomposition is further produced above 750 K. A comparison of the results with those regarding isothermal heating conditions showed that the amount of char produced in non-isothermal heating conditions is lower than that generated in isothermal heating conditions. This phenomenon is attributed to the fact that the isothermal conditions in this work were implemented at relatively low temperatures and that the residual solid contains compounds that evaporate at high temperatures. Tar yield is low at low heating rates and slightly increases with rising heating rate. Gas yield increases with a rise in heating rate, whereas char yield decreases significantly with increasing heating rate. The increase in tar yield with rising heating rate may be due to some resistances to mass or heat transfer inside the particles of the biomass. However, increasing heating rates overcomes the constraints to heat and mass transfer during pyrolysis and thereby increases tar yield and decreases char formation. As shown in Figs. 4a–4d, the rate of char production increases gradually between particle temperatures of 500 and 573 K. As particle temperature increases, gases and tar emerge from the biomass particles, consequently increasing the rate of char production rapidly at temperatures of 500–723 K. Beyond this range, the production rate of char declines (because of the loss of hydrogen and oxygen contents in char at high temperatures) until the entire wood is pyrolyzed. This finding shows that pyrolysis slows down at 723–873 K (depending on heating rate). The results also suggest that the primary pyrolysis rate of tar production starts gradually from about 573 to 753 K (depending on heating rate) and then increases rapidly until tar is entirely converted into char and gas at the final pyrolysis temperature. The movement of rate and temperature toward the negative portion of the graph depicts the conversion rate of tar into
char and gas as shown in Fig. 4d.
6.3 Effects of heating rate on particle residence time
The effects of heating rates on particle residence time are shown in Figs. 5a–5d. For low heating rates of 0.01–0.1 K/s (Fig. 5a), pyrolysis entails hours or days, thereby enhancing the production of charcoal, as confirmed by Table 3.
As heating rates increases, the particle residence time in the reactor decreases and high heating rates favors the production of tar and gas. As shown in Table 3, the length of heating and its intensity affect the rate
and extent of pyrolytic reactions, the sequence of these reactions, and the composition of resultant products.
(a)
(b)
(c)
(d)
(a). Biomass and variations in its product concentration at a heating rate of 10 K/s
(b). Production/conversion rate of biomass and its products with time at a heating rate of 10 K/s
(c). Biomass and variations in its product concentration at a heating rate of 50 K/s
(d). Production/conversion rate of biomass and its products with time at a heating rate of 50 K/s
0 5 10 15 20 25 30 35 40 45 50
0 100 200 300 400 500 600 700
Time(s)
Bi
o
mas
s
a
nd
it
s
p
rod
u
c
t
c
on
c
e
n
tr
at
ion
(
k
g/
m
3)
Biomass Gas Tar Char
0 5 10 15 20 25 30 35 40 45
-10 -8 -6 -4 -2 0 2 4 6 8
Time(s)
P
ro
du
ct
io
n/
Co
nv
er
si
on
r
at
e(k
g/
m
3s)
Biomass Gas Tar Char
0 1 2 3 4 5 6 7 8 9 10
0 100 200 300 400 500 600 700
Time(s)
B
ioma
ss
and
its
pr
od
uc
t
con
cent
rat
ion
(k
g/m
3)
Biomass Gas Tar Char
0 2 4 6 8 10 12
-30 -20 -10 0 10 20 30
Time(s)
P
ro
du
ct
ion
/Co
nv
er
sion
r
at
e(
kg
/m
3s)
(a)
(b)
(c)
(d)
(a) . Biomass and variations in its product concentration at a heating rate of 10 K/s
(b) . Production/conversion rate of biomass and its products with temperature at a heating rate of 10 K/s (c) . Biomass and variations in its product concentration at
a heating rate of 50 K/s
(d) . Production/conversion rate of biomass and its products with temperature at a heating rate of 50 K/s
(a)
(b)
(c)
(d)
(a) .Variations in biomass part\icle residence time at very low heating rates
(b) . Variations in biomass particle residence time with heating rates of 10–100 K/s
(c) . Variations in biomass particle residence time at heating rates of 100–200 K/s
(d). Variations in biomass particle residence time at heating rates of 200–200 K/s
400 450 500 550 600 650 700 750 800 850 900 0
100 200 300 400 500 600 700
Temperature(K)
Bi
om
as
s
an
d
its
p
rod
uc
ts
c
on
cen
tra
tion (
k
g/
m
3)
Biomass Gas Tar Char
400 450 500 550 600 650 700 750 800 850
-10 -8 -6 -4 -2 0 2 4 6 8
Temperature(K)
P
ro
du
c
tio
n/
C
on
ve
rs
io
n
ra
te
(k
g/
m
3s)
Biomass Gas Tar Char
400 450 500 550 600 650 700 750 800 850 0
100 200 300 400 500 600 700
Temperature(K)
B
io
m
ass
a
nd
i
ts
p
rod
uc
ts
c
on
c
e
nt
rat
io
n
(k
g/
m
3)
Biomass Gas Tar Char
400 450 500 550 600 650 700 750 800 850 900
-40 -30 -20 -10 0 10 20 30
Temperature(K)
Pr
od
uc
tion
/C
on
ver
si
on
rat
e(
kg/
m
3s)
Biomass Gas Tar Char
0.01 0.02 0.03 0.04 0.05 0.06 0.07 0.08 0.09 0.1 0
5 10 15 20 25 30 35 40 45 50
Heating rate(K/s)
Par
tic
le
r
e
s
id
e
nc
e
t
im
e
(
hr
)
10 20 30 40 50 60 70 80 90 100 5
10 15 20 25 30 35 40
Heating rate (K/s)
P
a
rtic
le
R
es
id
en
c
e
Tim
e
(
s
)
100 110 120 130 140 150 160 170 180 190 200 2.5
3 3.5 4 4.5 5
Heating rate (K/s)
Par
tic
le
R
e
s
ide
n
c
e
Ti
me
(s
)
200 400 600 800 1000 1200 1400 1600 1800 2000 0
0.5 1 1.5 2 2.5
Heating rate(K/s)
P
art
ic
le
R
es
id
en
c
e
Tim
Fig. 6. Temperature history of a particle at To=303 K, half
thickness=0.011 m, Tf=643 K
Table 3. Pyrolysis conditions for different pyrolysis technologies
Pyrolysis technology Residence time Heating rate Temperature (°C) Product
Carbonization days very low 400 charcoal Conventional 5-30 min low 600 oil, gas, char Fast 0.5-5 s very high 650 bio-oil Flash liquid <1 s high <650 bio-oil Flash gas <1 s high <650 chemicals, gas Ultra <0.5 s very high 1000 chemicals, gas Vacuum 2-30 s medium 400 bio-oil Hydropyrolysis <10 s high <500 bio-oil Conventional <10 s high <700 chemicals
Figs. 5a–5d indicate the quantitative values of heating rates and residence times for different pyrolysis products. Such data as these are rarely found in extant literature.
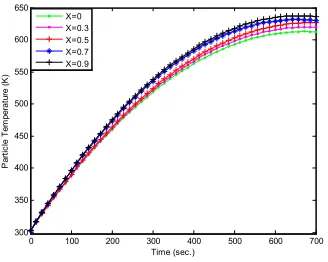
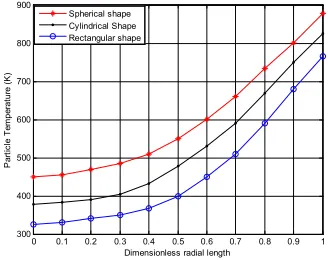
Fig. 6 shows the temperature histories of particles at different locations in a particle with 0.01 m half thickness when convective and radiative heat transfer occurs on the surface of the particle. The figure illustrates that the final pyrolysis temperature is reached at a duration of about 700 s. Fig. 7 displays the temperature profiles of particles at different time intervals when convective and radiative heat transfer occurs on the surface of a particle with 0.01 m half thickness. The higher the particle residence time in the reactor, the higher the particle temperature. Fig. 8 presents the temperature history of a particle with 0.003 m half thickness when constant temperature is applied to the surface of the slab/chip. As the constant wall temperature increases, the final duration at which pyrolysis is reached decreases; that means, pyrolysis is completed at a faster rate. Fig. 9 shows the temperature profiles at various time intervals of a particle with a half thickness of 0.005 m when a constant temperature of 600 K is applied to the surface of the slab/chip. The longer the pyrolysis time applied to the surface of the particle, the higher the pyrolysis temperature. Fig. 10 represents the effects of particle shape on the temperature of biomass pyrolysis. Among the particles, the spherical ones react most quickly under conditions wherein characteristic size is taken as the minimum particle
dimension. Although the temperature profiles of the three shapes follows the same trend, the pyrolysis process is fastest in spherical particles and slowest in rectangular particles, as depicted in Fig. 10. This difference, from a geometrical point of view, is due to the higher surface-area-to-volume ratio of spherical particles; this ratio confers the particles a stronger absorption capacity than that exhibited by cylindrical and rectangular particles. Given that the sphericity of particles exerts significant effects on the pyrolysis process, ensuring the effective and efficient performance of a biomass gasifier and optimal yield necessitates the use of spherical particles. Fig. 11 shows the effects of a modified Biot number on the biomass temperature histories, and Fig .6 shows the effects of the modified Biot number on the biomass temperature profiles. As the modified Biot number decreases, the temperature history at the center of thermally thick particles increases, indicating that temperature history is favored at modified Biot numbers lower than 1. Such conduction occurs because in enhancing the pyrolysis of biomass particles, more heat is needed for conduction within a particle than for convection and radiation to the particle surface. The results reflect the range of validity of Biot numbers for the one-dimensional analysis of biomass particles. The results in Fig. 6 indicate that an increase in Biot number enhances heat conduction through biomass particles, thereby increasing the temperature of particles along their length. As can be seen in Fig. 11, as Biot number decreases, the model becomes an increasingly good
predictor. The model is adequate at a Bim less than 1,
generating results that are almost indistinguishable from the experimental results of Pyle and Zaror [1]. Fig. 12 shows the temperature profiles predicted in this work on the basis of experiments and previous studies. A comparison confirmed good agreement between the experimental and analytical results predicted in this work. Fig. 13 provides a comparison of the temperature histories derived from the experiments, the models from previous works, and the predictions obtained through the closed-form solution developed in the current research. The experimental data were obtained from Pyle and Zaror [1], and the previously published theoretical results were taken from the numerical solutions put forward by Jalan and Srivastava [20] and Babu and Chaurasia [22] with respect to the center of a cylindrical pellet.
7. Conclusion
In this work, analytical solutions of kinetic and heat transfer during the pyrolysis of biomass particles with different shapes were developed. The models developed through the analytical solutions were used to investigate the kinetics of particle pyrolysis and the effects of heat of reaction, convective and radiative heat transfer, and particle shape and size on the pyrolysis of biomass particles.
0 100 200 300 400 500 600 700 300
350 400 450 500 550 600 650
Time (sec.)
P
a
rt
ic
le
Te
m
p
e
rat
u
re
(
K
)
Fig. 7. Temperature profile of a particle at To=303 K, half
thickness=0.011 m, Tf=753 K
Fig. 8. Temperature history of a particle at To=303 K, half thickness=0.003 m, Tf=643 K
6 Fig. 9. Temperature profile of a particle at To=473 K,
radius=0.005 m, Tconstant wall temp.=600 K
Fig. 10. Effects of particle shape on biomass pyrolysis temperature
Fig. 11. Effects of Biot number on biomass temperature distributions
Fig. 12. Comparison of temperature profiles in 11 min pyrolysis of biomass particles with a diameter of 0.011 m at a final pyrolysis temperature of 643 K
Fig. 13. Comparison of temperature histories for a biomass particle with a diameter of 0.003 m at a final pyrolysis
temperature of 643 K
The results derived with the proposed analytical models are in good agreement with previously
reported experimental findings. The average
percentage error and standard deviation of the experimental data are significantly lower in the prediction of the analytical model than in the predictions of previously proposed models. The current research presents considerable practical importance and physical significance in industrial pyrolysis applications and in the design of biomass gasifiers, reactors, and other similar equipment. The
0 0.1 0.2 0.3 0.4 0.5 0.6 0.7 0.8 0.9 1 400
450 500 550 600 650 700
Parti
c
le
Tempe
ra
tu
re
(
K
)
Dimensionless particle half length t = 120 sec.
t = 180 sec.
0 10 20 30 40 50 60 70 80 90 100 300
350 400 450 500 550 600 650 700 750 800
P
a
rt
ic
le
Te
m
p
e
rat
u
re
(
K
)
Time (sec.) Tf = 753 K
Tf = 780 K
0 0.1 0.2 0.3 0.4 0.5 0.6 0.7 0.8 0.9 1 480
500 520 540 560 580 600
P
a
rti
c
le
Te
mpe
ra
tu
re
(K
)
Dimensionless particle radius t = 15 sec.
t = 20 sec. t = 30 sec.
0 0.1 0.2 0.3 0.4 0.5 0.6 0.7 0.8 0.9 1 300
400 500 600 700 800 900
Dimensionless radial length
P
a
rt
ic
le
Te
m
pe
rat
ur
e
(K
)
Spherical shape Cylindrical Shape Rectangular shape
0 0.5 1 1.5 2 2.5 3 3.5
0 0.2 0.4 0.6 0.8 1
Dimensionless Particle Residence Time
D
im
e
ns
io
nle
s
s
P
a
rt
ic
le
Te
m
p
er
at
ur
e
Bim = 0.82
Bim = 1.12 Bim = 1.22
0 0.1 0.2 0.3 0.4 0.5 0.6 0.7 0.8 0.9 350
400 450 500 550 600 650 700 750 800 850
Dimensionless radial distance
Tempe
ra
tu
re
(
K
)
Pyle and Zaror (Experimental) Bamford et al model Babu and Chaurasia model Jalan and Srivastava model Present model
0 20 40 60 80 100 120 140 160 180 200 300
350 400 450 500 550 600 650 700 750
Time (s)
Tem
p
e
ra
tu
re
(
K)
findings showed that simple heat transfer models of primary pyrolysis are generally adequate and that, in some circumstances, very simple models function especially well in the low-temperature pyrolysis of biomass particles.
Acknowledgments
The authors thank the University of Lagos, Nigeria for providing an enabling environment for this research and supporting its completion.
Nomenclature
References
[1] D. L. Pyle, C. A. Zaror. Heat transfer and kinetics in the low temperature pyrolysis of solids. Chemical Engineering Science 39(1984.), 147–158.
[2] C. H. Bamford, J. Crank, D. H. Malan. The combustion of wood. Part I. Proceedings of the Cambridge Philosophical Society 42(1946)., 166– 182.
[3] A. F. Roberts, G. Clough. Thermal degradation of wood in an inert atmosphere. In: Proceedings of the ninth Symposium (International) on Combustion, The Combustion Institute, Pittsburgh,. 1963. 158– 167.
[4] W. D. Weatherford and D. M. Sheppard, 10th int.
Symposium on Combustion, the Combustion
Institute, Pitts., (1965), 897
[5] E. R. Tinney, The combustion of wood dowels in heated air. In: Proceedings of the 10th Symposium (International) on Combustion. The Combustion Institute, Pittsburgh, .1965. 925–930
[6] T. Matsumoto, T. Fujiwara and J. Kondo, 12th int.
Symposium on combustion, the combustion institute, pitts., (1969),.515.
[7] A. F. Roberts. 13th Int. Symposium on
Combustion, The Combustion Institute, Pitts. , (1971). 893.
[8] H. C. Kung. A mathematical model of wood pyrolysis. Combustion and Flame 18(1972)., 185– 195.
[9] P. S. Maa, and R. C. Bailie. Combustion Science and Technology, 7(1973), 257.
[10] E. J. Kansa, H. E. Perlee and R. F. Chaiken, R. Mathematical model of wood pyrolysis including internal forced convection. Combustion and Flame 29(1977), 311–324.
[11] W. R. Chan, M. Kelbon and B. B. Krieger, Modeling and experimental verification of physical and chemical processes during pyrolysis of large biomass particle. Fuel 64(1985.), 1505–1513. [12] C. A. Koufopanos, N. Papayannakos, G. Maschio and A. Lucchesi. Modelling of the pyrolysis of biomass particles. Studies on kinetics, thermal andheat transfer e4ects. The Canadian Journal of Chemical Engineering 69(1991.), 907–915.
[13] C. K. Lee, R. F. Chaiken, J. M. Singer. Charring pyrolysis of wood in 0res by laser simulation. In: Proceedings of the 16th Symposium (International)
on Combustion. The Combustion Institute:
Pittsburgh,. 1976, 1459–1470.
[14] K. Miyanami, L. S. Fan,L. T. Fan and W. P. Walawender. A mathematical model for pyrolysis of a solid particle—effects of the heat of reaction. The
Canadian Journal of Chemical Engineering
55(1977)., 317–325.
[15] L. T. Fan, L. S. Fan,K. Miyanami,, T. Y. Chen, and W. P. Walawender. A mathematical model for pyrolysis of a solid particle—effects of the Lewis number. The Canadian Journal of Chemical Engineering 55(1977)., 47–53.
[16] G. M. Simmons and M. Gentry. Particle size limitations due to heat transfer in determining pyrolysis kinetics of biomass. J. Anal. and Appl. Pyrolysis, 10(1986),117-127.
[17] J. Villermaux,B. Antoine., J. Lede, F. Soulignac. A new model for thermal volatilization of solid particles undergoing fast pyrolysis. Chemical Engineering Science 41(1986),, 151–157.
Ai Frequency factor, 1/s Bim Modified Biot number
C Concentration, kg/m3
Cp Specific heat capacity, J/kgK
E Activation energy, J/mol h Convective heat transfer
coefficient, W/m2 K
K Thermal conductivity, W/mK
ki; Rate constant, 1/s
Q Heat of pyrolysis, J/Kg r Radial distance, m
R Radius for cylindrical particles, m
Rg Universal gas constant, J/mol
t Time, s
Tf Final reactor temperature, K
T Temperature, K
R’ Dimensionless radial distance
Greek letters
ρ Bulk density of wood, Kg/m3
ρ∞ Ultimate density of wood,
Kg/m3
τ Dimensionless time θ Dimensionless temperature
ϵ Emissivity coefficient ε Void fraction of a particle σ Stefan–Boltzmann constant, W/m2 K4
α Heat of reaction number
Subscripts
B Virgin biomass G Gases
C Char
[18] C. Di Blasi. Analysis of convection and secondary reaction effects within porous solid fuels undergoing pyrolysis. Combustion Science and Technology 90(1993),, 315–340.
[19] M. C. Melaaen. and M. G. Gronli.. Modeling and simulation of moist wood drying and pyrolysis. In: Bridgwater, A.V., Boocock, D.B.G. (Eds.),
Developments in Thermochemical Biomass
Conversion. Blackie, London, 1997, 132–146. [20] R. K. Jalan and V. K. Srivastava.. Studies on pyrolysis of a single biomass cylindrical pellet– kinetic and heat transfer effects. Energy Conversion and Management 40 (1999),, 467–494.
[21] M. R. Ravi, A. Jhalani., S. Sinha andA. Ray. “Development of a semi-empirical model for pyrolysis of an annular sawdust bed”. Journal of Analytical and Applied Pyrolysis, 71(2004): 353-374.
[22] B. V. Babu and A. S. Chaurasia. Modeling for pyrolysis of solid particle: kinetics and heat transfer
effects. Energy Conversion and Management
44(2003), 2251–2275.
[23] P. N. Sheth and B. V. Babu. Kinetic Modeling of the Pyrolysis of Biomass National Conference on Environmental Conservation, Pilani, India; 2006, 453-458.
[24] Y. B. Yang, A. N. Phan, C. Ryu, V. Sharifi. andJ. Swithenbank, Mathematical modelling of slow pyrolysis of segregated solid wastes in a packed-bed pyrolyser Elsevier Journal of fuel.2006.
[25] C. Mandl, I. Obernberger and F.
Biedermann.Updraft fixed-bed gasification of
softwood pellets: mathematical modelling and comparison with experimental data In: proceedings of the 17, European Biomass Conference & Exhibition Hamburg, Italy, 2009.
[26] P. Weerachanchai, C. Tangsathitkulchai and M. Tangsathitkulchai. Comparison of Pyrolysis Kinetic Model for Thermogravimetric analysis of Biomass. Suranree Journal of Tecnologies 17(4) (2010), 387-400.
[27] K. Slopiecka, P. Bartocci and F. Fantozzi. Thermogravimetric analysis and Kinetic study of
poplar wood pyrolysis, 3rd International Conference
on Applied Energy, Perugia, Italy; 2011, 1687-1698. [28] C. A. Zaror “Studies of the pyrolysis of wood at low temperatures”. Ph.D Dissertation, University of Lordon, 1982
[29] S. J. Ojolo, C. A. Osheku and M. G. Sobamow. Analytical Investigations of Kinetic and Heat Transfer in Slow Pyrolysis of a Biomass Particle.
Int. Journal of Renewable Energy Development 2 (2) 2013: 105-115
[30] M. Bidabadi, S. A. Mostafavi, F. F. Dizaji, B. H. Dizaji. A