c
C. Bockstalleret al.,Published by EDP Sciences2015
DOI:10.1051/ocl/2014052
Available online at:
www.ocl-journal.org
Oilseeds & fats Crops and Lipids
OCL
R
esearch
A
rticle
– D
ossier
O
pen
A
ccess
C
RITÈRES DE DURABILITÉ
S
ustainability criteria
Issues in evaluating sustainability of farming systems
with indicators
Christian Bockstaller
1,2,, Pauline Feschet
1,2and Frédérique Angevin
31 INRA, UMR 1121 Agronomie et Environnement, INRA-Université de Lorraine, BP20507, 68021 Colmar Cedex, France 2 Université de Lorraine, UMR 1121, Agronomie et Environnement, BP20507, 68021 Colmar Cedex, France
3 INRA, UAR 1240 Eco-Innov, avenue Lucien Brétignières, 78850 Thiverval-Grignon, France
Received 14 November 2014 – Accepted 3 December 2014
Abstract – The growing concern about side-effects of policies focusing on economic growth or even technological innovations, as well as agriculture intensification leads more and more stakeholders to pay attention to the questions of monitoring and evaluation of agricultural practices. This step of evaluation is now essential in policy decision, in research and design of innovative solutions, in NGOs’ development projects, as well as in improvement process in ISO certification. The aim of this article is to review steps in the evaluation of sustainability in agriculture, starting in a first section with the necessity to develop a conceptual indicator framework to precise evaluators’ own vision of sustainability. In a second section, we address the necessity to answer preliminary questions that will guide the selection of a set of indicators or an assessment method. In a third section, after discussing the way to categorize indicators, we provide an overview of available indicators for two sustainability themes of the environmental dimension regarding respectively nitrogen management and biodiversity. In a fourth section, we highlight the diversity of evaluation methods of sustainability through six examples in France. Finally we conclude the article with a general discussion on questions that remain to address.
Keywords: Multi-criteria assessment/framework/aggregation/nitrogen management/biodiversity
Résumé – Choix d’un ensemble d’indicateurs pour évaluer la durabilité des pratiques agricoles. Le souci crois-sant au sujet des effets secondaires de politiques centrées sur la croissance économique ou des innovations technolo-giques mais aussi de l’intensification de l’agriculture conduit de plus en plus d’acteurs à s’intéresser à la question de l’évaluation et le suivi des pratiques agricoles. Cette étape de l’évaluation est devenue primordiale dans la décision pu-blique, dans la recherche de solutions innovantes, dans des projets développement d’ONG ou encore dans les démarches de progrès en certification ISO. L’objectif de cet article est de passer en revue les étapes d’une démarche d’évaluation de la durabilité en agriculture, en partant de la nécessité de développer un cadre conceptuel des indicateurs afin de préciser la vision de la durabilité de l’évaluateur. Dans une seconde partie, nous mettons en évidence la nécessité de répondre à des questions préliminaires qui vont guider le choix d’un ensemble d’indicateurs et/ou d’une méthode d’évaluation. Dans une troisième, après avoir discuté de la possibilité d’établir une typologie d’indicateurs, nous présentons une vue d’ensemble des indicateurs disponibles pour deux thématiques de la dimension environnementale, la gestion de l’azote et celle de la biodiversité. Dans une quatrième, nous illustrons la diversité des méthodes d’évaluation de la durabilité en agriculture au travers de six exemples français. Enfin, nous terminons l’article par une discussion sur les questions à approfondir.
Mots clés : Évaluation multicritère/cadre conceptuel/agrégation/gestion de l’azote/biodiversité
Correspondence:[email protected]
This is an Open Access article distributed under the terms of theCreative Commons Attribution License(http://creativecommons.org/licenses/by/4.0),
D
1 Introduction
Following the Rio conference in 1992, the environmental issue and, more generally, the question of sustainability be-came a concern in the developed countries and at the planet level. Though its ability to federate, this concept failed to meet
a consensus on its implementation until now (Robinson,2004)
so that Lacousmes (2005) spoke about a “driving illusion”.
However, the growing concern about side-effects of policies
focusing on economic growth or technological innovations, as well as agriculture intensification led more and more stake-holders to pay attention to the questions of monitoring and evaluation. This step of evaluation has become now essential in policy decision, in research and design of innovative solu-tions, in the NGOs’ development projects, as well as in
im-provement process in ISO certification (López-Ridauraet al.,
2005; Niemeijer and de Groot,2008). Thus, there is a general
agreement on the need of developing sustainability indicators that have to be organized in a conceptual framework to form an evaluation method. The use of indicators can be easily ex-plained by the impossibility to measure directly
environmen-tal impacts in routine outside of research context, or by diffi
-culties when addressing complex systems or concepts such as
biodiversity and sustainability (Graset al.,1989; Maurizi and
Verrel,2002). This has fostered a great development of studies
on indicators, especially in the agricultural sector (Riley,2001;
Rosnobletet al.,2006).
The aim of this article is to review steps in the evalua-tion of sustainability in agriculture, starting in Secevalua-tion 1 with the necessity to develop a conceptual indicator framework to precise evaluators’ own vision of sustainability. In Section 2, we address the necessity to answer preliminary questions that will guide the selection of a set of indicators or an assessment method. In Section 3, after discussing the way to categorize indicators, we provide an overview of available indicators for two sustainability themes of the environmental dimension re-garding respectively nitrogen management and biodiversity. In Section 4, we highlight the diversity of evaluation methods of sustainability through six examples in France. Finally we con-clude the article with a general discussion on questions that remain to address.
2 Different sustainability frameworks
Sustainability is by nature a multidimensional issue which addresses hence a set of criteria which can be simply organized
in a list or in a more complex framework (Ledouxet al.,2005).
In any case, a general conceptual indicator framework is a pre-requisite to any indicator selection to avoid a unconsidered and
even biased assessment of sustainability (Alkan Olssonet al.,
2009). Hansen (1996) distinguished between sustainability as
an approach of agriculture and sustainability as a property of agriculture. He separated the former between (i) an alternative ideology and (ii) a set of strategies, and the latter between (iii) an ability to fulfill goals and (iv) an ability to continue. If the first approach based on an ideology remains general and vague, the three others have been translated in operational
princi-ples that inspired different evaluation frameworks (Smith and
McDonald,1998). Defining sustainability as a set of strategies
or practices led to numerous assessment methods implement-ing a scorimplement-ing system of farmers’ practices like the IDEA
meth-ods for the environmental pillar of sustainability (Zahmet al.,
2008) or the indicator set of Rigby et al.(2001). The
goal-based approach of sustainability is also very common and en-compasses a framework based on a set of general goals often
divided in more operational goals (Bockstalleret al.,1997). An
example of an environmental general goal can be “preserving water quality” that can be translated into several operational goals like “reducing nitrate leaching” or “decreasing pesticide transfer to ground or surface water”. In some cases, the goals
can be quantified (e.g.“reducing the nitrate leaching byX%”).
In many other systems, goals are expressed more vaguely in
form of themes and sub-themes (e.g.Alkan Olssonet al.,2009;
Ledouxet al.,2005). In Life-Cycle Analysis focusing mainly
on the environmental dimension, goals refer to environmental
impacts derived from the cause-effect chain (Payraudeau and
van der Werf,2005). More recently, Life-Cycle Analysis was
applied to the social dimension (Falqueet al.,2013; Feschet,
2014). The last approach of sustainability referring to a
pro-priety of agriculture to continue was extended by several
au-thors to a set of systemic properties. Bossel (2000) proposed
six basic axes linked to systemic properties: existence, eff
ec-tiveness, freedom of action, security, adaptability, and
coexis-tence across totally different systems like cultural and social
systems, ecosystsms. López-Ridauraet al.(2005) collected a
long list of attributes or properties of sustainability to develop an assessment method of sustainability of small peasant farms in Mexico. Finally he focused on five main attributes: produc-tivity (ability to produce a combination of outputs), stability (to reproduce the former), reliability (ability to remain at an equilibrium state in normal conditions), resilience (ability to recover a normal stage following a perturbation) and adapt-ability or flexibility (adapt-ability to function in new conditions). Al-though this last approach is interesting in its genericity and in avoiding long list of indicators, its implementation raises problem when a property should be translated into concrete
indicators (Alkan Olssonet al.,2009).
Most of sustainability frameworks are structured across three sustainability dimensions or pillars: economic, environ-mental and social. Within each dimension, a list of items, goals, themes, etc. are defined. In some cases, those are orga-nized in a hierarchical way which leads the aggregation step
of indicators like for the MASC (Craheix et al., 2012) and
DEXiPM models (Pelzer et al.,2012), or in the method of
van Asselt et al. (2014). The property-based approach
pro-poses generic properties across the three dimensions of sus-tainability. A similar attempt was presented by Alkan Olsson
et al.,2009) for a goal-based indicator framework (GOF) that
classifies sustainability themes betweenultimate goal,process
to achieve(goal) andmeans(Alkan Olssonet al.,2009). This classification of themes across sustainability dimensions con-siders the action chain. A policy is motivated by one or several
ultimate goals(e.g.human health, viability, see Bossel (2000))
requiring some process to achieve it (e.g. balance of
Contribution to global issue
Global encompassing system (e.g. country continent, planet)
(e.g. energy, greenhouse gases, depletion of P, K
resources)
Local encompassing system (e.g. water catchment, région)
Contribution to local issue
(e.g. water quality, food chain supply)
Direct issue for the system
(e.g. soil protection, profitability) System studied
(e.g. field, farm)
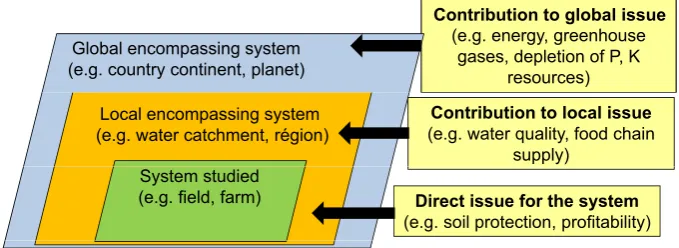
Fig. 1.Definition of system and related sustainability issues.
3 Preliminary choices
The clarification of a sustainability framework that struc-tures the indicator selection has to be completed by several
pre-liminary choices and assumptions (Bockstalleret al.,2008).
An initial diagnosis is required to identify the actual issues re-garding sustainability for a given system, to put in evidence stakeholders and participants implicated, processes involved, degree of severity of impacts etc. (answering therefore the
question:why to evaluate?).
The identification of the end-users (to evaluate for whom?)
and the definition of the practical objectives (to evaluate for
what?) of the indicator, were pointed out as an essential step by
several authors (Brooks and Bubb,2014; Girardinet al.,1999;
Mitchellet al.,1995). This preliminary steps will serve as a
basis to design or select indicators that meet end-users needs
and requirements. Different users groups can be identified like,
for example, scientists, advisors, farmers, decision makers, or consumers. The group of people doing the calculations and
the group of people using the results should be differentiated.
In many cases, although farmers are the targeted user group, they are actually not direct users of the evaluation method but
they are end-users of the results (Cerf and Meynard,2006).
It should be noticed that the position of users and end-users of results is in many cases not only driven by scientific
considera-tions (Bouleau,2012; Gudmundsson,2003). Indeed, they may
interest in the selection of indicators or their results to defend their interests.
An indicator can be developed for various objectives. Those can be ordered in three main usages: (i) to gain
knowl-edge about a system,e.g. ex postevaluation of an action at
the end or during its implementation, monitoring purpose with an alert role, or checking the respect of regulation. (ii) for
decision support:ex anteevaluation of actions in a planning
phase to select the “best” system (Sadoket al.,2008), decision
support in real time to drive the system, (iii) communication which implies a reduced number of indicators easy to
under-stand (Mitchellet al.,1995).
The design of a sustainability framework allows to define the issue of concerns or criteria to precise the content of
eval-uation (to evaluate what?). Those can be presented in form of
a set of strategies, of goals, themes, systemic properties, etc. as presented in the previous section. The definition of the sys-tem boundaries is another important step directly linked to the
previous one (Van Cauwenberghet al.,2007). It includes the
calculation scales, spatial and temporal (to evaluate where?
When?), the organizational level, which will be influenced by the user needs, the issues of concerns, etc. In Life Cycle Anal-ysis approaches (LCA), users are compelled to define the
sys-tem boundaries (Brentrupet al.,2004). It can be the product,
the farm including or not upstream such as production of
in-puts and offstream activities such as waste management. In
many other evaluation methods, this definition seems to be neither explicit nor unified between indicators. For example, in several methods indirect energy cost due to fertilizer, pesticide, machine production are included in the energy calculation like in LCA although for the rest of issues like water quality or emissions of pollutant to air, such approach is not implemented and only direct impact at field or farm level are covered. Re-garding spatial and time scales one should pay attention to the resolution of calculation and the level at which basic calcu-lations are carried out. Farm and year are typical resolution for environmental indicators. This should not be confused with
the extent,i.e.the whole area, (e.g.the region), or time span,
(e.g.the crop rotation), covered by the indicators calculation
(Purtaufet al.,2005).
Another aspect to consider is the differentiation between
the system itself and the encompassing systems that can be
separated between the local and the global ones (Fig.1). This
refers respectively to “on-site” (on the system) and “off-site”
issues (outside the system), (Smith and McDonald, 1998).
“On-site” issues (e.g. soil quality of farm fields) are linked
to the sustainability of the studied system (e.g. farm) while
“off-site” issues concern the encompassing system, (e.g.region
where the farm is located), or the society as a whole (Alkan
Olssonet al.,2009). The former refers to sustainability of
agri-culture itself, the latter may be considered as the contribution of agricultural systems to sustainable development. For the lat-ter, local and global issues can be distinguished. In any case, in the perspective of sustainability, a balanced choice between direct issues of the system, and contribution to local and global
issues should be done (Alkan Olssonet al.,2009).
Last but not least, means and resources should be assessed before selecting a method. It includes budget, time, data avail-ability, etc. to be sure that they meet the requirements of a se-lected method.
4 Different types of indicators
Different typologies were proposed to categorize the broad
variety of indicators proposed in the last decades. At the
D
Management * Management
Soil * Climate
Abiltiy to trace
Emission/state/impact
cause-effect relationship
Predictive effect
Measured Predictive effect
indicatorbased on
operational model
indicatorbased on
complex model
M(x1, … xn, p1,pk)
Causal indicator
x x x /x x x
Measured effect indicator
y1, y2
(e.g. number of birds
operational model
f(x1, …, xp)
(e.g. Flora-predict)
(e.g. Vegpop2)
x1, x2, x1/x2, x1-x2
(e.g. % semi-natural area)
(e.g. number of birds species)
Intégration of process of process
Feasibility
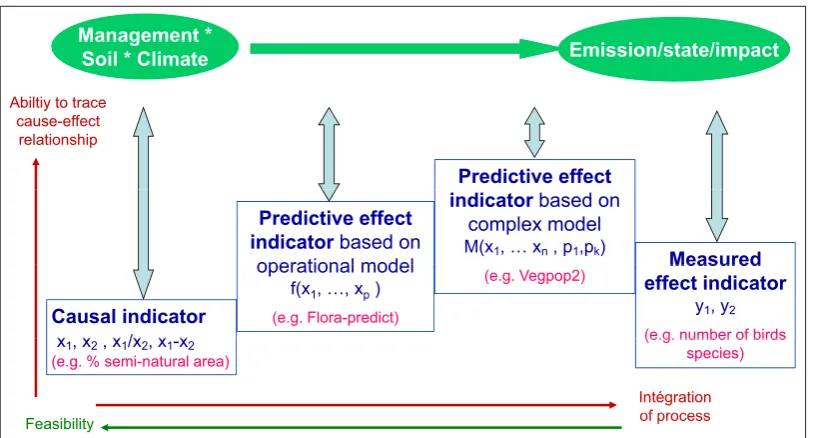
Fig. 2.Typology of indicators according to their nature (adapted from Bockstalleret al.,2011).
international level the well-known Pressure/State/Response
(PSR) and Driving-force/Pressure/State/Impact/Response
(DPSIR) frameworks were inspired by the cause-effect chain.
They were developed to ascertain the relevance of environ-mental indicators for human activities and their consequences at national level. These frameworks are extended by some
authors to lower scales (e.g. Maurizi and Verrel, 2002) in
spite of criticisms formulated by different authors (Niemeijer
and de Groot,2008). One major drawback is the impression
of linearity between pressure, state and impact given by the framework, whereas the reality is more complex and closer to a causal network than to a chain. Another flaw is the ambi-guity of the item, for instance pressure. Behind, you can find several types of indicators (see below). For example, pressure
encompasses emission indicators which can be measured (e.g.
nitrogen content at bottom of the root zone, measured by ceramic cup) or model output (from field leaching model), as well as simple indicators based on information from farmers’
management data (e.g.amount of nitrogen input).
Several authors made the difference between (i)
means-based indicators(van der Werf and Petit, 2002), or action-oriented indicators (Braband et al., 2003) using informa-tion on farmers’ practices or other causal variables; and (ii)
effect-based indicatorsorresult-oriented indicators, based on
an assessment of the effect at different stages of the
cause-effect chain. Concerning biodiversity, some authors also
dis-tinguished between indirect (means-based) and direct (eff
ect-based) indicators. However, observing that these classes still
cover indicators totally different like measurement or model
output, Bockstaller et al. (2011) and, Feschet and Lairez
(2015) proposed another typology taking into account the
na-ture and strucna-ture of the indicators. Here we propose an adap-tation of the former based on the following classes:
(i) Causal indicatorbased on a causal variable or a simple combination of variables of same nature (sum, product, ratio). Causal indicators can be based on management
variables or environmental variables (soil, climate, etc.). For the former, the term “means” is relevant but not for the latter;
(ii) Predictive effect indicators based on model output that can be operational (with a reduced and available number of input variables) or complex (from the research point of view, without considering the number and availability of input data);
(iii) Measured effect indicators based on field assessment or
observation.
Effect indicators may refer more precisely to different
stages on the cause-effect chain: emission, state or impact
(Bockstalleret al.,2008). As shown on Figure2, those types
do not show same qualities. Indicators belong to the groups of causal indicators and result in most cases in a poor pre-dictive quality whereas measurement indicators may provide more precise information about the state or the impact, with-out providing information on the causes. Predictive indicators
are useful forex anteassessment and to relate effect to cause
(Bockstalleret al.,2008). In any case, all those types have their
utility, causal indicator to highlight changes in management or
environment sensitivity, measured effect indicators for
mon-itoring, predictive indicators for analyzing cause-effect
rela-tions in order to improve the system.
5 Example of indicators and of evaluation
methods
In this section we illustrate the diversity of indicators for two major environmental issues: impact of nitrogen
man-agement and biodiversity. We also describe different
Category Number Scale Example
Input management 11 Farm,Year Storage capacitiya
Farm Field
Management
Good management 13 Farm, Field
Year Number of fertilizations
a
Ferlized area 4 Farm, Water catchment
Year
% reference area fertilized with
organic fertilizera
Nitrogen amount 20 Farm, Field, Cropping
system, Year Nitrogen rate
a, b
Nitrogen balance 31 Farm, Field
Pluriannual Farm-gate balance
a
Deviaon from the
recommended nitrogen rate 5
Farm, Field
Year
Deviaon from recommendaona
Producvity / Efficience 7 Farm, Field
Year Nitrogen use efficiency
b
Soil cover management 20 Field
Year
Bare soil during drainage
perioda
Sensivity of environemen o transfer 15
Field, Water catchment
Pluriannua DRASTIC
b
transfer Pluriannual
Nitrogen balance x Coefficient 3 Field, Cropping system
Pluriannual N-Index Tier-1
b
Qualitave operaonal model 5 Field, Cropping system
Y MERLIN
a, c p
Year, Pluriannual
Quantave operaonal model 17 Field, Cropping system
Year, Pluriannual IN INDIGO
d
Measurement of soil nitrogen 6 Field Soil mineralnitrogenb
Measurement of soil nitrogen 6
Year, Pluriannual Soil mineralnitrogen
Measurement of water quality 8 Water catchment, Field
Pluriannual Nitrate concentration
a
Emission/ state/impact
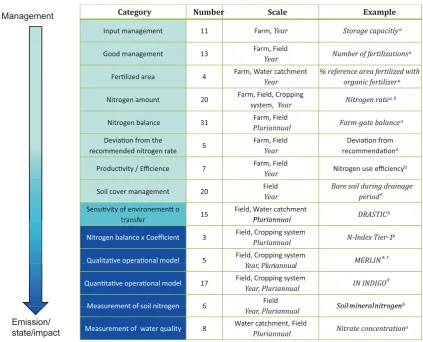
Fig. 3.Typology of nitrogen indicators (Schnelleret al.,2013a). References for the examples:aCORPEN,2006,bBuczko and Kuchenbuch, 2010,cAvelineet al.,2009,dBockstalleret al.,2008.
5.1 Nitrogen indicators
The typology presented in Figure3results from the
analy-sis of a database of 1464 environmental indicators issued from 112 methods or reviews on indicators. The database was
cre-ated by Rosnobletet al. (2006) and extended and analyzed
by Schnelleret al.(2013b). The whole variability presented
in Figure3 ranges from causal indicators based on
manage-ment data, like the manure storage capacity, to measured effect
indicators of water quality with in-between effect predictive
indicators based on operational models. The category “nitro-gen balance” is the most popular with more than 30 proposals.
Those could be differentiated between farm-gate, soil surface
and soil system budgets (Oenemaet al.,2003). Although
nitro-gen balance is recognized as the most commonly used
indica-tor to assess nitrogen management (Langeveldet al.,2007), its
predictive quality of nitrogen losses, especially nitrate leach-ing remains questionable, especially in the case of calculations
with annual data in situations with low surplus (Oenemaet al.,
2005).
5.2 Biodiversity indicators
Since the 80s, a large number of direct measured indic-tors for biodiversity has been proposed in the literature and
extensively discussed by some authors (e.g.Lindenmayer and
Likens, 2011). Indicators based on species diversity and/or
abundance among a given taxon or several taxa (e.g. birds,
plants, carabid beetles, etc.) are the most commonly used at
different scales, from field to national level. Many proposals
also exist for causal or indirect indicators. Among the 91
indi-cators listed for agriculture by Delbaere (2003) more than half
belongs to this type. When considering the general model
ex-plaining biodiversity in farmland (Le Rouxet al., 2008) they
can be in two groups: (i) indicators related to management of farmland like the percentage of semi-natural area and, (ii) indi-cators addressing cropping practices, which can be expressed in amount of inputs per area unit or in percentage of area dis-turbed by fertilizer, pesticides, irrigation, tillage. Both groups
can be expressed at different scales.
Contrary to the two previous types of indicators, examples
of predictive effect indicators according to the typology in
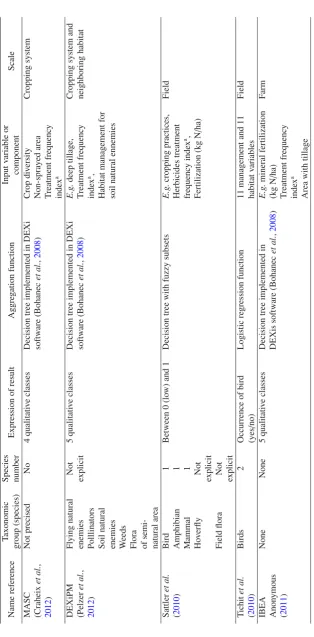
Fig-ure2are less numerous. Table1provides an overview of
ini-tiatives based on an operational model in arable farming. Most of the methods belong to a multi-criteria assessment method.
SALCAbd (Jeanneretet al.,2014) was developed to complete
the SALCA method based on Life Cycle Analysis although it
only deals with direct effects at field and not upstream or off
-stream indirect impacts (see Sect. 3). Outputs are in form of a probability of presence or a decreased of number of species,
D
Ta b le 1 . C ont inued. Name referen ce T axonomi c S p eci es E xpr essi on of re sul t A ggr eg at io n funct io n Input v ar iabl e or S cal e gr oup (s peci es) number component MAS C Not p recised N o 4 qualitati v e cla sses D ecision tree implemented in D E X i C rop d iv ersity Cropping system (Crah eix et al . , sof tw ar e (B ohanec et al . , 2008 ) N on-spr ayed ar ea 2012 ) T reat ment fr equenc y inde x a DEXiPM Fly in g n atu ra l N o t 5 q u alita ti v e cl asse s D ec isio n tre e imp le m en te d in D EXi E.g . deep tillage, C ropping system and (P el zer et al . , enemi es expl ic it sof tw ar e (B ohanec et al . , 2008 ) T reat ment fr equenc y n ei ghbor in g h abi ta t 2012 ) P o lllin at o rs inde x a, So il n atu ra l Habi ta t m anagement for enemi es soi l nat u ra l ennemi es W eeds Flo ra of semi -n atu ral area Sa ttle r et al . Bi rd 1 B et ween 0 (l o w) and 1 Deci si on tr ee wi th fuzzy subset s E.g . cr oppi ng pr act ices, F ie ld ( 2010 ) A mphi bi an 1 H er bi ci des tr eat ment Mammal 1 fr equenc y inde x a, Ho v erfly N o t Fe rtiliz atio n (k g N / ha) ex p lic it F iel d fl or a N ot ex p lic it Ti ch it et al . B ir d s 2 O ccur re nce o f b ir d L ogi st ic re gr essi on funct io n 1 1 m anagement and 11 F iel d ( 2010 )( y es / no) habi ta t v ar ia bl es IBEA No n e No n e 5 q u alita ti v e cl asse s D ec isio n tre e imp le m en te d in E.g . min era l fe rtiliz atio n F ar m A non ymous D E X is sof tw ar e (B ohanec et al . , 2008 )( k g N / ha) ( 2011 ) T reat ment fr equenc y inde x a Are a with tilla g e aSu m o f ra tio ac tu al p es tic id e ra te / recommended rat e. H er e th e inde x is cal cul at ed separ at el y for fungi ci des, her b ic id es, insect ic id
or in form of risk or impact scores. Whereas some models tackle in an explicit way a broad number of species, for plants
(Sandersonet al.,1995) or several taxa (Butleret al.,2009),
most of them focus on a few number of species or few taxa without explicit information on these.
5.3 Examples of different French evaluation methods of sustainability
Providing an exhaustive overview of the “explosion” of evaluation methods in the last decades is totally out of the scope of the article. The reader should refer to synthesis like
this of Rosnobletet al.(2006) or Singhet al.(2012). Table2
gives an overview of six French evaluation methods of sus-tainability in agriculture. The number of indicators for each method is higher than 30 with highest number for DAESE and EVAD. Strictly speaking, DAESE and EVAD are not
evalua-tion method ready to implement by the end-users but offers
re-spectively a broad list of indicators for the first one, and an in-dicator list and a methodological framework for the second. At farm level, causal indicators based on management variables are implemented to make the method easy to use with farmers. MASC and DEXiPM have been developed to be implemented
in research work to evaluateex anteinnovative cropping
sys-tems during the design phase and to help to select and improve most performant systems for experimentation. MASC is based
on quantitative predictive effect indicators (see Fig. 2) and
can also be used to evaluate actual cropping systems (ex post
evaluation). DEXiPM is based on qualitative causal indicators
which are aggregated to make qualitative predictive effect
in-dicators. This makes the evaluation work much faster than in MASC in spite of higher number of basic indicators. For some methods like IDEA, aggregation is based on a sum of scores
that is questioned by many authors (Bockstalleret al.,2008).
MASC and DEXiPM decision trees are implemented thanks to
the DEXi software (Bohanecet al.,2008). This tool allows the
design of such qualitative decision trees using “if then” rules and input variables organized in classes.
6 Discussion
The clarification of preliminary choices described in Sec-tion 3 is important to guide the user in his selecSec-tion of an evalu-ation method, to avoid him a contingent selection led by avail-ability of a method in his organization or surroundings. Indeed, such a choice can lead to the use of a non-adapted method that does not meet his needs or his means or even more to biased evaluation of sustainability. In any case, the great number of indicators within some themes like nitrogen, as well as the va-riety of evaluation methods makes the preliminary step of clar-ification essential to avoid a randomly approach equivalent to a lottery. Consequently, some authors propose a list of criteria
to select the “best” method (Bockstalleret al.,2009; Feschet
and Lairez,2015; Niemeijer and de Groot,2008), or even more
an interactive decision-aid tool such the PLAGE web platform
(Surleau-Chambenoitet al.,2013).
However, for some themes, the number of indicators may
be low. This is particularly true for predictive effect
indica-tors based on operational models. Such indicaindica-tors require an
important design work integrating knowledge on the effect
of farmer management in interaction with soil, climate
vari-ables to give an output which expresses an effect which can
be linked to emissions, or the state and furthermore the im-pact like in LCA. Topics like biodiversity (see Sect. 5.2), soil compaction, nuisance due to noises and odours present gaps
for predictive effect indicators. A new challenge will be to
evaluate ecosystemic services in such a predictive way, from management practices to biodiversity and from biodiversity to ecosystemic services. The second step is addressed, for exam-ple, by an indicator assessing flower pollination value of floral
diversity in field margin (Ricouet al.,2014).
In any case, users need also to know the quality of the in-formation delivered by an indicator, especially when it is used
to evaluate effect on an issue of sustainability like an
envi-ronmental impact. Due to many simplifications, a direct cor-relation can rarely be expected excepted for a broad range of landscape conditions. Such correlations were for exam-ple pointed out between diversity within taxon (birds, bees, etc.) and causal indicators based on management variable like the nitrogen input or percentage of semi-natural area (Billeter
et al.,2008). Specific tests to identify more complex relations
have been also proposed (Bockstaller et al.(2008). In every
case, this raises the question of uncertainty linked to indi-cator results. For an indiindi-cator based on the nitrogen balance
multiplied by a coefficient (see Fig. 3), Mertens and Huwe
(2002) handled uncertainty of data by implementing an
ap-proach based on fuzzy logic so that no unique value but an interval is given to the user.
Many indicators are available at field and farm level as it comes out from the overview given in this article. However, for example, water quality indicators should be used at the scale of the water catchment or for a landscape. Emissions can be assessed at lower scale of cropping and farming systems. For indicator assessing emissions, results can be upscaled by aggregation of results obtained by calculation of an average value at higher scale weighted by the size or the number of en-tity at lower scale. Such aggregation at higher scale like a
na-tion is not relevant for local impact,e.g.water quality, erosion,
whereas it is possible for global impact, such as greenhouse gases. Upscaling requires some statistical skills for data
man-agement but must also integrate new processes (Stein et al.,
2001) and new environmental components (e.g.non cropped
area). In any case, even without an upscaling procedure, the
possibility to work at a fine resolution (e.g. field) for large
extent (e.g.a water catchment) is an important challenge for
agronomists to enable to work on realistic scenarios of man-agement evolution, allowing finer description of cropping sys-tems than only the type of crop and average fertilizer rates
(Leenhardtet al.,2010).
As already mentioned, sustainability is by nature a multi-dimensional issue which addresses a set of criteria which can be simply organized in a list or in a more complex framework. A question rises sooner or later concerning the necessity of an aggregation to facilitate the interpretation of set of results,
Ta b le 2 . Ov ervie w of six F rench ev aluation m et hods of sustaina bility in agricu lture (adapted from F eschet and B ockstaller , 2014 ). Nam e of th e me thod P er iod of constr uc tion T ype of pr oduc tion S ca le D ime nsions of D ec o mposition N umbe r o Num b er of indic at or s C o mme nts: obje ct iv es , type of indic at or s, aggr eg ation m et hod susta ina bility of susta ina bility ma in co n si d ered in cri te ri a IDEA (Zah m et a l. , 2008 ) 2000–2008 Arab le , li v es to ck , wine gr o w ing Fa rm Ec onomic , soc ia l and en vir onme n ta l Scal e / co mpone nt / indic at or 10 42 Ev al ua tion o f susta ina b ility at fa rm le v el to ma k e fa rm er s se n siti v e to this sta k e. U se o f ca u sa l indic at or s for en vir onme n ta l d ime n sion, su m o f sco res w it h in each d im en si o n . T h e globa l susta ina b ility sc or e is the w o rs t o f the thr ee d ime n sions Dia gnostic de 2010 Da ir y p roduc tion F ar m Ec onomic , soc ia l an d en v ir o n m en ta l Di m ensi o n / cr ite ri a / indic at or 18 34 Ev al ua tion o f susta ina b ility at fa rm le v el to dur ab ilité – R A D ma k e fa rm er s se n siti v e to this sta k e. N o (Féret , 2004 ) aggr eg ation o f indic at or s. DA E S E – OT P A (G uilla umin et a l. , 2007 ) 2003–2007 Arab le , li v es to ck , wine gr o w ing Fa rm Ec onomic , soc ia l en vir onme n ta l Axi s / co m p art m en t / indic at or 19 120 A la rge ra nge of (c au sa l) indic at or s to m onitor ch ange in ma na ge me nt re ga rd ing susta ina b ility fo r a fa rm ne tw or k at re g iona l (na tiona l) le v el. No aggr eg ation. EV AD (Re y -V al et te et a l. , 2009 ) 2005–2008 Aqua cu ltur e F ar m , E conomic , D ime n sion / 13 230 De ci sion ai d tool fo r ac tion, de sign an d pr oduc tion soc ia l, institutiona l aan d p ri nc iple s / se lect io n o f a wi d e ran g e o f in d icat o rs (fro m sect o r / en vir onme n ta l cr ite ri a / di ff eren t ty p es ) la ndsc ap e indic at or MA S C 2. 0 (Crah ei x et a l. , 2012 ) 2005–2012 Ar ab le cr ops C ropping syste m Ec onomic , so ci al an d en vir onme n ta l Di m ensi o n / 83 9 Ev al ua te an d ra n k cr opping syste m s b y aggr eg at ed ide n tif ying str ong an d w ea k points re g ar ding cr ite ri a / susta ina bility . U se of pr ed ic ti v e e ff ect ba sic cr ite ri a / indic at or s w he n possible . indic at or Aggr eg ation tha nks to DEXi sof tw ar e. DE Xi PM (Pel zer et a l. , 2012 ) 2007–2011 Ar ab le cr ops C ropping syste m Ec onomic , soc ia l an d en v ir o n m en ta l Di m ensi o n / 86 1 Rap id ex ante ev al ua tion o f inno v ati v e ca ggr eg at ed cr opping syste m s to se le ct the m ost p er fo rm an t cr ite ri a / one s. C ausa l qua lita ti v e indic at or s aggr eg at ed ba sic cr ite ri a / in qua lita ti v e pr ed ic ti v e e ff ect in d icat o rs . indic at or / A ggr eg ation w ith D E X i sof tw ar e p ract ices aTh e in stitu tio n al d ime n sio n en co mp asse s fo r in sta n ce g o v ern an ce , p artic ip atio n , em p o we rme n t o f co mmu n ity an d w o m en , ju stic
The relevance of composite aggregation (i.e.of indicators
ad-dressing totally different issues) is often discussed because
of the loss of information but also due to the methodologi-cal problems it raises. A major problem is “adding apple and pear” in the case of composite indicators which can appear in
scoring method (Rigbyet al.,2001). Several method are
avail-able to avoid this problem like the normalization technique in monetary unit or physic unit, the multivariate approach, or
de-cision trees based – or not – on fuzzy logic (Bockstalleret al.,
2008). The DEXi software tool (Bohanecet al.,2008) makes
the design of decision tree (without fuzzy logic) quite easy but remains totally qualitative. For complex trees, special attention should be therefore put on the sensitivity of the aggregated
in-dicator to the variability of basic ones (Carpaniet al.,2012).
Another flaw is a certain lack of transparency when the auto-matic weighting procedure ot the software is used. A totally
different approach is the use of multi-criteria methods based
on an outranking (Cinelliet al.,2014) which has the default
of being based on relative comparisons and not on an absolute assessment. More recently another approach addressing, in a transparent way, compensations between indicators has been
proposed (van Asseltet al.,2014). In every case, we advise
to use both aggregated and individual indicators, the former to compare systems or to select performant ones, the latter to to identify weak and strong points.
Acknowledgements. The authors are grateful to the GIS Grande
Cul-ture à Hautes performances Économiques et Environnementales (GIS GC-HP2E, French group of scientific interest for arable crops), for its support of the work of Chloé Schneller and Pauline Feschet. The authors want to thank Chloé Schneller for her work on the indicator database, and Juliette Lairez (GIS Elevages Demain) for her contri-bution to the reflection.
References
Alkan Olsson J, Bockstaller C, Stapleton L, Knapen R, Therond O, Turpin N,et al.2009. Indicator frameworks supporting ex-ante impact assessment of new policies for rural systems; a critical review of a goal oriented framework and its indicators.Environ.
Sci. Policy12: 562–572.
Anonymous. 2011. Un outil de diagnostic de l’impact des pratiques agricoles sur la biodiversite : Outil “IBEA” : Impact des pratiques agricoles sur la Biodiversité des Exploitations Agricoles. FNE, INRA, MNHN, Paris, 105 p. (in revision).
Aveline A, Rousseau ML, Guichard L, Laurent M, Bockstaller C, 2009. Evaluating an environmental indicator: case study of MERLIN, an assessment method of the Risk of Nitrate Leaching.
Agr. Syst.100: 22–30.
Billeter R, Liira J, Bailey D, Bugter R, Arens P, Augenstein I,et al. 2008. Indicators for biodiversity in agricultural landscapes: a pan-European study.J. Appl. Ecol.45: 141–150.
Bockstaller C, Girardin P, Van der Werf HGM. 1997. Use of agro-ecological indicators for the evaluation of farming systems.Eur.
J. Agron.7: 261–270.
Bockstaller C, Guichard L, Keichinger O, Girardin P, Galan MB, Gaillard G. 2009. Comparison of methods to assess the sustain-ability of agricultural systems. A review.Agron. Sustain. Dev.29: 223–235.
Bockstaller C, Guichard L, Makowski D, Aveline A, Girardin P, Plantureux S. 2008. Agri-environmental indicators to assess crop-ping and farming systems. A review.Agron. Sustain. Dev.28: 139–149.
Bockstaller C, Lassere-Joulin F, Slezack-Deschaumes S, Piutti S, Villerd J, Amiaud B,et al.2011. Assessing biodiversity in arable farmland by means of indicators: an overview.OCL18: 137–144. Bohanec M, Messean A, Scatasta S, Angevin F, Griffiths B, Krogh
PH,et al.2008. A qualitative multi-attribute model for economic
and ecological assessment of genetically modified crops.Ecol.
Model.215: 247–261.
Bossel H. 2000. Policy assessment and simulation of actor orientation for sustainable development.Ecol. Econ.35: 337–355.
Bouleau G. 2012. Ce que nous apprend l’histoire des indicateurs en-vironnementaux.Rev. fr. For.5: 645–652.
Braband D, Geier U, Kopke U, 2003. Bio-resource evaluation within agri-environmental assessment tools in different European coun-tries.Agric. Ecosyst. Environ.98: 423–434.
Brentrup F, Kusters J, Kuhlmann H, Lammel J. 2004. Environmental impact assessment of agricultural production systems using the life cycle assessment methodology – I. Theoretical concept of a LCA method tailored to crop production.Eur. J. Agron. 20: 247–264.
Brooks S, Bubb P. 2014. Key Knowledge for Successful Biodiversity Indicators UNEP-WCMC, Cambridge, UK.
Buczko U, Kuchenbuch RO. 2010. Environmental Indicators to Assess the Risk of Diffuse Nitrogen Losses from Agriculture.
Environ. Manage.45: 1201–1222.
Butler SJ, Brooks D, Feber RE, Storkey J, Vickery JA, Norris K. 2009. A cross-taxonomic index for quantifying the health of farmland biodiversity.J. Appl. Ecol.46: 1154–1162.
Carpani M, Bergez JE, Monod H. 2012. Sensitivity analysis of a hier-archical qualitative model for sustainability assessment of crop-ping systems.Environ. Modell. Softw.27-28: 15–22.
Cerf M, Meynard JM. 2006. Les outils de pilotage des cultures : di-versité de leurs usages et enseignements pour leur conception.
Natures Sciences Sociétés14: 19–29.
Cinelli M, Coles SR, Kirwan K. 2014. Analysis of the potentials of multi criteria decision analysis methods to conduct sustainability assessment.Ecol. Indic.46: 138–148.
CORPEN. 2006. Des indicateurs AZOTE pour gérer des ac-tions de maîtrise des polluac-tionsà l’échelle de la parcelle, de l’exploitation et du territoire. Ministère de l’Ecologie et du Développement Durable,http://www.ecologie.gouv.fr/IMG/pdf/
maquette_azote29_09.pdf, Paris.
Craheix D, Angevin F, Bergez JE, Bockstaller C, Colomb B, Guichard
L,et al.2012. MASC 2.0, un outil d’évaluation multicritère pour
estimer la contribution des systèmes de culture au développement durable.Innov. Agronom.20: 35–48.
Delbaere B. 2003. An inventory of biodiversity indicators in Europe, 2002. European Environment Agency (EEA), Copenhagen. Falque A, Feschet P, Garrabé M, Gillet C, Lagarde V, Macombe C,
et al.2013. ACV sociales: Effets socio-économiques des chaïnes
de valeur. Fruitrop Thema, Montepllier, France.
Féret S. 2004. Un outil mis au point dans l’Ouest de la France : le diagnostic du Réseau agriculture durable.Travaux et Innovations 110: 39–42.
Feschet P, Bockstaller C. 2014. Méthodes d’évaluation multicritère des systèmes agricoles et ACV sociale, quelle complémentarité ? In: Macombe, C., Loeillet, D. (Eds.), Social LCA in progress, 4th International Seminar in Social LCA, pre-proceedings. Fruitrop, Montepllier, France, pp. 18–25.
Feschet P, Lairez J. 2015. Guide méthodologique pour l’évaluation multicritère de la durabilité en agriculture. Dir. Aubin J, Bockstaller C, Bouvarel I, Ed. Quae-Educagri, Coll. Sciences en partage, Paris (à paraître).
Girardin P, Bockstaller C, van der Werf HMG. 1999. Indicators: tools to evaluate the environmental impacts of farming systems. J.
Sustain. Agr.13: 5–21.
Gras R, Benoit M, Deffontaines JP, Duru M, Lafarge M, Langlet A,
et al.1989. Le fait technique en agronomie. Activité agricole,
concepts et méthodes d’étude. Institut National de la Recherche Agronomique, L’Hamarttan, Paris, France.
Gudmundsson H. 2003. The policy use of environmental indicators – learning from evaluaiton research.J. Transdisciplinary Environ.
Studies2: 1–11.
Guillaumin A, Hopquin JF, Desvignes P, Vinatier JM. 2007. OTPA: Des indicateurs pour caractériser la participation des exploita-tions agricoles d’un territoire au développement durable. 1ère partie: recommandation pour la mise en oeuvre. Projet CASDAR OTPA.
Hansen JW. 1996. Is agricultural sustainability a useful concept?Agr.
Syst.50: 117–143.
Jeanneret P, Baumgartner DU, Knuchel Freiermuth R, Koch B, Gaillard G. 2014. An expert system for integrating biodiversity into agricultural life-cycle assessment.Ecol. Indic.46: 224–231. Keichinger O. 2001. Evaluation de l’impact des pratiques agricoles d’exploitations de grandes cultures sur la valeur cynégétique à l’aide d’indicateurs agro-ecologiques. Thèse de doctorat, INPL-ENSAIA, Nancy.
Lacousmes P. 2005. Le développement durable : une “illusion motrice”. Le développement durable. Les termes du débat. Armand Colin, Paris, pp. 95–107.
Langeveld JWA, Verhagen A, Neeteson J, van Keulen H, Conijn JG, Schils RLM,et al.2007. Evaluating farm performance using agri-environmental indicators: recent experiences for nitrogen man-agement in The Netherlands.J. Environ. Manage.82: 363–376. Ledoux L, Mertens R, WolffP. 2005. EU sustainable development
indicators: An overview.Nat. Resour. Forum29: 392–403. Leenhardt D, Angevin F, Biarnes A, Colbach N, Mignolet C. 2010.
Describing and locating cropping systems on a regional scale. A review.Agron. Sustain. Dev.30: 131–138.
Le Roux X, Barbault R, Baudry J, Burel F, Doursan I, Garnier
E,et al.(Eds.). 2008. Agriculture et Biodiversité. Valoriser les
synergies, Expertise scientifique collective. Synthèse du rapport, INRA, France.
Lindenmayer DB, Likens GE. 2011. Direct Measurement Versus Surrogate Indicator Species for Evaluating Environmental Change and Biodiversity Loss.Ecosystems14: 47–59.
López-Ridaura S, van Keulen H, van Ittersum MK, Leffelaar PA. 2005. Multi-scale methodological framework to derive criteria and indicators for sustainability evaluation of peasant natural re-source management systems.Environ. Dev. Sustain.7: 51–69. Maurizi B, Verrel JL. 2002. Des indicateurs pour des actions de
maîtrise des pollutions d’origine agricole.Ingénieries30: 3–14. Mertens M, Huwe BU. 2002. FuN-Balance: a fuzzy balance approach
for the calculation of nitrate leaching with incorporation of data imprecision.Geoderma109: 269–287.
Meyer-Aurich A, Zander P, Hermann M. 2003. Consideration of bi-otic nature conservation targets in agricultural land use – a case study from the Biosphere Reserve Schorfheide-Chorin. Agric.
Ecosyst. Environ.98: 529–539.
Mitchell G, May A, Mc Donald A. 1995. PICABUE: a methodolog-ical framework for the development of indicators of sustainable development.Int. J. Sustain. Dev. World Ecol.2: 104–123. Niemeijer D, de Groot RS. 2008. A conceptual framework for
select-ing environmental indicator sets.Ecol. Indic.8: 14–25.
Oenema O, Kros H, de Vries W. 2003. Approaches and uncertainties in nutrient budgets: implications for nutrient management and en-vironmental policies.Eur. J. Agron.20: 3–16.
Oenema O, van Liere L, Schoumans, O. 2005. Effects of lowering nitrogen and phosphorus surpluses in agriculture on the quality of groundwater and surface water in the Netherlands.J. Hydrol. 304: 289–301.
Payraudeau S, van der Werf HMG. 2005. Environmental impact assessment for a farming region: a review of methods. Agric.
Ecosyst. Environ.107: 1–19.
Pelzer E, Fortino G, Bockstaller C, Angevin F, Lamine C, Moonen
C, et al. 2012. Assessing innovative cropping systems with
DEXiPM, a qualitative multi-criteria assessment tool derived from DEXi.Ecol. Indic.18: 171–182.
Purtauf T, Thies C, Ekschmitt K, Wolter V, Dauber J. 2005. Scaling properties of multivariate landscape structure. Ecol. Indic. 5: 295–304.
Rey-Valette H, Clément O, Aubin J, Mathé S, Chia E, Legendre,
et al.2009. Guide de co-construction d’indicateurs de
développe-ment durable en aquaculture. Cirad, Ifremer, IRNA, IRD, UM1 Montepellier, France.
Ricou C, Schneller C, Amiaud B, Plantureux S, Bockstaller C. 2014. A vegetation-based indicator to assess the pollination value of field margin flora.Ecol. Indic.45: 320–321.
Rigby D, Woodhouse P, Young T, Burton M. 2001. Constructing a farm level indicator of sustainable agriculture agriculture prac-tice.Ecol. Econ.39: 463–478.
Riley J. 2001. The indicator explosion: local needs and international challenges.Agric. Ecosyst. Environ.87: 119–120.
Robinson J. 2004. Squaring the circle? Some thoughts on the idea of sustainable development.Ecol. Econ.48: 369–384.
Rosnoblet J, Girardin P, Weinzaepflen E, Bockstaller C. 2006. Analysis of 15 years of agriculture sustainability evaluation meth-ods. In: Fotyma, M., Kaminska, B. (Eds.), 9th ESA Congress, Warsaw, Poland, pp. 707–708.
Sadok W, Angevin F, Bergez JE, Bockstaller C, Colomb, B, Guichard
L.et al.2008. Ex ante assessment of the sustainability of
alterna-tive cropping systems: guidelines for identifying relevant multi-criteria decision aid methods.Agron. Sustain. Dev.28: 163–174. Sanderson RA, Rushton SP, Pickering AT, Byrne JP. 1995. A prelim-inary method of predicting plant species distributions using the British National Vegetation Classification.J. Environ. Manage. 43: 265–288.
Sattler C, Nagel UJ, Werner A, Zander P. 2010. Integrated assessment of agricultural production practices to enhance sustainable devel-opment in agricultural landscapes.Ecol. Indic.10: 49–61. Schneller C, Lellahi A, Bockstaller C. 2013a. Caractérisation des
indicateurs azote. Groupe de travail “évaluation multicritère” GIS GC-HP2E.
Schneller C, Lellahi A, Bockstaller C. 2013b. Document descriptif de la base de données INDIC : une compilation d’indicateurs au niveau mondial. Groupe de travail “évaluation multicritère” GIS GC-HP2E.
D
Singh RK, Murty HR, Gupta SK, Dikshit AK. 2012. An overview of sustainability assessment methodologies. Ecol. Indic. 15: 281–299.
Smith CS, McDonald GT. 1998. Assessing the sustainability of agri-culture at the planning stage.J. Environ. Manage.52: 15–37. Stein A, Riley J, Halberg N. 2001. Issues of scale for environmental
indicators.Agric. Ecosyst. Environ.87: 215–232.
Surleau-Chambenoit C, Morin A, Galan MB, Cariolle M, Leclercq C, Guichard L,et al.2013. PLAGE, un réseau d’acteurs et une plate-forme WEB dédiée à l’évaluation agri-environnementale et de la durabilité des pratiques agricoles, des exploitations agricoles et des territoire.Innovations Agronomiques31: 15–26.
Tichit M, Barbottin A, Makowski D. 2010. A methodological ap-proach to identify cheap and accurate indicators for biodiversity assessment: application to grazing management and two grass-land bird species.Animal4: 819–826.
Van Asselt ED, van Bussel, LGJ, van der Voet H, van der Heijden G, Tromp SO, Rijgersberg H,et al.2014. A protocol for evalu-ating the sustainability of agri-food production systems-A case study on potato production in pen-urban agriculture in The Netherlands.Ecol. Indic.43: 315–321.
Van Cauwenbergh N, Biala K, Bielders C, Brouckaert V, Franchois L, Garcia Cidad V,et al.2007. SAFE – A hierarchical framework for assessing the sustainability of agricultural systems. Agric.
Ecosyst. Environ.120: 229–242.
Van der Werf HGM, Petit J. 2002. Evaluation of environmental im-pact of agroculture at the farm level: a comparison and analysis of 12 indicator-based methods.Agric. Ecosyst. Environ.93: 131– 145.
Zahm F, Viaux P, Vilain L, Girardin P, Mouchet C. 2008. Assessing Farm Sustainability with the IDEA Method – from the Concept of Agriculture Sustainability to Case Studies on Farms.Sustain. Dev.16: 271–281.