Please cite this article as: X. Li, Study on the contrast between two seismic response analysis programs of soil layer, International Journal of Engineering (IJE), IJE TRANSACTIONS A: Basics Vol. 32, No. 1, (January 2019) 46-53
International Journal of Engineering
J o u r n a l H o m e p a g e : w w w . i j e . i rStudy on the Contrast between Two Seismic Response Analysis Programs of Soil
Layer
X. Li*
School of Architecture Engineering, Binzhou University, Binzhou, China
P A P E R I N F O
Paper history: Received 23 August 2018
Received in revised form 19 October 2018 Accepted 26 October 2018
Keywords:
Soil Analysis Program Ground Motion Soil Shear Strain Response Spectra Peak Acceleration
A B S T R A C T
56 ground motions of the bedrock and surface are selected from 28 stiff sites ( site class I and site class
Ⅱ) of the KiK-net station.The peak acceleration, response spectra and shear strain of actual hard sites are calculated by using SHAKE2000 and LSSRLI-1. The similarities and differences between SHAKE2000 and LSSRLI-1 and their differences from measured records are analyzed. It provides a basis for improving the seismic response analysis method of soil layers. The results show that when the soil is not obviously nonlinear, most of the difference in PGA results calculated by SHAKE2000 and LSSRLI-1 can be ignored, and the maximum error of the calculated soil shear strain is also less than 20%. When the soil is highly nonlinear, only a few differences in PGA results can be ignored. The maximum error of shear strain of the soil is greater than 20%. The results of peak acceleration and response spectra calculated by SHAKE2000 and LSSRLI-1 differ greatly from the measured results in most cases. Nevertheless, the probability of having big difference and significant difference between LSSRLI-1 and measured response spectra is greater than SHAKE2000.
doi: 10.5829/ije.2019.32.01a.06
1. INTRODUCTION1
As an essential part of seismic design, soil seismic response analysis directly affects the safety and cost of engineering structures under the earthquake [1-4]. At present, the estimation of soil ground motion is provided by the soil response analysis program. SHAKE2000 and LSSRLI-1 are the two kinds of soil reaction analysis programs which are widely used respectively in the West and China. SHAKE2000 is modified by SHAKE91, which is a kind of one-dimensional equivalent linear program. And it is also the most widely used one dimensional seismic response analysis program currently [5-8]. LSSRLI-1 [9] program has become the recommended soil reaction analysis program for seismic safety evaluation of engineering sites in China [10]. Besides, SHAKE2000 and LSSRLI-1 have the same assumption. That is, the equivalent shear modulus and damping ratio are used to replace the shear modulus and damping ratio under different strain amplitudes in the sense that the global
*Corresponding Author Email: [email protected] (X. Li)
dynamic effect is approximately equivalent, and the nonlinear problem is transformed into a linear problem [11, 12]. Both SHAKE2000 and LSSRLI-1 assume that the actual site is horizontally stratified. The input seismic wave is a shear wave incident vertically upward from the bedrock. The shear wave input from the bedrock can be decomposed into a series of harmonic superposition by Fast Fourier Transform (FFT), and the response is obtained by Inversely Fast Fourier Transform (IFFT) after superposition. The equivalent linear soil response iteration is adopted in the calculation. The difference is that SHAKE2000 and LSSRLI-1 have different methods for calculating shear strain. SHAKE2000 adopts frequency domain solution and LSSRLI-1 takes both frequency domain solution and time domain solution into account when calculating shear strain.
and LSSRLI-1. According to his research, if the seismic intensity is not strong enough, the programs can meet the engineering requirements. Meanwhile, from the security and economic point of view, the LSSRLI-1 program is desired. Blind predictions of ground response at Turkey Flat vertical array site during the 2004 Park field earthquake were performed using a series of nonlinear and equivalent-linear ground-response analysis codes by Annie et al. [14]. However, both of them only used one site profile, lack of representativeness. Although these two programs are widely used, they are seldom adopted to calculate the ground motions from actual site. The main reason is that the actual borehole seismic records are rare in the past.
Many borehole seismic ground motions have being collected recently from the KiK-net network in Japan, which creates the condition for the seismic response analysis of the soil. While the existing researches have indicated that the results of LSSRLI-1 are unreasonable when the soil is soft or the input seismic motion is
strong. The results are reliable when the soil is chosen from stiff sites. In this paper, according to Chinese site classification principle [15], 28 stiff sites were selected (including site classes I and Ⅱ) from the KiK-net stations. By analyzing 56 different actual seismic records, this paper compared the application of two programs in stiff sites, which provided the basis for the improvement of seismic response analysis method of soil [16-18].
2. CALCULATION CONDITIONS
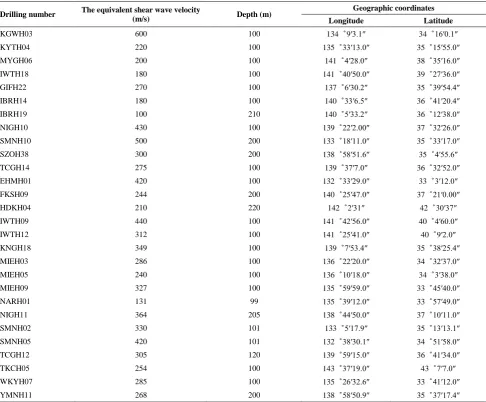
Soil profiles of the selected 28 stations in this paper have a complete record of the underground and the surface rocks [19]. Drilling conditions and the equivalent shear wave velocity obtained according to relevant Chinese codes are shown in Table 1. The soil is layered every two meters. Besides, different kind of soils should be stratified.
TABLE 1. Information of station
Drilling number The equivalent shear wave velocity
(m/s) Depth (m)
Geographic coordinates Longitude Latitude
KGWH03 600 100 134゜9′3.1″ 34゜16′0.1″
KYTH04 220 100 135゜33′13.0″ 35゜15′55.0″
MYGH06 200 100 141゜4′28.0″ 38゜35′16.0″
IWTH18 180 100 141゜40′50.0″ 39゜27′36.0″
GIFH22 270 100 137゜6′30.2″ 35゜39′54.4″
IBRH14 180 100 140゜33′6.5″ 36゜41′20.4″
IBRH19 100 210 140゜5′33.2″ 36゜12′38.0″
NIGH10 430 100 139゜22′2.00″ 37゜32′26.0″
SMNH10 500 200 133゜18′11.0″ 35゜33′17.0″
SZOH38 300 200 138゜58′51.6″ 35゜4′55.6″
TCGH14 275 100 139゜37′7.0″ 36゜32′52.0″
EHMH01 420 100 132゜33′29.0″ 33゜3′12.0″
FKSH09 244 200 140゜25′47.0″ 37゜21′0.00″
HDKH04 210 220 142゜2′31″ 42゜30′37″
IWTH09 440 100 141゜42′56.0″ 40゜4′60.0″
IWTH12 312 100 141゜25′41.0″ 40゜9′2.0″
KNGH18 349 100 139゜7′53.4″ 35゜38′25.4″
MIEH03 286 100 136゜22′20.0″ 34゜32′37.0″
MIEH05 240 100 136゜10′18.0″ 34゜3′38.0″
MIEH09 327 100 135゜59′59.0″ 33゜45′40.0″
NARH01 131 99 135゜39′12.0″ 33゜57′49.0″
NIGH11 364 205 138゜44′50.0″ 37゜10′11.0″
SMNH02 330 101 133゜5′17.9″ 35゜13′13.1″
SMNH05 420 101 132゜38′30.1″ 34゜51′58.0″
TCGH12 305 120 139゜59′15.0″ 36゜41′34.0″
TKCH05 254 100 143゜37′19.0″ 43゜7′7.0″
WKYH07 285 100 135゜26′32.6″ 33゜41′12.0″
KiK-net strong-motion records were selected as the inputs. 21 seismic waves with different peak and spectra characteristics were selected as the bedrock input waves from site class I, and the peak acceleration of records is between 12gal and 192gal. 35 records with different peak and spectra characteristics were selected as the bedrock input waves from site class Ⅱ, and peak acceleration is between 12gal and 370gal. In this paper, there are totally 336 sets of calculation conditions.
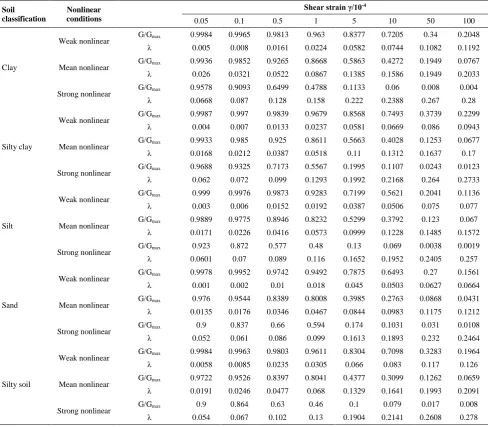
3. SELECTION OF NONLINEAR PARAMETERS
Since the nonlinear calculation parameters of soil are not provided in the actual investigation data, three kinds of nonlinear conditions, respectively defined as weakly nonlinear condition, mean value and strong nonlinear
condition, are used in the same profile. In this work, according to the uncertainty analysis of nonlinear dynamic shear modulus ratio and damping ratio of soil were applied [20]. The weak nonlinear condition means that the dynamic shear modulus ratio takes the maximum, while the damping ratio takes the minimum value. Mean value condition implies that both dynamic shear modulus ratio and damping ratio take the mean value. The strong nonlinear condition means that the dynamic shear modulus ratio takes the minimum, while the damping ratio takes the maximum value. G/Gmax is
the dynamic shear modulus ratio; λ is the damping ratio; γ is the shear strain. The relationship between the dynamic shear modulus ratio G/Gmax as well as λ and
shear strain γ of different soil types are shown in Table 2.
TABLE 2. Nonlinear calculation data of soil
Soil classification
Nonlinear conditions
Shear strain γ/10-4
0.05 0.1 0.5 1 5 10 50 100
Clay
Weak nonlinear G/Gmax 0.9984 0.9965 0.9813 0.963 0.8377 0.7205 0.34 0.2048 λ 0.005 0.008 0.0161 0.0224 0.0582 0.0744 0.1082 0.1192
Mean nonlinear G/Gmax 0.9936 0.9852 0.9265 0.8668 0.5863 0.4272 0.1949 0.0767 λ 0.026 0.0321 0.0522 0.0867 0.1385 0.1586 0.1949 0.2033
Strong nonlinear G/Gmax 0.9578 0.9093 0.6499 0.4788 0.1133 0.06 0.008 0.004 λ 0.0668 0.087 0.128 0.158 0.222 0.2388 0.267 0.28
Silty clay
Weak nonlinear G/Gmax 0.9987 0.997 0.9839 0.9679 0.8568 0.7493 0.3739 0.2299 λ 0.004 0.007 0.0133 0.0237 0.0581 0.0669 0.086 0.0943
Mean nonlinear G/Gmax 0.9933 0.985 0.925 0.8611 0.5663 0.4028 0.1253 0.0677 λ 0.0168 0.0212 0.0387 0.0518 0.11 0.1312 0.1637 0.17
Strong nonlinear G/Gmax 0.9688 0.9325 0.7173 0.5567 0.1995 0.1107 0.0243 0.0123 λ 0.062 0.072 0.099 0.1293 0.1992 0.2168 0.264 0.2733
Silt
Weak nonlinear G/Gmax 0.999 0.9976 0.9873 0.9283 0.7199 0.5621 0.2041 0.1136 λ 0.003 0.006 0.0152 0.0192 0.0387 0.0506 0.075 0.077
Mean nonlinear G/Gmax 0.9889 0.9775 0.8946 0.8232 0.5299 0.3792 0.123 0.067 λ 0.0171 0.0226 0.0416 0.0573 0.0999 0.1228 0.1485 0.1572
Strong nonlinear G/Gmax 0.923 0.872 0.577 0.48 0.13 0.069 0.0038 0.0019 λ 0.0601 0.07 0.089 0.116 0.1652 0.1952 0.2405 0.257
Sand
Weak nonlinear G/Gmax 0.9978 0.9952 0.9742 0.9492 0.7875 0.6493 0.27 0.1561 λ 0.001 0.002 0.01 0.018 0.045 0.0503 0.0627 0.0664
Mean nonlinear G/Gmax 0.976 0.9544 0.8389 0.8008 0.3985 0.2763 0.0868 0.0431 λ 0.0135 0.0176 0.0346 0.0467 0.0844 0.0983 0.1175 0.1212
Strong nonlinear G/Gmax 0.9 0.837 0.66 0.594 0.174 0.1031 0.031 0.0108 λ 0.052 0.061 0.086 0.099 0.1613 0.1893 0.232 0.2464
Silty soil
Weak nonlinear G/Gmax 0.9984 0.9963 0.9803 0.9611 0.8304 0.7098 0.3283 0.1964 λ 0.0058 0.0085 0.0235 0.0305 0.066 0.083 0.117 0.126
Mean nonlinear G/Gmax 0.9722 0.9526 0.8397 0.8041 0.4377 0.3099 0.1262 0.0659 λ 0.0191 0.0246 0.0477 0.068 0.1329 0.1641 0.1993 0.2091
For a drill section, under the same ground motion, the peak of surface acceleration and the maximum shear strain of soil as well as acceleration response spectra are obtained using the two kinds of programs, SHAKE2000 and LSSRLI-1. The results of the above two programs are analyzed and then compared with the actual measured records. The input data of each program include earthquake waves, the equivalent shear wave velocity, the depth of the soil layer, the dynamic shear modulus and the damping ratio and the shear strain.
4. PEAK ACCELERATION OF GROUND SURFACE
In the contrast analysis, it is assumed that the peak error is negligible if less than 20%. The above condition is defined as a boundary. The error of peak acceleration between SHAKE2000 and LSSRLI-1 is showed in Figure 1. The error of peak acceleration between the calculated and the measured is shown respectively in Figure 2. The results are amended referencing to the seismic intensity scale of China [21]. In the statistics of this paper, error of peak acceleration less than 10% is defined as “the individual”, the error between 10 and 50% is defined as "the minority", the error between 50 and 70% is defined as "the majority", the error between 70 and 90% is defined as "the big most", the error over 90% is defined as "the overwhelming majority".
Seeing from both Figures 1 and 2, in site classes I and Ⅱ, the overwhelming majority of peak acceleration errors calculated by SHAKE2000 and LSSRLI-1 can be ignored when the soil is weakly nonlinear. While the big most can be ignored when the soil is mean value condition or strongly nonlinear condition. For the measured surface acceleration, only a little difference of the measured results and the calculated by the two programs can be ignored. Though the results of the two programs are different from the actual results, relatively
speaking, the calculated results of SHAKE2000 are better than LSSRLI-1.
5. ACCELERATION RESPONSE SPECTRA
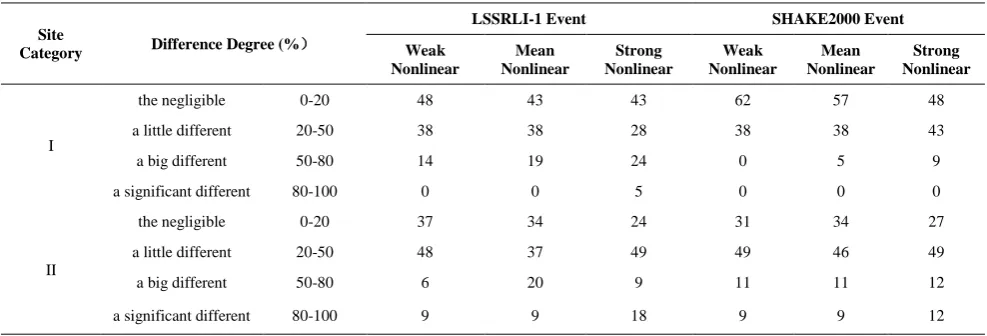
Based on measured response spectra, response spectra calculating by SHAKE2000 and LSSRLI-1 and the measured response spectra are compared in Table 3. In this table, the maximum error less than 20% of the response spectra is defined as “the negligible”, the maximum error between 20 and 50% is defined as "a little different", the maximum error between 50 and 80% is defined as "a big different", and the maximum error over 80% is defined as "a significant different". Comparisons of response spectra between calculated and the measured records from MYGH06 station and NIGH11 station are respectively shown in Figures 3 and 4.
site I
30.91% 32.73%
36.36%
weak nonlinear mean strong nonlinear
site II
28.57% 33.33%
38.1%
weak nonlinear mean strong nonlinear
Figure 1. The peak acceleration errors of SHAKE2000 and LSSRLI-1
SHAKE2000 SHAKE2000
LSSRL-1
LSSRL-1 SHAKE2000
22.58% 12.9% 22.58%
12.9%
16.13% 12.9%
weak nonlinear weak nonlinear mean mean strong nonlinear strong nonlinear
LSSRL-1 site I
LSSRL-1 LSSRL-1
LSSRL-1 SHAKE2000 SHAKE2000
SHAKE2000 site II
10.14% 10.14% 20.29% 18.84%
23.19%
17.39%
weak nonlinear weak nonlinear mean mean strong nonlinear strong nonlinear
Figure 2. The peak acceleration errors of the calculated and the measured conditions
TABLE 3. The difference between the calculation results and the record results
Site
Category Difference Degree (%)
LSSRLI-1 Event SHAKE2000 Event
Weak Nonlinear
Mean Nonlinear
Strong Nonlinear
Weak Nonlinear
Mean Nonlinear
Strong Nonlinear
I
the negligible 0-20 48 43 43 62 57 48
a little different 20-50 38 38 28 38 38 43
a big different 50-80 14 19 24 0 5 9
a significant different 80-100 0 0 5 0 0 0
II
the negligible 0-20 37 34 24 31 34 27
a little different 20-50 48 37 49 49 46 49
a big different 50-80 6 20 9 11 11 12
0.01 0.1 1 10 0.0
0.5 1.0 1.5 2.0 2.5
T/s Sa
/g
SHAKE2000 LSSRLI-1
0.01 0.1 1 10
0.0 0.5 1.0 1.5
SHAKE2000 LSSRLI-1
T/s Sa
/g
0.01 0.1 1 10
0.0 0.2 0.4 0.6 0.8
T/s Sa
/g
SHAKE2000 LSSRLI-1
(a) weakly nonlinear (b) mean nonlinear (c) strong nonlinear Figure 3. Comparison of response spectra between calculated and the measured records (MYGH06 station)
0.01 0.1 1 10
0.0 0.5 1.0 1.5 2.0 2.5
T/s Sa
/g
SHAKE2000 LSSRLI-1
0.01 0.1 1 10
0.0 0.5 1.0 1.5
SHAKE2000 LSSRLI-1
T/s Sa
/g
0.01 0.1 1 10
0.0 0.2 0.4 0.6 0.8
T/s Sa
/g
SHAKE2000 LSSRLI-1
(a) weakly nonlinear (b) mean nonlinear (c) strong nonlinear Figure 4. Comparison of response spectra between calculated and the measured records (NIGH11 station)
The difference between calculated response spectra and measured response spectra is given by spectral ratio R(T).
, ,
( ) ln a p( ) ln a m( )
R T S T S T (1)
where, S Ta,p( ) is the calculated response spectra, Sa m, ( )T
is the measured response spectra.
In site class I, the error between the LSSRLI-1 and the actual measured response spectra is more obvious than that of SHAKE2000. As shown in Table 3, the big different error of LSSRLI-1 is more than that of SHAKE2000. When the soil is strongly nonlinear condition, the error between the LSSRLI-1 and the actual measured response spectra has the situation of significant differences, while the error between the SHAKE2000 and the actual measured response spectra doesn’t have the situation of significant differences. In site class Ⅱ, the big different error of LSSRLI-1 is also more than that of SHAKE2000. The errors between the two programs and the actual measured response spectra both have the situation of significant differences. However, the difference of LSSRLI-1 is serious than that of SHAKE2000. Figures 1 and 2 further show that the difference between the SHAKE2000 and the actual measured response spectra is smaller than that between LSSRLI-1 and the measured results, especially when the soil is strongly nonlinear condition.
6. SHEAR STRAINS OF THE SOIL LAYER
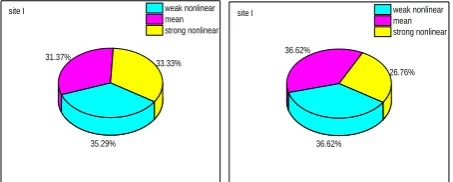
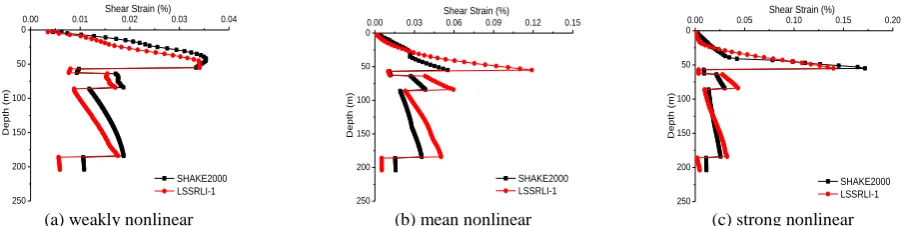
In order to ascertain the difference between the two equivalent linear programs, shear strains of the soil layer calculated by the two programs under the same conditions are compared in this paper. The shear strain is calculated at the surface of every soil layer. It is the maximum shear strain. In site classes I and Ⅱ, the maximum shear strain errors less than 20% calculated by SHAKE2000 and LSSRLI-1 are shown in Figure 5. While Figures 6 and 7 present the comparison of calculated shear strain between SHAKE2000 and LSSRLI-1.
As shown in Figure 5, in site class I, the shear strain error calculated by SHAKE2000 and LSSRLI-1 is less than 20% in most cases.
site I
33.33% 31.37%
35.29%
weak nonlinear mean strong nonlinear
site I
26.76% 36.62%
36.62%
weak nonlinear mean strong nonlinear
Occasionally, however, the difference of shear strain is obvious. Besides, the shear strain of LSSRLI-1 is significantly higher than that of SHAKE2000, as shown in Figures 6 and 7. In site class Ⅱ, when the soil is weakly nonlinear condition or mean value condition, the error of maximum shear strain calculated by SHAKE2000 and LSSRLI-1 is less than 20% in most cases. When the soil is strongly nonlinear condition, the error is less than 20% in some cases.
It is obvious that MYGH06 station is site class I. However, the shear strain calculated by SHAKE2000 and LSSRLI-1 is significantly different. This result overturns the previous statement that the results calculated by the two programs had little difference. The difference between the two programs in calculating shear strain may be the reason for the diversity in calculation results of shear strain. However, the methods for calculating shear strain between the two programs need to be further studied.
100 80 60 40 20 0
0.0 0.1 0.2 0.3 0.4
SHAKE2000 LSSRLI-1 Shear Strain (%)
D e p th ( m ) 100 80 60 40 20 0
0.00 0.05 0.10 0.15 0.20 0.25 0.30
Shear Strain (%)
D e p th ( m ) SHAKE2000 LSSRLI-1 100 80 60 40 20 0
0.00 0.05 0.10 0.15 0.20 0.25
Shear Strain (%)
D e p th ( m ) SHAKE2000 LSSRLI-1
(a) weakly nonlinear (b) mean nonlinear (c) strong nonlinear Figure 6. The comparison of calculated shear strain between SHAKE2000and LSSRLI-1 (MYGH06 station)
250 200 150 100 50
00.00 0.01 0.02 0.03 0.04
Shear Strain (%)
D e p th ( m ) SHAKE2000 LSSRLI-1 250 200 150 100 50 0
0.00 0.03 0.06 0.09 0.12 0.15
D e p th ( m )
Shear Strain (%)
SHAKE2000 LSSRLI-1 250 200 150 100 50 0
0.00 0.05 0.10 0.15 0.20
Shear Strain (%)
D e p th ( m ) SHAKE2000 LSSRLI-1
(a) weakly nonlinear (b) mean nonlinear (c) strong nonlinear Figure 7. The comparison of calculated shear strain between SHAKE2000 and LSSRLI-1 (NIGH11 station)
7. CONCLUSIONS
This paper is based on 56 different actual seismic records of 28 stiff sites at KiK-net station. The soil dynamic shear modulus and damping ratio are divided into three kinds of operating conditions, which are weakly nonlinear condition, mean value nonlinear condition and strongly nonlinear condition separately. The results of the two programs SHAKE2000 and LSSRLI-1 are compared. The conclusions are drawn as follows:
(1) When the soil is weakly nonlinear condition, the error of peak acceleration calculated by SHAKE2000 and LSSRLI-1 can be ignored in most cases. When the soil is mean value or strongly nonlinear condition, the error can be ignored in some cases. For peak acceleration, only a few differences between the two programs and the measured results can be ignored.
But the results of SHAKE2000 are better than LSSRLI-1.
(3) For shear strains of soil layer, when the soil was weakly or mean value nonlinear condition, the shear strain error calculated by SHAKE2000 and LSSRLI-1 is less than 20% in most cases. When the soil was strongly nonlinear condition, the shear strain error calculated by the two programs is less than 20% in most cases in site class I, while the error was less than 20% in some cases in site class Ⅱ. For shear strains of soil layer, the shear strain of LSSRLI-1 is universally higher than that of SHAKE2000. The shear strains calculated by the two programs have some differences in a few cases. Occasionally, however, the difference is obvious.
8. ACKNOWLEDGEMENTS
The author would like to express her sincere appreciations for Shandong Provincial Natural Science Foundation, China (ZR2018PEE020) and Youth talent
innovation project of Binzhou University
(BZXYQNLG201701) for their supports.
9. REFERENCES
1. Chen, Z.S., Meng, S.J., Li, Y.R. and Chen, L.W., "A study on the analysis method of soil layer seismic response in seasonal frozen site", in Applied Mechanics and Materials, Trans Tech Publ. Vol. 238, (2012), 872-875.
2. Yaghmaei-Sabegh, S., " A wavelet-based procedure for mining of pulse-like ground motions features in response spectra",
International Journal of Engineering,Transaction A: Basics
Vol. 25, No. 1, (2012), 39-50.
3. Zhou, C.X., Zheng, S.P. and Ye, Y.Q., "Influence of silt soil layer on the space seismic design response spectrum", in Applied Mechanics and Materials, Trans Tech Publ. Vol. 624, (2014), 622-625.
4. Di Giulio, G., Improta, L., Calderoni, G. and Rovelli, A., "A study of the seismic response of the city of benevento (southern italy) through a combined analysis of seismological and geological data", Engineering Geology, Vol. 97, No. 3-4, (2008), 146-170.
5. Mohanty, S. and Patra, N.R., Assessment of liquefaction potential of pond ash at panipat in india using shake2000, in Geocongress 2012: State of the art and practice in geotechnical engineering. 2012.1829-1838.
6. Ordonez, G.A., "Shake2000: A computer program for the 1d analysis of geotechnical earthquake engineering problems",
Geomotions, LLC, USA, (2000).
7. Martirosyan, A., Biswas, N., Dutta, U., Cole, D. and Papageorgiou, A., "Ground motion analysis in the anchorage basin: 1-d approach", Journal of Earthquake Engineering, Vol. 7, No. 2, (2003), 251-274.
8. Ardeshir, A., Ahmadi, P.F. and Bayat, H., "A prioritization model for hse risk assessment using combined failure mode and effect analysis and fuzzy inference system: A case study in iranian construction industry", International Journal of Engineering, Vol. 31, No. 9, (2018), 1487-1497.
9. Liao, Z., Seismic microzonation. 1989, Seismic Press Beijing. 10. China, N.S.o.t.P.s.R.o., Code for seismic safety evaluation of
engineering sites, in Beijing: Chinese Standard Press. 2005. 11. Liao, Z.P., "Introduction to wave motion theories in
engineering", Science, Beijing, (2002).
12. Lin, W., Wang, H. and Zhang, Y., "Comparison of two computational microstructure models for predicting effective transverse elastic properties of unidirectional fiber reinforced composites", International Journal of Engineering, Transaction C:Aspects, Vol. 31, No. 9, (2018), 1498-1504.
13. Wenhao, Q., Jingshan, B. and Dedong, L., "A test for three programs of soil layer seismic response analysis by strong earthquake record", Earthquake Engineering and Engineering Vibration-Chinese Edition-, Vol. 25, No. 5, (2005), 30. 14. Kwok, A.O., Stewart, J.P. and Hashash, Y.M., "Nonlinear
ground-response analysis of turkey flat shallow stiff-soil site to strong ground motion", Bulletin of the Seismological Society of America, Vol. 98, No. 1, (2008), 331-343.
15. GB50011, C.S., "Code for seismic design of buildings", China Building Industry Press, Beijing, (2010).
16. Moussa, A. and Salah, M., "Formulation of an explicit numerical approach for a large number of cycles", International Journal of Engineering, Transaction C: Aspects Vol. 31, No. 9, (2018), 684-693.
17. Karimaee-Tabarestani, M. and Zarrati, A., "Effect of collar on time development and extent of scour hole around cylindrical bridge piers", International Journal of Engineering-Transactions C: Aspects, Vol. 25, No. 1, (2011), 11-16. 18. Tavakoli, H. and Kiakojouri, F., "Numerical study of
progressive collapse in framed structures: A new approach for dynamic column removal", International Journal of Engineering, Transaction A: Basics, Vol. 26, No. 7 (2013), 685-692.
19. Ye, G.B. and Guo, Y.F., "Test analysis on shear strength increment of soft soil under embankment fill", Electronic Journal of Geotechnical Engineering, Vol. 15, (2010), 1-9. 20. Sun, R., Chen, H.-j. and Yuan, X.-m., "Uncertainty of non-linear
dynamic shear modular ratio and damping ratio of soils",
Chinese Journal of Geotechnical Engineering, Vol. 8, (2010), 017.
Study on the Contrast between Two Seismic Response Analysis Programs of Soil
Layer
X. Li
School of Architecture Engineering, Binzhou University, Binzhou, China
P A P E R I N F O
Paper history: Received 23 August 2018
Received in revised form 19 October 2018 Accepted 26 October 2018
Keywords:
Soil Analysis Program Ground Motion Soil Shear Strain Response Spectra Peak Acceleration
هدیکچ
56 زا حطس و گنس رتسب زا نیمز تکرح 28
سلاک تیاس( تفس لحم I
سلاک تیاس و II
هاگتسیا زا ) KiK-net
زا هدافتسا اب یعقاو تخس یاه ناکم زا یشرب راشف و خساپ فیط ،باتش کیپ باتش .تسا هدش باختنا SHAKE2000
و LSSRLI-1 نیب یاه توافت و اه تهابش .دوش یم هبساحم
SHAKE2000 و
LSSRLI-1 زا اهنآ یاه توافت و
ت و هیزجت شور دوبهب یارب ییانبم نیا .تسا هتفرگ رارق لیلحت و هیزجت دروم هدش یریگ هزادنا تادنتسم ل خساپ لیلح
هزر
رد توافت نیرتشیب ،تسین یطخ ریغ راکشآ روط هب کاخ یتقو هک دهد یم ناشن جیاتن .تسا کاخ یاه هیلا یا جیاتن
PGA ساحم طسوت هدش هب SHAKE2000
و LSSRLI-1 طخ رثکادح و دوش هتفرگ هدیدان دناوت یم
راشف هبساحم رد ا
زا رتمک زین کاخ یشرب 20
٪ جیاتن رد توافت دنچ اهنت ،تسا یطخ ریغ رایسب کاخ هک یماگنه .تسا PGA
ت یم دناو
زا شیب کاخ یشرب راشف یاطخ رثکادح .دوش هتفرگ هدیدان 20
٪ فیط جیاتن .تسا هبساحم شنکاو و باتش یاه
ش هد
طسوت SHAKE2000 و
LSSRLI-1 .تسا توافتم رایسب دراوم رثکا رد یریگ هزادنا جیاتن زا
دوجو نیا اب لامتحا
نیب راد ینعم توافت و گرزب توافت LSSRLI-1
زا رتشیب یریگ هزادنا خساپ فیط و SHAKE2000
.تسا