METHODOLOGY
The SMART App: an interactive web
application for comprehensive DNA methylation
analysis and visualization
Yin Li, Di Ge and Chunlai Lu
*Abstract
Background: Data mining of The Cancer Genome Atlas (TCGA) data has significantly facilitated cancer genome
research and provided unprecedented opportunities for cancer researchers. However, existing web applications for DNA methylation analysis does not adequately address the need of experimental biologists, and many additional functions are often required.
Results: To facilitate DNA methylation analysis, we present the SMART (Shiny Methylation Analysis Resource Tool)
App, a user-friendly and easy-to-use web application for comprehensively analyzing the DNA methylation data of TCGA project. The SMART App integrates multi-omics and clinical data with DNA methylation and provides key inter-active and customized functions including CpG visualization, pan-cancer methylation profile, differential methylation analysis, correlation analysis and survival analysis for users to analyze the DNA methylation in diverse cancer types in a multi-dimensional manner.
Conclusion: The SMART App serves as a new approach for users, especially wet-bench scientists with no
program-ming background, to analyze the scientific big data and facilitate data mining. The SMART App is available at http:// www.bioin fo-zs.com/smart app.
Keywords: TCGA , DNA methylation, Gene expression, Web application
© The Author(s) 2019. This article is distributed under the terms of the Creative Commons Attribution 4.0 International License (http://creat iveco mmons .org/licen ses/by/4.0/), which permits unrestricted use, distribution, and reproduction in any medium, provided you give appropriate credit to the original author(s) and the source, provide a link to the Creative Commons license, and indicate if changes were made. The Creative Commons Public Domain Dedication waiver (http://creativecommons.org/ publicdomain/zero/1.0/) applies to the data made available in this article, unless otherwise stated.
Introduction
All cancers arise as a result of the accumulation of somatic mutations, copy number alterations, and epige-netic modifications that alter transcription and protein expression. Thus, studies of molecular features such as DNA methylation may reveal the underlying mechanisms of carcinogenesis and progression. DNA methylation, the addition of a methyl group to DNA, plays a critical role in regulating gene expression [1]. It has been reported that DNA methylation at the promoter regions is often nega-tively correlated with gene expression while DNA meth-ylation in gene bodies is often positively correlated with gene expression [2]. Abnormal DNA methylation pat-terns are found in every type of human cancer [3]. Many
previous studies have shown that DNA methylation is involved in many aspects of carcinogenesis and provides potential biomarkers for evaluating the diagnosis and prognosis of cancer [4–6]. A recent study has also shown the association between DNA methylation and somatic copy number aberration, suggesting a much more com-plex mechanism beyond this modification [7].
The Cancer Genome Atlas (TCGA), a project supported by the National Cancer Institute (NCI) and National Human Genome Research Institute (NHGRI), hosts tre-mendous amount of multi-omics data and allows system-atic study of the genetic or epigenetic basis of cancer [8]. However, accessing and analyzing the DNA methylation data from TCGA database is quite difficult for those scien-tists who have no computational background. Therefore, constructing easy-to-use applications for analyzing the DNA methylation data of TCGA database is demanded.
Open Access
*Correspondence: [email protected]
MethHC (http://methh c.mbc.nctu.edu.tw), Wanderer (http://mapla b.imppc .org/wande rer/), MEXPRESS (https ://mexpr ess.be), and MethSurv (https ://biit.cs.ut.ee/meths urv/) are examples of web-based tools that allow research-ers to integrate, analyze, and visualize DNA methyla-tion [9–12]. MethHC enables users to browse the top 250 hyper- or hypo-methylated genes in 18 cancer types. Wan-derer allows users to analyze DNA methylation and gene expression in a regional framework, MEXPRESS allows users to look at DNA methylation data in relation to its genomic location, and MethSurv can associate overall can-cer survival with DNA methylation levels across a large body of TCGA data and many cancers. Although these tools are exceptionally valuable, they do not fully unlock the potential of the publicly available data. For example, they do not offer a function for users to explore the correla-tion between DNA methylacorrela-tion and transcript expression. In addition, none of the above tools help users visualize the chromosomal distribution of differential methylated CpGs in diverse cancer types. Therefore, we developed the SMART App, which enables users to analyze DNA methylation and its association with other omics data. The SMART App can facilitate DNA methylation data mining and help reveal the complexity of epigenetic modifications.
Results
Features
The SMART App offers interactive functions for users to analyze the DNA methylation in diverse cancer types in a multi-dimensional way.
Home
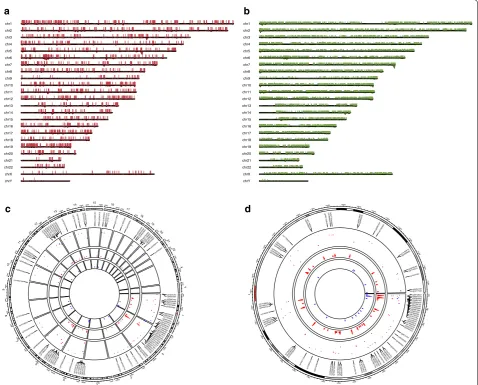
The home page first displays the number of DNA meth-ylation samples available from TCGA project, colored by sample types (i.e., Normal and Tumor), for users to gain an overview of the sample size of the cancer type of est. Next, the SMART App provides a quick search inter-face. Users can enter a gene symbol (e.g., ERBB2) into the ‘Quick start’ box to search for a gene of interest. By click-ing the “Go” button, a circular plot showclick-ing the chromo-somal distribution of all associated CpGs of the input gene will be displayed. To help users gain more useful informa-tion about the CpGs and their genomic locainforma-tions along with transcripts, a detailed segment plot highlighting the transcripts, exons, UTR, CDS, CpG island regions, shelves and shores is displayed below (Fig. 1). This segment plot
can help researchers to identify potential methylation-expression related CpGs. The panel below summarizes the detailed information these probes, and users can select one of these probes to view its pan-cancer methylation profile and identify aberrantly methylated sites for further analy-sis. Besides, users can also view the CpG-aggregated pan-cancer methylation profile. Users can select multiple CpGs at a time to explore the mean or median methylation of the selected CpGs. We previously identified that TRIM58 is a novel prognostic-related methylation-driven gene in lung squamous cell carcinoma [13]. Using the quick search function of the SMART App, it is easy to find that mean methylation level of TRIM58 is significantly higher not only in lung squamous cell carcinoma but also in many other cancer types including breast cancer, head and neck carcinoma, and lung adenocarcinoma, indicating its poten-tial role in carcinogenesis in these cancer types.
Differential CpGs
Differential analysis is a common approach in cancer research by comparing tumor samples vs. normal sam-ples for identifying aberrantly methylated CpGs. Mean-while, clustering of the CpGs with similar methylation patterns along the chromosomes may reflect the genomic mechanisms leading to specific methylation characteris-tics [14]. Therefore, the SMART App allows users to set custom cut-off values for a given cancer type to dynami-cally obtain differentially methylated CpGs and their chromosomal distributions (Fig. 2). The delta |Beta-value|/delta |M value| of each probe is calculated as the mean Beta-value/M value in tumor samples minus the mean Beta-value/M value in normal samples. p value is calculated using the Wilcoxon rank sum test, and is adjusted using the Benjamini–Hochberg method. More-over, for users who only want to visualize specific CpGs, the SMART App offers an extra function that allows users to draw CpG flexibly. The detailed description can be found at the website.
Methylation DIY
This module provides functions for users to compre-hensively analyze DNA methylation taking other omics data and clinical stages into consideration. The first panel generates custom box plots for users for compare CpGs of genes between normal and tumor samples in a given cancer type. Users can select multiple probes at
Fig. 1 Genomic information of the gene ERBB2. The segment plot showing the detailed information of genomic locations of CpGs of ERBB2, highlighting transcripts, exons, UTR, CDS (coding sequence), CpG island, shelves, and shores. The name and the type of each transcript are given. The genomic length is shown below. By default, the distance between any adjacent two lines stands for 1 k. Users can set the distance scale. The yellow arrow at the top stands for the strand direction, that is, towards right, +, towards left, −. The coverage of the CpG islands are displayed as the red regions
ENST00000584601.5 (protein_coding)
ENST00000584014.5 (retained_intron)
ENST00000578199.5 (protein_coding)
ENST00000406381.6 (protein_coding)
ENST00000541774.5 (protein_coding)
ENST00000445658.6 (protein_coding) ENST00000584450.5 (protein_coding)
ENST00000582648.5 (nonsense_mediated_decay) ENST00000582788.5 (retained_intron)
ENST00000578373.5 (nonsense_mediated_decay)
ENST00000269571.9 (protein_coding) ENST00000584908.5 (retained_intron)
ENST00000578709.5 (protein_coding) ENST00000584099.1 (lncRNA)
ENST00000583038.5 (retained_intron) ENST00000583391.1 (retained_intron)
ENST00000578502.1 (protein_coding)
ENST00000582818.5 (protein_coding)
ENST00000578630.1 (retained_intron) ENST00000584684.1 (retained_intron)
ENST00000580074.1 (protein_coding)
ENST00000584888.1 (lncRNA) transcript exon CDS UTR
cg15227682 cg05616858
cg03386751 cg14187895 cg09875273
cg24649641
cg10289325
cg27300230 cg23906291
cg10394385 cg22632017
cg12222323
cg27052442
cg25582403
cg02330892
cg20007836 cg26041593 cg04936632
cg08585669
cg12413918
cg22778981
cg23731030
cg23333072
cg02433278
cg26111030 cg11993754
cg16065186 cg27005179
cg13263114
cg24657085
cg00459816 cg13131339
cg22018815
cg26615017 cg16557858
cg05512684 cg19457603
cg25582353
cg01959640 cg12648523
cg06185555
cg20498199
cg16332577 cg19103969 cg26683316
3968701139688011396890113969001139691011396920113969301139694011396950113969601139697011396980113969901139700011397010113970201139703011397040113970501139706011397070113970801139709011397100113971101139712011397130113971401139715011397160113971701139718011397190113972001139721011397220113972301139724011397250113972601139727011397280113972901139730011
Island N_Shelf
N_Shore S_Shelf
the same time for easy visibility and interpretation. The returned box plots will display all the selected probes plus an aggregation box plot showing the mean/median methylation of all the selected probes. The second panel plots methylation by pathological stages based on the TCGA clinical data. Two options are available, namely, major stage and sub-stage. For example, if users choose major stage for plotting, stage IIA/IIB will be included in the stage II group. Here, using SMART App, we can easily find that TRIM58 (cg10983544) is much hyper-methylated in stage II group in lung squamous cell carcinoma, indicating its clinical rel-evance (Fig. 3b, p value = 0.016). Somatic mutations
can also affect DNA methylation. To help users study
the effect of somatic mutations on DNA methylation, the SMART App offers a function for plotting box plots comparing methylation between mutation and wild-type groups. For example, IDH1 mutation can cause hyper-methylation in lower grade glioma (LGG) [15]. When IDH1 is selected, the returned box plots showed that cg07640666, cg17353896 and cg24324379 were significantly hyper-methylated in the mutation group (Fig. 3a, p value < 0.05). Sun et al. observed the correla-tion between CNV and methylacorrela-tion and discussed the possible mechanisms relating to this event [7]. Here, the SMART App provides a function for researchers to study the possible association between CNV and DNA methylation. The results are displayed as box
chr1 chr2 chr3 chr4 chr5 chr6 chr7 chr8 chr9 chr10 chr11 chr12 chr13 chr14 chr15 chr16 chr17 chr18 chr19 chr20 chr21 chr22 chrX chrY
chr1 chr2 chr3 chr4 chr5 chr6 chr7 chr8 chr9 chr10 chr11 chr12 chr13 chr14 chr15 chr16 chr17 chr18 chr19 chr20 chr21 chr22 chrX chrY a
d c
b
Fig. 2 Visualization of the differentially methylated CpGs in BLCA with delta |Beta-value| > 0.25 and p value < 0.01. a There are 6007
Fig. 3 Methylation DIY. a cg07640666, cg17353896, and cg24324379 are hyper-methylated in IDH1 mutation group in LGG (M value, p value < 0.05).
b Major stage plot showing cg10983544 (TRIM58) is much hyper-methylated in stage II lung squamous cell carcinoma (M value, p value = 0.016).
c cg04902327 (TRIM58) shows a lower level of methylation with low-level copy number amplification, whereas the other CpGs of TRIM58 show a positive correlation with CNV in lung squamous cell carcinoma (M value, p value < 0.05). − 2: homozygous deletion; − 1: single copy deletion; 0: diploid normal copy; + 1: low-level copy number amplification; + 2: high-level copy number amplification
(See figure on next page.)
plots showing the correlation between CNV and meth-ylation. With the SMART App, it is very interesting to observe that TRIM58 (cg04902327) shows a lower level of methylation with low-level copy number amplifica-tion, whereas other CpGs of TRIM58 show a positive correlation with CNV in lung squamous cell carcinoma (Fig. 3c, p value < 0.05).
Correlation
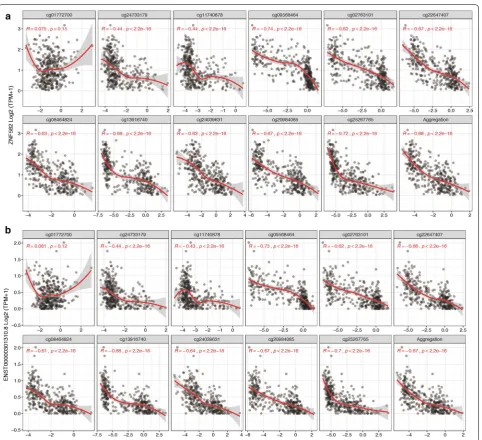
DNA methylation is often correlated with gene expres-sion. The correlation function of SMART App performs correlation analysis between gene expression and methyl-ation for any given sets of TCGA, using methods includ-ing Pearson, Spearman, and Kendall correlation statistics. The UCSC Xena provides the re-computed expression data of TCGA for 198,619 transcripts. Accordingly, there are two levels available, and one can choose to analyze the correlation at gene level or transcript level. When analyzing the correlation at transcript level, a segment plot highlighting the genomic locations of the tran-script and CpGs will be displayed, and the distances of each probe to TSS will also be shown in the table below for users to locate the ones at the promoter region. The results are displayed as scatter and distribution plots (Fig. 4 and Additional file 1: Figure S1).
Survival
The SMART App performs overall survival (OS) and disease-free internal (DFI)-related survival analysis based on methylation levels. This function allows users to select their custom cancer types for overall or disease-free survival analysis. Cox regression analysis is a popular method for evaluating the prognostic value of individual variables. To efficiently analyze the survival significance of methylation, the SMART App offers both univariate and multivariate Cox regression analyses. When per-forming multivariate Cox regression analysis, users can adjust for potential confounding factors, including age, gender, race and pathological stage. Users can copy and paste a list of CpGs into the box, and select the cancer type of interest to conduct Cox regression analysis. The hazard ratio, 95% confidence interval, z score, and p value will be given. Once users have identified the significant variables, they can use the SMART App to draw survival
curves. The thresholds for high/low methylation level cohorts can be adjusted by users.
Comparison with existing tools
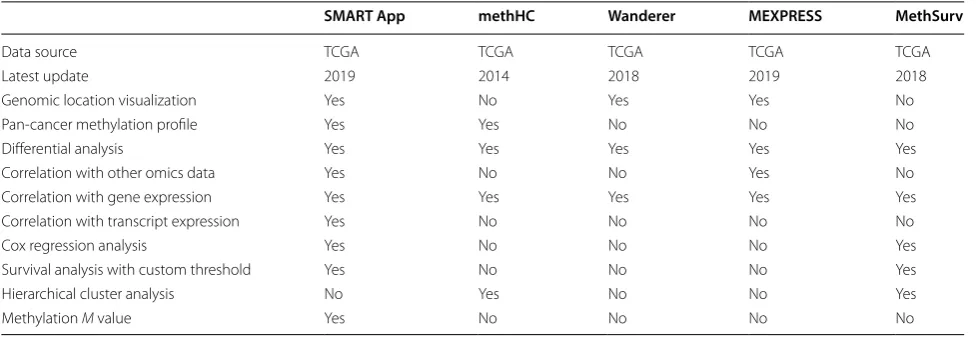
Web tools to analyze DNA methylation of TCGA pro-ject include methHC, Wanderer, MEXPRESS, and Meth-Surv. MethHC was introduced in 2014 and enables users to identify highest/lowest methylated genes, perform hierarchical cluster analysis, explore methylation profile across tumors and conduct correlation analysis. How-ever, the latest update of methHC was in 2014. Wan-derer is an interactive web application to explore DNA methylation and gene expression. It provides a single-page interface to explore DNA methylation in a regional framework. MEXPRESS is a data visualization tool for DNA methylation analysis and was first introduced in 2015. Now, it has been updated, adding more data and generating fancier figures. MethSurv is a shiny applica-tion that mainly focuses on the clinical impacts of DNA methylation. While these tools are extraordinarily valu-able, many extra functions are not adequately addressed by them. M value has been reported to be more statis-tically valid for the differential analysis [16]. Although differential analyses are commonly performed by these tools, none of them allow users to use the M value for dif-ferential analysis. None of these tools allow users to pick a cancer type and visualize the chromosomal distribution of the aberrantly methylated CpGs. In addition, none of the existing tools allow users to analyze the correlation between methylation and expression at transcript level. Besides, none of the tools provide customizable selection of methylation thresholds for patient cohort partition-ing in survival curves plottpartition-ing. A detailed comparison is shown in Table 1.
Discussion
cg10983544 and cg20429172 are located at the promoter region of the transcript of TRIM58, and may ask whether these CpGs are aberrantly methylated and whether the methylation changes of these CpGs will lead to gene expression alterations. One can also identify significantly hyper- and hypo-methylated CpG-based custom thresh-olds. Moreover, one can explore the correlation between methylation and other omics and clinical data, analyze the prognostic value of CpGs and draw survival curves. Meanwhile, the flexible customization parameters of the
SMART App also enable users to customize the result visualization. The SMART App is a user-friendly and intuitive tool for unlocking the potential value of the genomic data in TCGA. It complements well with other available tools.
Conclusion
The SMART App is a web-based tool to explore and interpret the DNA methylation data across 33 can-cer types from TCGA database. The source code of the Fig. 4 Spearman correlation between expression (ZNF582) and DNA methylation (M value) in lung squamous cell carcinoma. a Gene-level
SMART App is available for users to download under GPLv3 license.
Methods
The SMART App is developed entirely in the R program-ming language using the Shiny framework and is freely available for all users. There is no login requirement for accessing any features in the SMART App. The SMART App has been most extensively tested in a Safari browser environment and is also compatible with other popu-lar web browsers such as Chrome, Firefox, and Internet Explorer.
The data used in the SMART App are directly pulled down from the TCGA Pan-Cancer cohort of UCSC Xena public data hubs (https ://xenab rowse r.net) upon users’ request using UCSCXenaTools, including gene expression (TOIL re-computed TPM), transcript expression (TOIL
re-computed TPM) [17], DNA methylation
(Human-Methylation450k; Primary Solid Tumor and Solid Nor-mal Tissue), somatic mutation (Gene-level non-silent mutation), copy number variation (Gene-level GISTIC2 thresholded), phenotype and clinical information [18]. Gene-level non-silent mutation and gene-level thres-holded copy number variation are used because they offer easy-to-interpret values (i.e., 0 for wild type and 1 for mutation for somatic mutation; homozygous deletion (− 2), single copy deletion (− 1), diploid normal copy (0), low-level copy number amplification (+ 1) and high-level copy number amplification (+ 2) for copy number varia-tion). For methylation probes, we used the hg38 coordi-nates provided by Zhou et al. (http://zwdzw d.githu b.io/ Infin iumAn notat ion) [19]. Gene, transcript and exon
coordinates were obtained from GENCODE (https ://
www.genco degen es.org, Release 31, GRCh38.p12).
Both Beta-value and M value are commonly used
in DNA methylation analysis. The M value has been reported to have a more dynamic range, and is more appropriate for statistical analysis [16]. Whereas the Beta-value is much more biologically interpretable. Therefore, these two types of methylation values are available in the SMART App.
The SMART App outputs consist of figures and tables, which are available for users to download. Figures are rendered as Portable Document Format (PDF), which can be further edited using Adobe Illus-trator. Tables are generated by DT R package (https :// rstud io.githu b.io/DT/) allowing for data querying and selection.
Supplementary information
Supplementary information accompanies this paper at https ://doi. org/10.1186/s1307 2-019-0316-3.
Additional file 1: Figure S1. Distribution plots showing the correlation between expression and Methylation. Each bar represents a sample, the names of the gene/transcript and CpGs are shown on the right, the methylation and expression values are shown on the left. The samples are reorders according to the expression value. A. Gene-level distribution plot. B. Transcript-level distribution plot.
Abbreviations
TCGA : The Cancer Genome Atlas; SMART : Shiny Methylation Analysis Resource Tool; CNV: copy number variation.
Acknowledgements
We appreciate the constructive and insightful comments of the reviewers. We would like to thank Yike Shu and Chris Lou for improving code efficiency. The study was supported by Shanghai Science and Technology Infrastructure Program (19441908800).
Authors’ contributions
Conceived and designed the study: YL, DG and CL. Built the website: YL. Wrote the paper: YL, DG and CL. All authors read and approved the final manuscript. Table 1 Functionalities comparison between the SMART App and other tools
A yes means this function is available
SMART App methHC Wanderer MEXPRESS MethSurv
Data source TCGA TCGA TCGA TCGA TCGA
Latest update 2019 2014 2018 2019 2018
Genomic location visualization Yes No Yes Yes No
Pan-cancer methylation profile Yes Yes No No No
Differential analysis Yes Yes Yes Yes Yes
Correlation with other omics data Yes No No Yes No
Correlation with gene expression Yes Yes Yes Yes Yes
Correlation with transcript expression Yes No No No No
Cox regression analysis Yes No No No Yes
Survival analysis with custom threshold Yes No No No Yes
Hierarchical cluster analysis No Yes No No Yes
•fast, convenient online submission •
thorough peer review by experienced researchers in your field • rapid publication on acceptance
• support for research data, including large and complex data types •
gold Open Access which fosters wider collaboration and increased citations maximum visibility for your research: over 100M website views per year •
At BMC, research is always in progress.
Learn more biomedcentral.com/submissions
Ready to submit your research? Choose BMC and benefit from:
Availability of data and materials
Not applicable.
Ethics approval and consent to participate
Not applicable.
Consent to publish
Not applicable.
Competing interests
The authors declare that they have no competing interests.
Received: 20 August 2019 Accepted: 12 November 2019
References
1. Jones PA. Functions of DNA methylation: islands, start sites, gene bodies and beyond. Nat Rev Genet. 2012;13(7):484–92.
2. Irizarry RA, Ladd-Acosta C, Wen B, Wu Z, Montano C, Onyango P, et al. The human colon cancer methylome shows similar hypo- and hyper-methylation at conserved tissue-specific CpG island shores. Nat Genet. 2009;41(2):178–86.
3. Herman JG, Baylin SB. Gene silencing in cancer in association with pro-moter hypermethylation. N Engl J Med. 2003;349(21):2042–54. 4. Qiu J, Peng B, Tang Y, Qian Y, Guo P, Li M, et al. CpG methylation signature
predicts recurrence in early-stage hepatocellular carcinoma: results from a multicenter study. J Clin Oncol. 2017;35(7):734–42.
5. Sandoval J, Mendez-Gonzalez J, Nadal E, Chen G, Carmona FJ, Sayols S, et al. A prognostic DNA methylation signature for stage I non-small-cell lung cancer. J Clin Oncol. 2013;31(32):4140–7.
6. Pu W, Geng X, Chen S, Tan L, Tan Y, Wang A, et al. Aberrant methylation of CDH13 can be a diagnostic biomarker for lung adenocarcinoma. J Can-cer. 2016;7(15):2280–9.
7. Sun W, Bunn P, Jin C, Little P, Zhabotynsky V, Perou CM, et al. The associa-tion between copy number aberraassocia-tion, DNA methylaassocia-tion and gene expression in tumor samples. Nucleic Acids Res. 2018;46(6):3009–18. 8. Cancer Genome Atlas Research N, Weinstein JN, Collisson EA, Mills GB,
Shaw KR, Ozenberger BA, et al. The Cancer Genome Atlas Pan-Cancer analysis project. Nat Genet. 2013;45(10):1113–20.
9. Huang WY, Hsu SD, Huang HY, Sun YM, Chou CH, Weng SL, et al. MethHC: a database of DNA methylation and gene expression in human cancer. Nucleic Acids Res. 2015;43(Database issue):D856–61.
10. Diez-Villanueva A, Mallona I, Peinado MA. Wanderer, an interactive viewer to explore DNA methylation and gene expression data in human cancer. Epigenetics Chromatin. 2015;8:22.
11. Koch A, Jeschke J, Van Criekinge W, van Engeland M, De Meyer T. MEX-PRESS update 2019. Nucleic Acids Res. 2019;47(W1):W561–5.
12. Modhukur V, Iljasenko T, Metsalu T, Lokk K, Laisk-Podar T, Vilo J. MethSurv: a web tool to perform multivariable survival analysis using DNA methyla-tion data. Epigenomics. 2018;10(3):277–88.
13. Li Y, Gu J, Xu F, Zhu Q, Ge D, Lu C. Novel methylation-driven genes identi-fied as prognostic indicators for lung squamous cell carcinoma. Am J Transl Res. 2019;11(4):1997–2012.
14. Devaney J, Stirzaker C, Qu W, Song JZ, Statham AL, Patterson KI, et al. Epigenetic deregulation across chromosome 2q14.2 differentiates normal from prostate cancer and provides a regional panel of novel DNA methylation cancer biomarkers. Cancer Epidemiol Biomarkers Prev. 2011;20(1):148–59.
15. Turcan S, Rohle D, Goenka A, Walsh LA, Fang F, Yilmaz E, et al. IDH1 muta-tion is sufficient to establish the glioma hypermethylator phenotype. Nature. 2012;483(7390):479–83.
16. Du P, Zhang X, Huang CC, Jafari N, Kibbe WA, Hou L, et al. Comparison of Beta-value and M-value methods for quantifying methylation levels by microarray analysis. BMC Bioinform. 2010;11:587.
17. Vivian J, Rao AA, Nothaft FA, Ketchum C, Armstrong J, Novak A, et al. Toil enables reproducible, open source, big biomedical data analyses. Nat Biotechnol. 2017;35(4):314–6.
18. Liu J, Lichtenberg T, Hoadley KA, Poisson LM, Lazar AJ, Cherniack AD, et al. An integrated TCGA Pan-cancer clinical data resource to drive high-quality survival outcome analytics. Cell. 2018;173(2):400–16. 19. Zhou W, Laird PW, Shen H. Comprehensive characterization,
annota-tion and innovative use of Infinium DNA methylaannota-tion BeadChip probes. Nucleic Acids Res. 2017;45(4):e22.
Publisher’s Note