RESEARCH
The large fraction of heterochromatin
in
Drosophila
neurons is bound by both B-type
lamin and HP1a
Alexey V. Pindyurin
1,2,3*†, Artem A. Ilyin
4†, Anton V. Ivankin
2, Mikhail V. Tselebrovsky
4,5, Valentina V. Nenasheva
6,
Elena A. Mikhaleva
4, Ludo Pagie
1, Bas van Steensel
1,7and Yuri Y. Shevelyov
4*Abstract
Background: In most mammalian cell lines, chromatin located at the nuclear periphery is represented by condensed heterochromatin, as evidenced by microscopy observations and DamID mapping of lamina-associated domains (LADs) enriched in dimethylated Lys9 of histone H3 (H3K9me2). However, in Kc167 cell culture, the only Drosophilla
cell type where LADs have previously been mapped, they are neither H3K9me2-enriched nor overlapped with the domains of heterochromatin protein 1a (HP1a).
Results: Here, using cell type-specific DamID we mapped genome-wide LADs, HP1a and Polycomb (Pc) domains from the central brain, Repo-positive glia, Elav-positive neurons and the fat body of Drosophila third instar larvae. Strikingly, contrary to Kc167 cells of embryonic origin, in neurons and, to a lesser extent, in glia and the fat body, HP1a domains appear to overlap strongly with LADs in both the chromosome arms and pericentromeric regions. Accordingly, centromeres reside closer to the nuclear lamina in neurons than in Kc167 cells. As expected, active gene promoters are mostly not present in LADs, HP1a and Pc domains. These domains are occupied by silent or weakly expressed genes with genes residing in the HP1a-bound LADs expressed at the lowest level.
Conclusions: In various differentiated Drosophila cell types, we discovered the existence of peripheral heterochro-matin, similar to that observed in mammals. Our findings support the model that peripheral heterochromatin matures enhancing the repression of unwanted genes as cells terminally differentiate.
Keywords: Heterochromatin, HP1, B-type lamin, Lamina-associated domains, Polycomb, Drosophila
© The Author(s) 2018. This article is distributed under the terms of the Creative Commons Attribution 4.0 International License (http://creat iveco mmons .org/licen ses/by/4.0/), which permits unrestricted use, distribution, and reproduction in any medium, provided you give appropriate credit to the original author(s) and the source, provide a link to the Creative Commons license, and indicate if changes were made. The Creative Commons Public Domain Dedication waiver (http://creat iveco mmons .org/ publi cdoma in/zero/1.0/) applies to the data made available in this article, unless otherwise stated.
Background
Eukaryotic chromosomes are subdivided into less con densed euchromatin and more densely packed hetero chromatin. The facultative heterochromatin that is dispersed on the chromosome arms (hereafter ChAs) is mostly composed of silent tissuespecific genes and transposable elements (TEs), whereas pericentromeric
and telomeric regions highly enriched in satellite DNA, TEs and other repeats form the constitutive heterochro matin (the 2LHet, 2RHet, 3LHet, 3RHet, XHet chromo some regions of dm3/R5 genome assembly; hereafter CHet) (reviewed in [1, 2]). Immunostaining and electron microscopy observations indicate that in mammalian cells, both the facultative and constitutive heterochroma tin are located close to the nuclear envelope and around the nucleoli, with an interesting exception being the rod photoreceptor cells of animals with nocturnal vision, where the heterochromatin is centrally positioned ([3] and references therein).
The nuclear envelope is lined with A and Btype lamin filaments which, together with numerous laminbinding proteins, compose the nuclear lamina (reviewed in [4,
Open Access
*Correspondence: a.pindyurin@mcb.nsc.ru; shevelev@img.ras.ru †Alexey V. Pindyurin and Artem A. Ilyin contributed equally to this work 2 Department of Regulation of Genetic Processes, Institute of Molecular and Cellular Biology, Siberian Branch of Russian Academy of Sciences, Novosibirsk, Russia 630090
5]). Using the DamID approach [6, 7], laminaassoci ated chromosomal domains (LADs) were revealed in
Drosophila, nematode and mammalian cell lines [8–13]. LADs mostly harbor silent or weakly expressed genes [9,
11, 12]. Accordingly, the nuclear lamina was shown to be a repressive environment for transcription [14–22]. In mammals, LADs correspond to chromatin domains enriched with the dimethylated Lys9 of histone H3 (H3K9me2) mark [9, 23–25], whereas the trimethylated Lys27 of histone H3 (H3K27me3) mark is enriched at the LAD borders [9]. The H3K9me2modified nucleosomes may be bound by the heterochromatin protein 1a (HP1a) [26–28], and the H3K27me3 mark may recruit the Poly comb group (PcG) proteins [29–32]. Binding of both repressors condenses chromatin [33–38], thus form ing the adjoining nuclear lamina heterochromatin layer (reviewed in [39]). However, in Drosophila, LADs have previously only been mapped in cultured Kc167 cells of embryonic origin [11], where they are enriched neither in H3K9me2 nor in HP1a [40]. Moreover, less than half of LADs in Kc167 cells are enriched in Polycomb (Pc) binding [11]. This raises the question of whether the het erochromatin located at the nuclear periphery in other
Drosophila cell types may be bound by HP1a or, to a greater extent, by Pc.
Recent modifications of the DamID technique have made it possible to map the interactions of proteins of interest (POIs) with chromatin in a particular cell type within complex tissues [41–46]. Using such an approach, the chromosomal regions interacting with the Pc repres sor in the fat bodies, the whole central brain and Repo positive glial cells of the central brain of Drosophila
third instar larvae were previously mapped genome wide [44]. In this study, to map the landscape of repressive chromatin types more comprehensively, we also mapped HP1a and the Btype lamin Dm0 (hereafter Lam) in the same organs/cell types. Furthermore, we mapped interac tions with Pc, HP1a and Lam in the Elavpositive neurons of the central brain. In neurons and, to a lesser extent, in glia and fat bodies, we found that a substantial portion of heterochromatin interacts with both Lam and HP1a. Importantly, such a specific composition of heterochro matin has not been previously described for Drosophila. Finally, we revealed that centromeres are positioned closer to the nuclear lamina in Drosophila neurons than in Kc167 cells.
Results
DamID mapping of Pc, Lam and HP1a domains in various cell types of Drosophila larvae
DamIDseq profiles of genomewide Pc binding from the larval central brain, Repopositive glial cells and fat body cells have been reported previously [44]. The cor responding profiles of HP1a and Lam were generated at the same time; thus, they all share the same Dam only normalization controls (Fig. 1a, b). DamIDseq profiles of POIs (Pc, Lam and HP1a) in neurons were obtained by using the FLPinducible STOP#1Dam system [44] combined with the panneuronal elavGAL4 driver and a UASFLP transgene (Fig. 1c, Additional file 1). Ampli fication of Dammethylated fragments of the neuronal genome was performed as previously described for glial cells [45]. The high specificity of the amplification procedure was confirmed by gel electrophoresis show ing substantially more mePCR products in experimen tal samples compared to negative controls, in which STOP#1 DamID transgenes were not activated by GAL4 protein (Additional file 2: Fig. S1). Subsequent highthroughput sequencing (HTS) of these mePCR samples was performed according to [44].
Next, unique mapping of sequence reads of all stud ied DamIDseq samples to 1kb bins of the Drosophila
dm3/R5 genome assembly was performed. This resulted in a high correlation between replicates of DamPOI and Dam genomewide binding profiles (Additional file 2: Fig. S2; for Pc mapping in the central brain, fat body and Repopositive glial cells we employed previ ously obtained data from GSE75835 [44]). Then, repli cates were merged, and the resulting DamPOI profiles were normalized to the corresponding Dam profiles and log2 transformed. After that, for each POI, the
quantile normalization between organs/cell types was applied. Finally, the chromatin domains enriched for Pc, Lam and HP1a interactions were determined for each organ/cell type using the hidden Markov model (HMM) algorithm (Fig. 1d, Additional file 2: Fig. S3, Additional file 3: Table S1). For further bioinformatic analysis, we additionally employed domain enrichment data for the Pc, Lam and HP1a in embryonic Kc167 cell culture reported previously [11, 40].
(See figure on next page.)
Fig. 1 DamID mapping of LADs, HP1a and Pc domains in the central brain, neurons, glia and fat body. a–c Principles of DamID in the central brain and fat body (a), glia (b) and neurons (c). POI is Lam, HP1a or Pc. d Screenshot from UCSC genome browser showing log2(Dam-POI/Dam) profiles
stop cassette excision in neurons
elav promoter c
stop-cassette excision in glia
b full-length
hsp70 promoter
central brain or fat body
a intein stop FRT FRT minimal hsp70 promoter -repo promoter FLP FLP
♀
×
♂
♀♂
stop FRT FRT minimal hsp70 promoter -5 UAS×promoter
FLP FLP
♀
×
♂
GAL4Scale
chr2L: 10,550,000 10,600,000 10,650,000 10,700,000 10,750,000 10,800,000 10,850,000 10,900,000 10,950,000 11,000,000 11,050,000 11,100,000 11,150,000200 kb dm3
Myo31DF CG6094 CG7384 Fatp Lrr47 Lip4 CG18301 CG18302 Trim9 CG6138 w-cup CG34160 CG34161 CG7329 CG31872 CG18284 CG17097 CG17098 CG31871 CG17104 CG17105 CG17107 CG7299 CG7296 CG7294 CG17108 CG7300 Lip1 Lip2 CG6415 CG6431 CG6443 CG17118 CG6750 CG6444 Nup107 CG6737 CG12299 CG6729 CG17124 CG6495UbcD2 CG6724 CG17127 CG31869 CG31869 CG31870 CG18561 Nos CG6508 CG17134 CG6700 CG17140 CG17139 Porin2 porin CG17085 CG17086 Dnz1 ial Stam CG12517 CG14071CG14070 CG7309 CG14069 dpr2CG14072 CG33129 YL-1 CG16743 abo l(2)06225 SCAR piwi CG12253 CG16833 aub lectin-33A RpL9 Nup154 Art8 dUTPase Samuel Acp32CD CG14913 CG18666 CG14914 CG14915 Ast-C CG14920 CG16854 CG4705 Ge-1 CG6192 l(2)gd1 CG6201 Gr32a CG6230 CG14921 Csl4 CG4738 RfC38 CG4751 hgo Gyc32E CG31867 CG6287 Ca-beta Vm32E CG4788 d 5 --5_ 0 -Brains Lam Brains HP1 Neurons Lam Neurons HP1 Glia Lam Glia HP1
Fat body Lam
Fat body HP1
Kc167 Lam
Kc167 HP1 Brains Pc
Neurons Pc
Glia Pc
Fat body Pc
Kc167 Pc 5 5 5 5 5 5 5 5 5 5 5 5 2 3 0 0 0 0 0 0 0 0 0 0 0 0 0 0 --5_ -5_ -5_ -2_ -5_ -5_ -5_ -5_ -3_ -5_ -5_ -5_ -5_ -5_
FLP Dam POI
Dam POI FLP
Pc, Lam and HP1a domains are not conserved among different Drosophila cell types
Depending on cell type, chromosomal regions interact ing with Lam (i.e., LADs) in Drosophila occupy from 39% (in the central brain) to 55% (in glia) of the length of ChAs, whereas HP1a domains cover 6–26% and Pc domains—12–24% of ChAs (Fig. 2). Minimal LAD coverage in the central brain likely reflects the brains composi tion of different cell types. Therefore, similar to mammals [10], LADs represent the most prominent type of inac tive chromatin domains in Drosophila. However, unlike in mammals, where the conserved LADs comprise about 33% of nonrepetitive genome [47], the LADs shared among various Drosophila cell types were less abundant (occupying 16.5% of ChAs, Fig. 2). The conserved HP1a and Pc domains span the minor part of ChAs (1.7% and 4.9%, respectively). Importantly, in the analyzed cell types the shared interdomains (i.e., the regions which do not significantly interact with the corresponding POI) were
remarkably represented for each of these repressors. For example, 27% of the Drosophila genome does not typi cally interact with the nuclear lamina in any of the cell types analyzed (Fig. 2). This value is 1.4fold less than observed in mice (38% [47]). Therefore, the variability of LADs in Drosophila is much higher than in mammals.
HP1a domains highly overlap with LADs in neurons, but not in Kc167 cells
We further analyzed the degree of overlap between dif ferent domain types. Consistent with the results of Filion et al. [40], LADs and HP1a domains appear to overlap very poorly in the cultured Kc167 cells (the overlapped regions constitute 10% of the length of HP1a domains, 1% of LADs length and 0.5% of ChAs length; Fig. 3a, Additional file 4: Table S2). However, in various larval organs/cell types the degree of overlap between these two domain types was notably higher, with the major intersection of LADs and HP1a domains occurring
1.5
1.9
2.9 1.5
1.7 1.2 4.3 0.1 0.2
0.4
2.4
0.2 1.7 0.9
0.9 2.2 3.4 1.5 0.1
1.4
1.4
0.2 0.1
5.6 0.5 8.8 3.6 1.1
4.0
0.2 16.5
Brains 38.6%
Fat body 45.7%
Glia 54.5%
Kc167 45.3%
Neurons 53.1% Non-domains
27.0%
3.7
5.1
4.1
2.2 2.0 1.4 10.1 0.1 0.3
0.3
2.0
0.2 0.2 0.1
0.0 0.1 3.5 0.2 0.0
1.3
0.8
0.1 0.0
0.1 0.0 0.1 0.4 0.0
4.3
0.0
26.1%
Fat body 16.5%
Glia 19.1%
Kc167 5.5%
Lam HP1a
1.1
4.5
1.5
10.2 0.6 0.2 1.9 0.2 0.2
0.1
0.4
0.1 1.0 2.6
0.3 0.4 0.4 0.6 0.1
0.3
0.1
0.0 0.1
0.7 0.1 0.4 1.7 0.3
0.3
0.1
12.3%
Fat body 15.2%
Glia 12.3%
Kc167 23.7% Pc
4.9 1.7
Brains Brains
Neurons 26.3% 55.0% Non-domains:
Neurons 12.6% 61.8% Non-domains:
Fig. 2 Common LADs, HP1a and Pc domains in various cell types. Diagrams showing the degree of overlap (as a percentage of ChAs length) between (left to right) LADs, HP1a or Pc domains in the central brain, neurons, glia, fat body and Kc167 cells
(See figure on next page.)
Fig. 3 LADs strongly overlap with HP1a domains (both in the ChAs and in the pericentromeric regions) in the central brain and neurons, to a lesser extent in glia and the fat body, and not at all in Kc167 cells. a Venn diagram showing the degree of overlap as a percentage of ChAs length between LADs, HP1a and Pc domains (left to right) in Kc167 cells, fat body, glia, neurons or the central brain. b Screenshot from UCSC genome browser showing log2(Dam-POI/Dam) profiles (where POI is Lam or HP1a) and HMM-determined domains (black rectangles over profiles) for the representative 2R pericentromeric region in the central brain, neurons, glia, fat body and Kc167 cells. Data for Kc167 cells were taken from [11,
Scale chr2R:
RpL38 Stlkp120ctn
CG17486CG17883 Nipped-B
CG40282 CG17082
CG12547CG17528 CG14464
CG33492
TpnC41CCG3107gusAtf6 Nipped-A
d4 Ogt CG10465
CG10395 CG30441 CG10396 CG10417
CG42345 CG30440
TpnC4 CG30438
CG17510 CG17508
CG11665
CG1344 l(2)NC136 CG8245 CG1298
scarface CG17337
vlc ap
l(2)09851 CG34200CG7791 gp210
CG11163 Or42a Tsp42A Or42b
dpr12 CG12551 CG14470
CG7882 CG7881 BubR1 mle
Src42A
Brains Lam
Brains HP1
Neurons Lam
Neurons HP1
Glia Lam
Glia HP1
Fat body Lam
Fat body HP1
Kc167 Lam
Kc167 HP1 5
--5_
5
--5_0
0
5
5
5
5
5
5
2
5
--5_ -2_ -5_ -5_ -5_ -5_ -5_ -5_
0 0
0 0 0 0
0
0
-500 kb dm3
500000 600000 700000 800000 900000 1000000 1100000 1200000 1300000 1400000 1500000 1600000 1700000 1800000 2R pericentromeric heterochromatin I 2R euchromatin
b
Fat body Glia Neurons
Kc167 Brains
32.0 27.5 36.8
26.9
12.9
4.5 5.4 7.4 5.4
5.9 3.2
10.3 2.4
3.1
4.1
7.1 8.7 17.2
17.7
8.1 6.8 5.8
5.6
12.8 3.0 2.1 3.3
2.3
1.0 0.9 0.5
0.2 0.4
0.3 0.2
a
HP1a
5.5% HP1a
16.5%
HP1a
19.1% HP1a26.3% HP1a
26.1% Pc
12.3% Pc
12.6% Pc
15.2% Pc
23.7% Pc
12.3%
Lam
45.3% Lam45.7% Lam54.5% Lam53.1% Lam38.6%
Non-domains 37.9% Non-domains 51.2%
Non-domains 34.8% Non-domains 44.7%
Non-domains 39.4%
−4 −3 −2 −1 0 1 2 3 4 5
Brains Neurons Glia Fat body Kc167
c
A
X
log
(Dam-HP1a/Dam
)
2
p=0 p=0
p=0 p=0
-153 p=5×10
d
HP1a domains
(total) Brains Neurons Glia Fat body Kc167
Autosomes 21.8% 20.1% 11.2% 9.1% 3.9%
X chromosome 33.4% 41.1% 39.3% 35.8% 7.0%
X/A coverage ratio 1.5 2.0 3.5 3.9 1.8
HP1a domains
(overlapped LADs) Brains Neurons Glia Fat body Kc167
Autosomes 17.8% 15.8% 6.0% 5.8% 0.4%
X chromosome 20.4% 30.7% 25.0% 23.2% 1.2%
1.1 1.9 4.2 4.0 3.0
HP1a domains
(overlapped inter-LADs) Brains Neurons Glia Fat body Kc167
Autosomes 4.1% 4.3% 5.1% 3.3% 3.5%
X chromosome 13.0% 10.4% 14.3% 12.6% 5.8%
3.2 2.4 2.8 3.8 1.7
HP1a domains coverage as a percentage of chromosome length
X/A coverage ratio
mainly in the central brain and in neurons (in the cen tral brain and neurons, the overlap constitutes 77–78% of total HP1a domain length, 38–52% of total LADs length and covers ~ 20% of ChAs; Figs. 1d, 3a, Addi tional file 4: Table S2). The observed genome distribu tions of LADs and HP1a domains are highly nonrandom (in each case p < 10−4, permutation test). Moreover, the
increased overlap between LADs and HP1a domains in the analyzed organs/cell types relative to Kc167 cells is characteristic not only for ChAs but also for the pericen tromeric regions (Fig. 3b), where the degree of overlap is even higher (HP1a/LADs intersection length varies from 68% (in fat body) to 91% (in the central brain) of total HP1a domain length in CHet; Additional file 4: Table S2). We note that the pattern of LADs/HP1a overlap for the 4th chromosome is different from that in ChAs and CHet (Additional file 2: Fig. S4, Additional file 4: Table S2). In contrast to varying overlap between LADs and HP1a domains, the degree of intersection between LADs and Pc domains was more similar in different organs/ cell types analyzed (the overlap constitutes 17–29% of LADs, 55–73% of Pc domains and covers 8–13% of ChAs; Fig. 3a, Additional file 2: Fig. S5, Additional file 4: Table S2). These results uncover the interactions of chro matin with both the nuclear lamina and HP1a, which are most prominent in Drosophila neurons.
To test the hypothesis that HP1a binding in LADs may be mediated by TEs, we analyzed the distribution of 3183 TE insertions in the ChAs of Drosophila reference genome. We found that in the central brain, TE occu pancy in the close vicinity of HP1abound LADs is two fold higher (p < 10−4, permutation test) than that in LADs
without HP1a binding, where it appears to be the same as in the whole ChAs. We, thus, propose that TEs in the central brain may participate in the recruitment of HP1a to LADs.
Previously, the preferential binding of HP1a with the X chromosome as compared to autosomes was revealed in adult Drosophila males, but not in females [48]. In agree ment with these results, the profile of HP1a in the non repetitive part of X ChA is shifted toward higher values when compared to autosomes in the male larval central brain and fat body, as well as in neurons and glial cells isolated from a mixed population of both sexes (Fig. 3c). This X chromosomespecific HP1a enrichment is lower (but still present) in female Kc167 cells (Fig. 3c). Interest ingly, HP1a is bound to a larger number of sites on the X chromosome as compared to autosomes (both in LADs and in the interLADs) in all organs/cell types analyzed (Fig. 3d). In the central brain, HP1a domains overlap ping with LADs cover similar genome fractions on the X chromosome and on autosomes, yet the increased HP1a binding on the X chromosome relative to autosomes is
revealed (Additional file 2: Fig. S6). These results are con sistent with the generally elevated HP1a binding with the X chromosome, which is especially evident in males.
The expression level of genes in LADs, Pc and HP1a domains is generally very low
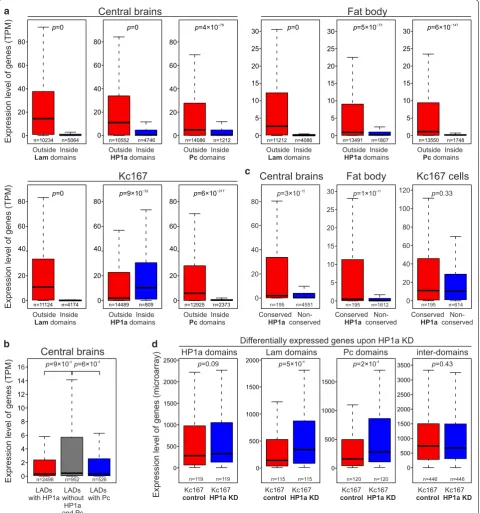
To analyze the expression levels of genes residing in LADs, Pc and HP1a domains, we employed previ ously obtained RNAseq data for the central brain and fat bo dies isolated from the third instar larvae males (GSE75835 [44]), or for Kc167 cells (GSE15596 [49]). In the central brain and fat body, we found drastically lower expression levels of genes whose promoters (distal TSSs) are located in LADs, Pc and HP1a domains, as compared to the interdomains (Fig. 4a, Additional file 5: Table S3). The same picture is seen in Kc167 cells, but only for the genes whose promoters reside in LADs and Pc domains (Fig. 4a). Moreover, in the central brain, the expression level of genes, whose promoters are found in LADs and are simultaneously bound by HP1a or Pc, appears to be lower than in LADs lacking these proteins (Fig. 4b). A similar trend is revealed in the fat body for the promot ers residing in LADs overlapped with the HP1a domains (Additional file 2: Fig. S7A). These results support the model that HP1a or Pc binding introduces an additional layer of gene repression in LADs.
However, in Kc167 cells, median expression level of genes, whose promoters (distal TSSs) are located in the HP1a domains, appears to be increased compared to the rest of the ChAs (Fig. 4a), therefore indicating the interaction of HP1a with the actively expressed genes in these cells. The difference is even more pronounced for the genes overlapping with HP1a domains by their bod ies (Additional file 2: Fig. S7B). Because approximately one third of HP1a domains in Kc167 cells are preserved in other organs/cell types (Fig. 2, Additional file 2: Fig. S8), we examined in the central brain and fat body the expression level of genes located in these conserved HP1a domains. As expected, gene expression appears to be notably higher in the conserved than in the noncon served HP1a domains in these organs, whereas in Kc167 cells it is rather similar (Fig. 4c). Therefore, a fraction of HP1a is bound to the actively expressed genes not only in Kc167 cells, but also in the other analyzed cell types.
a
0 20 40 60 80
n=10234 n=5064
p=0
0 20 40 60 80
n=10552 n=4746 p=0
0 20 40 60 80
n=14086 n=1212 −78 p=4 10×
0 20 40 60 80
n=11124 n=4174 p=0
n=14489 n=809 −32 p=9 10×
n=12925 n=2373 −217 p=6 10×
0 5 10 15 20 25 30
n=11212 n=4086 p=0
n=13491 n=1807
−73 p=5 10×
n=13550 n=1748
−147 p=6 10×
0 5 10 15 20 25 30
0 5 10 15 20 25 30 Central brains Fat body
Expression level of genes (TPM)
Outside Inside
Lam domains Outside InsideHP1a domains Outside InsidePc domains Outside InsideLam domains Outside InsideHP1a domains Outside InsidePc domains
0
20 40 60 80
0 20 40 60 80
Outside Inside
Lam domains Outside InsideHP1a domains Outside InsidePc domains
Kc167
Expression level of genes (TPM)
c
25
20
15
10
5
0 n=195 n=1612
Fat body
Central brains Kc167 cells
-11 p=1 10× -15
p=3 10×
n=195 n=4551 n=195 n=614
p=0.33 100
80
60
40
20
0 80
60
40
20
0
Conserved
Non-HP1a conserved
b
0 2 4 6 8 10 12 14
Expression level of genes (TPM)
-4 p=9 10× p=6 10× -4
LADs
with HP1a LADswithout LADswith Pc HP1a
n=2498 n=952 n=526
16
Central brains d
Kc167 Kc167
control HP1a KD Kc167 Kc167control HP1a KD Kc167 Kc167control HP1a KD Kc167 Kc167control HP1a KD
Expression level of genes (microarray)
HP1a domains Lam domains Pc domains inter-domainsDifferentially expressed genes upon HP1a KD
Conserved
Non-HP1a conserved Conserved Non-HP1a conserved
p=0.09
n=119 n=119 0
500 1000 1500 2000
-4 p= 105×
n=115 n=115 0
500 1000 1500
0 500 1000 1500
0 500 1000 1500 2000 2500 3000
30 120
2000
2500 p= 102× -4 p=0.43
n=120 n=120 n=446 n=446 3500
and Pc
Fig. 4 Expression level of genes residing in LADs, Pc and HP1a domains is drastically lower than in the inter-domains in the central brain and fat body, except for the HP1a domains in Kc167 cells. a Box plots (non-outlier range) showing expression of genes (in TPM) overlapping (blue) or non-overlapping (red) by their promoters (distal TSSs) with LADs, HP1a and Pc domains in larval central brain, fat body and Kc167 cells. RNA-seq data for larval central brain and fat body were taken from GSE75835 [44], and for Kc167 cells—from GSE15596 [49]. b Box plots (non-outlier range) for the central brain showing the expression of genes (in TPM) whose promoters (distal TSSs) are located in LADs, (left to right) overlapped with HP1a domains (red), non-overlapped with either HP1a or Pc domains (gray), or overlapped with Pc domains (blue). Zero TMP values were excluded from the analysis. c Box plots (non-outlier range) showing expression levels of genes (in TPM) overlapped with the conserved HP1a domains by their promoters (distal TSSs) in the central brain, fat body and Kc167 cells. d Box plots (non-outlier range) showing expression levels for the differentially expressed genes, whose bodies overlap with HP1a, Lam or Pc domains, or those not overlapped with any domain type, in the control Kc167 cells (red) or upon HP1a KD in Kc167 cells (blue). RNA expression microarray data for analysis were taken from GSE18092 [50]. In (a–d), M–W U
(KD), 74 out of 119 genes were up and 45 genes were downregulated; however, the median expression of these HP1a targets was not notably changed (Fig. 4d). At the same time, the differentially expressed genes, whose bodies overlap with LADs or Pc domains, were signifi cantly upregulated upon HP1a depletion (Fig. 4d). The same results were obtained when only promoters (distal TSSs) residing in the corresponding domains were con sidered (not shown). Next, we analyzed the differentially expressed genes with more than twofold expression dif ference upon HP1a KD and revealed the profound up regulation of direct HP1a targets (Additional file 2: Fig. S7D). However, it was accompanied by the increased expression of genes residing in LADs, in Pc domains and those outside of any domain type (Additional file 2: Fig. S7D). We note that among 1647 genes that overlap with the HP1a domains by their bodies in Kc167 cells, only ~ 7% have significantly altered expression after HP1a KD. Altogether, this pointed to the mild (if any) effect of HP1a on the transcription or RNA stability of its actively expressed direct targets, and on the presence of indirect effect of HP1a depletion on the transcription.
Active promoters avoid association with the nuclear lamina or Pc
Because LADs mostly correspond to the silent genome regions ([9, 11], these data), we hypothesized that con served interLADs may be populated specifically by the ubiquitously expressed genes which are active in any cell type. To examine this possibility, we generated a list
of 4377 ubiquitously expressed genes (Additional file 7: Table S5) by the criterion that their expression should exceed background in any of Drosophila tissues repre sented in the FlyAtlas database [51]. Our analysis indi cates that the vast majority of ubiquitously expressed gene promoters (distal TSSs) are indeed localized in the common for all cell types Lam, Pc or HP1a interdomains (86%, 93% and 75%, respectively; Fig. 5a), covering 27%, 62% or 55% of ChAs (Fig. 2). These localization pat terns are highly nonrandom (p < 10−4 for each POI, per
mutation test). Yet, a small fraction of those promoters (14%, 7% or 25%) are intersected with LADs, Pc or HP1a domains in at least one cell type, and only the minor fraction of them overlaps with the LADs, Pc or HP1a domains conserved among various cell types (Fig. 5a). Therefore, promoters of ubiquitously expressed genes are almost always located outside LADs, Pc domains and, to a lesser degree, outside the HP1a domains.
We next analyzed whether the tissuespecifically expressed gene promoters are localized in the inter domains. Based on the RNAseq data from [52], we generated a list of tissuespecific genes expressed in the larval neurons or glial cells. The major fraction of promoters of these genes appears to locate in the inter domains (64% or 61% TSSs fall in the interLADs, 74% or 67% fall in the HP1a interdomains and 93% or 92% fall in the Pc interdomains in neurons or glia, respectively) which is significantly deviated from the random distri bution (p < 10−4 for each POI, permutation test). Upon
examination of DamID profiles, we noticed that some
lo
g(
Dam-Lam)/Dam)2
Scale
chr2R: 20340000 2035000020 kb 20360000 20370000dm3 20380000
CG3483 CG4563 CG13579
CG3492 CG3494
CG16837 CG13589 CG13590
Crtp
3.3
--0.53 _
neurons Lam
lo
g(
Dam-Pc)/Dam)2
lo
g
(Dam-HP1a)/Dam
)
2
b
c
0% 20% 40% 60% 80% 100%
HP1a Pc Lam
In non-conserved inter-domains
In conserved inter-domains
In conserved domains
Ratio of ubiquitous gene promoter
s
a
TSS TSS
Gene expression in neurons: silent weak medium high
-0.6 -0.4 -0.2 0.0 0.2 0.4 0.6 0.8
-3 -2 -1 0 1 2 3 -0.3
-0.1 0.1 0.3 0.5 0.7
-3 -2 -1 0 1 2 3 0.0
0.4 0.8 1.2 1.6 2.0
-3 -2 -1 0 1 2 3
TSS (kb) (kb) (kb)
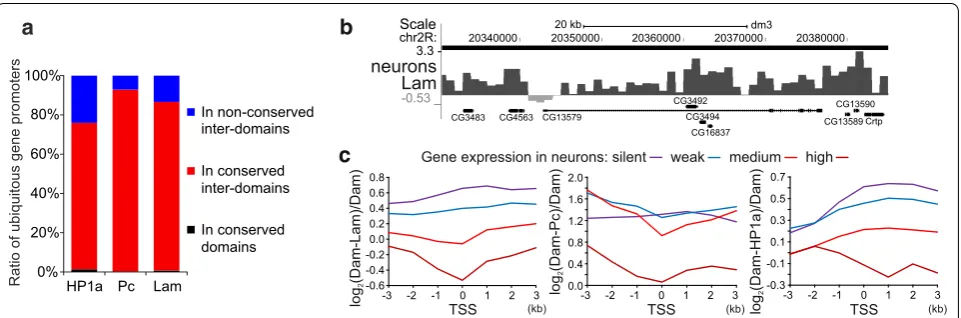
Fig. 5 Actively expressed gene promoters are not associated with the nuclear lamina and Pc. a Promoters (distal TSSs) of ubiquitously expressed genes are mainly localized in the conserved HP1a, Lam or Pc inter-domains. The percentage of ubiquitously expressed gene promoters residing in the non-conserved inter-domains (blue), conserved inter-domains (red) or conserved domains (black) is indicated. Regions common to the central brain, neurons, glia, fat body and Kc167 cells are operationally determined as conserved. b Screenshot from UCSC genome browser showing an example of the gene CG13579, which is specifically expressed in neurons, with the dip of the neuronal log2(Dam-Lam/Dam) profile at the TSS
region. Note that due to imperfectness of domain calling algorithm no gap in the HMM-determined Lam domain (black rectangle over profile) is seen. c Plotted are the median values of neuronal log2(Dam-POI/Dam) profiles (where POI is Lam, Pc or HP1a) around promoters (distal TSSs) of the
promoters of tissuespecifically expressed genes lose their interactions with the nuclear lamina, whereas their bodies stay in contact. For example, the log2(DamLam/
Dam) profile in neurons has a dip at the promoter region of neuronspecific CG13579 gene, whereas the elevated association with the nuclear lamina is revealed along its body (Fig. 5b). This dip is absent in the profile for glial cells (not shown), where CG13579 is not expressed. We separated all the genes into four groups according to their expression level and plotted medians of log2(DamPOI/
Dam) values around TSSs for the genes aligned in the 5′ → 3′ direction and overlapped by their bodies with the corresponding domain type. We found that the higher genes are expressed—the weaker the Lam, Pc or HP1a binding at their promoters (Fig. 5c). Moreover, the local minima values in the Lam, or Pc profiles, plotted for the genes with the medium or high expression, fall into the 1kb bin containing TSSs. A similar picture is seen for the glial profiles (not shown). Interestingly, the HP1a profiles for the actively expressed genes in both neurons (Fig. 5c, right panel) and glia (not shown), unlike Lam or Pc pro files, display the local minima values in the gene bodies, but not at the TSSs. We conclude that, as in mammals [10, 53, 54], promoters of a small fraction of actively expressed genes located in Drosophila LADs are mostly released from an association with the nuclear lamina. The same trend is seen for the genes residing in the Pc domains.
Centromeres are located closer to the nuclear lamina in neurons than in Kc167 cells
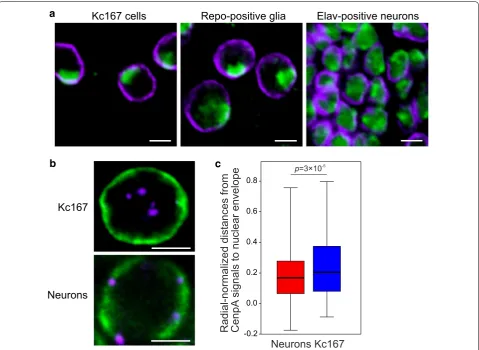
Our DamID results demonstrate the strong overlap of LADs and HP1a domains in neurons and almost com plete lack of such an overlap in Kc167 cells. To better understand this phenomenon, we immunostained neu rons, glia and Kc167 cells with antiHP1a and antiLam antibodies and examined the distribution of HP1a in the nucleus. Neuronal or glial nuclei in the third instar lar vae brain were marked by the fluorescence of DsRed.T4 protein in elavGAL4× UASRedStinger or repo
GAL4× UASRedStinger crossed flies, respectively. In agreement with the previously published HP1a distribu tion in Kc167 cells [55], we found that in Kc167 or glial cells, HP1a occupies 1–2 clearly stained pericentromeric compartments (Fig. 6a), whereas in neurons it is more uniformly distributed in the nucleus, probably reflecting more abundant binding of HP1a to the ChAs in the latter case.
Next, we examined whether the pericentromeric regions are positioned closer to the nuclear lamina in neurons than in Kc167 cells. We immunostained interphase nuclei of both cell types with antiCenpA (CID) antibodies marking the centromeres [56, 57]
and antiLam antibodies and counted the 3D distances between CenpA signals and the nuclear lamina (Fig. 6b, Additional file 2: Fig. S9). The radial distribution of cen tromeres relative to the nuclear envelope (Additional file 8: Table S6) appears to be significantly different in these two cell types being shifted toward the nuclear inte rior in Kc167 cells (Fig. 6c). Therefore, in neurons cen tromeres are indeed closer to the nuclear lamina than in Kc167 cells.
Discussion
Active promoters are mostly located away from the nuclear lamina in Drosophila
Previously, Drosophila LADs were identified only in the Kc167 cell culture of embryonic origin [11]. In this study, we mapped LADs and interLADs in various organs/cell types, including the central brain, neurons, glia and the fat body from Drosophila third instar larvae. This allows us for the first time to reveal interLADs common to all cell types, which carry the vast majority of ubiquitously expressed gene promoters (Fig. 5a). Therefore, the per manent activity and/or the special chromatin type of ubiquitous promoters [40, 58] prevent them from con tacting with the nuclear lamina in any cell type. We also found that, as in mammals [10, 53, 54], in Drosophila the active expression of some, but not all, tissuespecific gene promoters results in the loss of their association with the nuclear lamina (Fig. 5b, c). Taken together, this supports the longstanding paradigm that gene activity is poorly compatible with gene positioning at the nuclear lam ina (reviewed in [59]), which also appears to be true for
Drosophila.
Tethering of HP1a/H3K9me2‑enriched LADs to the nuclear
lamina in Drosophila and mammals may proceed
via similar mechanism
periphery in the nematode [13, 63]. Our analysis indi cates that the conserved LADs are remarkably less abun dant in Drosophila (Fig. 2) compared to mammals, where they occupy 33% of nonrepetitive genome [47]. More over, LADs are notably more variable in Drosophila than in mammals. Weak conservation of LADs among cell types with various expression patterns indicates that in
Drosophila, unlike mammals, the chromatin features are dominant over specific nucleotide sequences in determi nation of chromatin positioning at the nuclear lamina. Nevertheless, our findings that LADs in the diverse dif ferentiated cell types of Drosophila are HP1aenriched (Fig. 3a, b), like LADs in mammals which are enriched
with H3K9me2 [9, 23–25], point to an existence of a cog nate mechanism responsible for heterochromatin attach ment to the nuclear lamina in both cases.
Different effects of HP1a on transcription of genes residing inside and outside LADs
In agreement with the previously formulated hypothesis [48, 64], we suggest that the increased HP1a binding in LADs may be necessary to prevent harmful transcrip tional leakage of silent genes residing in the active chro matin environment. The HP1a enrichment on the male X chromosome may counteract the activity of dosage compensation complex. Several lines of evidence support
Kc167 cells
Repo-positive glia
Elav-positive neurons
a
b
c
Kc167
Neurons
-0.2 0.0 0.2 0.4 0.6 0.8
Radial-normalized distances from
Cenp
A
signals to nuclear envelop
e
p=3×10⁻⁵Neurons Kc167
this idea. Firstly, depletion of HP1a resulted in specific decondensation of the X polytene chromosome in Dros ophila males [65], as well as in the predominant male lethality [66], linking HP1a enrichment on the X chro mosome (Fig. 3c, d) with a phenomenon of dosage com pensation. Secondly, consistent with the previous results [11] and according to our data, silent or weakly expressed genes reside in LADs in all organs/cell types examined (Fig. 4a), and genes occupying the HP1aenriched LADs are expressed even more weakly (Fig. 4b). Thirdly, artifi cial recruitment of HP1a to the promoter of a reporter gene, integrated at numerous sites in Kc167 cells, resulted in the threefold to fourfold repression of its transcription [67]. Finally, Lam depletion in the fat body of young flies caused a reduction in the level of HP1a accompanied by the derepression of a set of immune response genes [68], thus pointing to the collaboration of Lam and HP1a in the repression of genes unwanted in a particular tissue.
Several studies in Drosophila indicate that HP1a may be paradoxically involved in the activation of expres sion of a particular set of genes ([69–74], reviewed in [75]). Our results also indicate that outside LADs HP1a is bound to the subset of actively expressed euchromatic genes in Kc167 cells, as well as in the central brain, neu rons, glia and fat body (Fig. 4c). However, the mode of HP1a binding to the actively expressed genes is likely dif ferent from its binding in LADs. Indeed, it was shown that HP1a interacts with the active RNA polymerase II and directly binds proteincoding gene transcripts [69]. In neurons, we found the increased association of HP1a with the promoters of actively expressed genes and rather uniform distribution of HP1a along the genes expressed at lower levels (Fig. 5c, right panel). Unfortunately, our analysis of microarray gene expression data from HP1a depleted Kc167 cells [50] did not permit us to come to definite conclusions concerning the HP1a effects on the transcription of actively expressed genes. According to this analysis (Fig. 4d, Additional file 2: Fig S7D), HP1a may have either a neutral or the weak repressive effect on the transcription or RNA stability of these targets. How ever, it could not be excluded that strong side effects of HP1a depletion may mask its genuine action. Therefore, we propose that HP1a may enhance the repression of tar get genes, when bound in LADs, or affect transcription or transcript stability by an unknown mode (if any), when bound to the subset of actively expressed genes residing outside LADs.
Maturation of heterochromatin in differentiated cells
Previously, the HP1a/H3K9me2enriched chromatin in Kc167 cells was classified as the “GREEN” chroma tin type [40]. These regions in Kc167 cells do not inter act with the nuclear lamina (Fig. 3a) and mostly contain
actively expressed genes (Fig. 4a). In the present study, we reveal in larval neurons and, less abundantly, in glia and the fat body the previously uncharacterized in Dros ophila peripheral chromatin, which is bound by HP1a (Fig. 3a). Whether this is a novel heterochromatin type for Drosophila or a partial reposition of the “GREEN” chromatin type from nuclear interior to the nuclear lamina is currently unclear. We found that in the central brain the presence of TEs is significantly increased next to the HP1abound LADs, as compared to LADs with out HP1a. Our findings point to the possibility that TEs may recruit HP1a as seeding points from which the HP1a spreads into the flanking regions. This idea is supported by the revealed spreading of H3K9me2/3enriched chro matin on up to 20kb distances from the TE insertion sites in Drosophila [76].
Besides binding of HP1a in LADs, we observe a gene ral HP1a enrichment on the X chromosome, especially in males (Fig. 3c, d), which is in agreement with the previ ously reported data [48]. This enrichment may be a con sequence of specific DNA motifs overrepresented on the X chromosome or different spatial proximity of the X chromosome and autosomes to the CHet compartments.
Our results are consistent with the analysis of Rid dle et al. [64], who revealed the extended H3K9me2 enriched domains, occupied by HP1a, in the ChAs of
Drosophila BG3 cell culture originated from the larval central nervous system [77], although similar domains were not detected in the embryonic Kc167 cells [64]. Taken together, these findings support the view that chromatin at the nuclear periphery becomes gradually HP1a/H3K9me2enriched during terminal cell differen tiation in Drosophila [78]. Interestingly, this is in con trast to mammals, where the Pc/H3K27me3 but not the H3K9me3enriched domains expand in the tissues dur ing development [79].
in [81]). The relocalization of CHet compartments dur ing differentiation is not unique to Drosophila. The LBR dependent repositioning of pericentromeric regions from the nuclear lamina to the nuclear interior [82, 83] or vice versa [84] during differentiation of some mammalian cell types has previously been reported. Moreover, upon glial cell differentiation in mice, the pericentromeric regions were shown to increasingly associate with the nuclear periphery and repress active reporter genes artificially recruited to their proximity [85].
Recently, using targeted DamID approach [42], sev eral factors linked to either repressive (Pc, HP1a, histone H1) or active (Brahma, RNA polymerase II) chromatin states in Drosophila neural stem cells and neurons were mapped genome wide [86]. This led to the conclusion that Pcmediated repression does not play a significant role during neuronal differentiation. Instead, in neu rons almost all key neural stem cell genes appear to be switched off via HP1amediated repression concomitant with the approximately twofold increase in HP1a genome coverage [86]. These conclusions are in agreement with the findings of the present study, namely, with the low variability of Pc domains in different organs/cell types (Fig. 2) and with the drastically higher HP1a genome occupancy in neurons as compared to embryonic Kc167 cells (Fig. 3d). Importantly, the mapping of LADs in vari ous organs/cell types, described here, allowed to uncover that in various differentiated cell types, including neu rons, the HP1a becomes enriched in the chromosomal regions associated with the nuclear lamina.
Conclusions
Mapping of LADs in various organs/cell types of Dros ophila third instar larvae shows that they are less con served than LADs in mammals. In the terminally differentiated cells, such as neurons, Drosophila LADs become strongly occupied by HP1a, the reader of H3K9me2/3, which is in sharp contrast with Kc167 cells of embryonic origin. As LADs in mammals are enriched with H3K9me2/3, mechanisms of heterochromatin com paction and attachment to the nuclear lamina may be similar in Drosophila and mammals. Expression of genes located in LADs is generally very weak, and genes in the HP1enriched LADs are expressed at the lowest level. Therefore, HP1a binding introduces an additional level of repression in LADs. The compartments of constitutive heterochromatin, revealed by centromere immunostain ing, reside closer to the nuclear lamina in neurons than in Kc167 cells. Combined, these findings support the model that maturation of peripheral heterochromatin is required for the stronger repression of genes, which should not be expressed in the terminally differentiated cells.
Methods
Fly stocks and handling
Fly stocks were maintained under standard conditions at 25 °C. Transgenic fly lines bearing Dam4HTintein@L127C
HP1 and STOP#1DamHP1 constructs were generated by φC31mediated sitespecific integration at the 51C site of the stock #24482 (the Bloomington Drosophila Stock Center) by BestGene company (http://www.thebe
stgen e.com/). All DamID transgenic flies used in the
study are available from the Bloomington Drosophila Stock Center under accession numbers #65429–65432 (intein system) and #65433–65436 (stopcassette excision system). The repoFLP stock [87] was kindly provided by Christian Klambt (Institut fur Neurobiologie, Universitat Munster, Munster, Germany). The elavGAL4 (#8760),
UASFLP (#8208) and UASRedStinger (#8547) stocks were obtained from the Bloomington Drosophila Stock Center. To perform DamID in the fat body, intein exci sion was induced by 4hydroxytamoxifen (4HT; Sigma Aldrich). For that, 4HT was added to the fly food at a final concentration of 25 μM and then mated female flies were allowed to lay eggs on this food. Thus, larvae were exposed to 4HT from hatching until they were collected in the third instar stage. To perform DamID in the cen tral brain of third instar larvae, the spontaneous excision of intein (without 4HT induction) [44] was utilized. The scheme of fly crossing for DamID profiling in neurons is presented in Additional file 1.
DamID‑seq
A few dozen central brains or fat bodies from wandering third instar male larvae or, in case of Repopositive glia or Elavpositive neurons, from a mix of male and female lar vae were manually dissected and collected as described previously [45]. Isolation of genomic DNA, amplification of Dammethylated genomic fragments and their subse quent HTS were performed according to [45]. Eighteen cycles of PCR amplification (1 min at 94 °C, 1 min at 65 °C, 2 min at 68 °C) were applied for all DNA samples. HTS on Illumina HiSeq 2000 instrument was performed at the Genomics Core Facility of The Netherlands Cancer Institute and resulted in from ~ 25 to ~ 120 million 51nt singleend reads per sample (Additional file 9: Table S7).
Bioinformatic analysis of DamID‑seq data
than on the GATC–GATC fragments of various lengths. Bin size was determined empirically as a compromise between increased genome read coverage and decreased DamID resolution. Read counts were merged between replicates, as they were highly correlated (Additional file 2: Fig. S2). The resulting read counts of Dam or Dam POI samples were converted to reads per million (RPM), and then, DamPOI values were normalized to those of the Dam and log2 transformed. Since for each POI the
dynamic range of log2transformed profiles in different
organs/cell types was rather different and we wanted to make crosstissue comparisons, quantile normalization between organs/cell types was applied. We propose that variability in the dynamic range is caused by the differ ent DamID approaches used (the induced/uninduced intein and stopcassette excision systems) and has no biological relevance. This is supported by the high corre lation between DamID profiles in the central brain and neurons, while the dynamic ranges of log2 profile in these
organs/cell types were quite different. On the contrary, a substantially lower correlation was observed between the central brain and glial cells, which were just slightly dif ferent in the dynamic ranges of log2 profiles.
HP1a and Lam domain calling was performed with a twostate HMM algorithm (the scripts for DamIDseq analysis are available in the GitHub repository (https :// githu b.com/forii n/DamID seq). For determination of Pc domains, we applied threestate HMM, as for unknown reasons twostate HMM overestimated domain pres ence in the central brain (not shown). The domains for Lam, HP1a and Pc in Kc167 cells generated by DamID microarray approach [40] were retrieved from GSE22069. The median size of the Lam domains (Additional file 2: Fig. S3, [40]) appears to be smaller than was previously reported for Kc167 cells (~ 90 kb [11]) most probably due to different algorithms employed for domain calling. The actual domain sizes are likely much larger than provided in Additional file 2: Fig. S3 because HMM does not fill the gaps that originated over the bins that contained no mapped reads in the Dam profile. However, this under estimation of domain sizes does not distort the further analysis of domain/domain or gene/domain intersections which were computed in R as a ratio of genome cover age using the “GenomicRanges” package in Bioconductor [90]. To perform permutation analysis, we invoked “BED Tools” [91] in R to shuffle domains and TSSs (or genes) 10,000 times and then counted the number of TSSs (or genes) that intersected with domains or interdomains.
Bioinformatic analysis of RNA‑seq and microarray expression data
RNAseq data for the central larval brain and fat body were taken from GSE75835 [44], and for Kc167
cells—from GSE15596 [49]. RSEM software [92] was used for analysis, and transcripts per million (TPM) val ues were obtained as an output. Microarray expression data for control and HP1adepleted Kc167 cells were retrieved from GSE18092 [50], converted back to the nonlog2transformed values (with p < 0.05) and aver
aged between replicates. Differentially expressed genes upon HP1a KD were determined using the “limma” R package [93]. Only genes with the cutoff for adjusted p
values < 0.05 were used for further analysis.
Generation of lists of ubiquitously or tissue‑specifically expressed genes
If at least 3 (out of 4) present calls (i.e., values exceeding background) in each of 15 adult and larval Drosophila tis sues/organs in the wholetranscriptome RNAchip data (GSE7763 [51]) were found, the transcript was identified as being ubiquitously represented. If at least one spliced transcript variant of a gene was classified as ubiqui tous, then the gene was identified as being ubiquitously expressed. As a result, 4377 ubiquitously expressed genes were revealed (Additional file 7: Table S5).
To generate the lists of tissuespecific genes expressed in neurons or glia, we employed RNAseq data from lar val neurons or glial cells (GSE71104 [52]). TPM values for two replicates were averaged. Proteincoding genes with TPM values ≥ 1 were considered as expressed. The tissuespecific gene lists were formed by the subtraction of ubiquitous genes from the lists of genes expressed in neurons or glia. Genes ranked by TPM values were sepa rated into four groups according to their expression level (silent: TPM 0–1; low: TPM 1–10; medium: TPM 10–44 for neurons and 10–42 for glia; high: TPM > 44 for neu rons and > 42 for glia) with an equal number of genes in each of the three last groups. For the plots in Fig. 5c, genes were oriented in the 5′ → 3′ direction starting from their promoters (distal TSSs) and medians of non quantile normalized log2(DamPOI/Dam) values across
seven genomic bins centered at gene promoters (three bins upstream and three bins downstream from the zero bin) were calculated. Only genes overlapped with the corresponding domain type by their bodies and only the upstream bins not overlapped with other genes and the downstream bins carrying the corresponding gene were taken for the analysis.
Analysis of distribution of TEs in the genome
Genomic positions for 3183 TE insertions in the Droso
phila dm3/R5 genome assembly (within the ChAs
chromosome, according to Riddle et al. [64]) were down loaded from the FlyBase ftp site (ftp://ftp.flybase.net/ releases/FB2014_03/dmel_r5.57/gff/dmelallr5.57.gff. gz). To analyze whether there is any preference in the TE localization in the vicinity of LADs bound or unbound with the HP1a, we estimated the observed to expected number of insertion events after random reshuffling of TEs and domains for 104 times (i.e., in the permutation
test). As we considered only uniquely mapped reads dur ing DamIDseq analysis, the TE sequences were mostly excluded from the identified LADs and HP1a domains. Therefore, the observed number of insertion events was counted as a number of overlapping events between posi tions of TEs, extended by 0.5 kb from their ends, and the domains.
Statistical analysis
For p value estimation, the Mann–Whitney (M–W) U
test was used for comparison of two sample distributions.
p values for occasional gene/domain or domain/domain overlapping were estimated by permutation test with 10,000 permutations.
Cell culture
Kc167 cells obtained from Drosophila Genomics Resource Center were grown in Schneider’s Drosophila
medium (Gibco) supplemented with 10% heatinacti vated FBS (Gibco), 50 units/ml penicillin and 50 µg/ml streptomycin.
Immunostaining
Immunostaining was performed as previously described in [94] with some modifications. Kc167 cells in the growth phase were collected and rinsed two times in PBS. Central brains from third instar larvae were manu ally isolated in PBT (PBS containing 0.01% Tween20) on ice and then rinsed in PBS. Cells or brains were fixed in 4% formaldehyde (in PBT) for 25 min at room tempera ture. Fixation was stopped by incubation with 0.25 M gly cine (SigmaAldrich) for 5 min. Then, cells or brains were washed in PBS three times for 10 min at room tempera ture, permeabilized with PBTX (PBS with 0.1% Tween20, 0.3% Triton X100) for 10 min, blocked with PBTX con taining 3% normal goat serum (NGS, Invitrogen) at room temperature for 1 h (cells) or for 3 h (brains), incubated with primary antibody in PBTX containing 3% NGS for 3 h (cells) or for 7 h (brains) at room temperature, or overnight at 4 °C, washed in PBTX three times for 10 min at room temperature, incubated with secondary antibod ies (1:1000) in PBTX containing 3% NGS for 3 h (cells) or for 7 h (brains) at room temperature, or overnight at 4 °C, and then washed in PBTX three times for 10 min
at room temperature in a dark chamber. Coverslips were mounted with a drop of SlowFade Gold Antifade reagent (Invitrogen) containing DAPI. As the primary, rabbit pol yclonal antiHP1a (1:500, Covance #PRB291C), mouse monoclonal antiLam (ADL84, 1:500 [95]), or chicken polyclonal antiCenpA (CID, 1:600, [57]) antibodies were used. As the secondary, Alexa Fluor 488conjugated goat antirabbit IgG (Invitrogen), Alexa Fluor 488conjugated, Alexa Fluor 633conjugated goat antimouse IgG (Invit rogen), or Alexa Fluor 633conjugated goat antichicken IgG (Invitrogen) antibodies were used.
Measuring distances from centromeres to the nuclear lamina
Threedimensional image stacks were recorded with a confocal LSM 510 Meta laser scanning microscope (Zeiss). Optical sections were captured at 0.4–0.6μm intervals along the Zaxis. Images were processed and analyzed using IMARIS 7.4.2 software (Bitplane AG) with a blind experimental setup. Images were thres holded to eliminate hybridization and immunostain ing background effects. The distances between signals and the nuclear envelope were counted as previously described [16]. Briefly, nuclear lamina stained by anti Lam antibodies was manually outlined by its middle in each plane of the Zstack, before automatic reconstruc tion of the nuclear surface by IMARIS. One measure ment point was positioned in the optical section with the brightest CenpA signal, at its visually determined center, and another one was placed on the reconstructed nuclear surface at the point of its earliest intersection with the progressively growing sphere from the first measurement point. The distance between the measurement points (the shortest distance between the center of CenpA sig nal and the middle of nuclear lamina) was measured for each nucleus. Data were obtained in two independent experiments for 50–60 nuclei per experiment (Additional file 8: Table S6). Distances were normalized on the nuclei radii, and radialnormalized distances in neurons and Kc167 cells were compared.
Additional files
Additional file 1. Scheme of fly crossing for DamID in neurons.
Additional file 2. Figures S1–S9.
Additional file 3. Table S1: HP1a, Lam and Pc domain coordinates in the central brain, neurons, glia and fat body.
Additional file 5. Table S3: Expression of genes according to the RNA-seq data from [44, 49] with the indication of promoter location within HP1a, Lam or Pc domains in the central brain, fat body and Kc167 cells.
Additional file 6. Table S4: Differentially expressed gene list upon HP1a KD in Kc167 cells with the indication of intersection of gene bodies with HP1a, Lam or Pc domains. Microarray expression data were from [50].
Additional file 7. Table S5: List of ubiquitously expressed genes based on microarray expression data from [51] with the indication of promoter location within the conserved HP1a, Lam and Pc domains or within the conserved inter-domains.
Additional file 8. Table S6: Distances from the CenpA signals to the nuclear lamina in Elav-positive neurons and Kc167 cells.
Additional file 9. Table S7: HTS raw data parameters.
Abbreviations
4-HT: 4-hydroxytamoxifen; ChAs: chromosome arms; CHet: constitutive heterochromatin (the 2LHet, 2RHet, 3LHet, 3RHet, XHet chromosome regions of dm3/R5 genome assembly); H3K27me3: trimethylated Lys27 of histone H3; H3K9me2: dimethylated Lys9 of histone H3; HMM: hidden Markov model; HP1a: heterochromatin protein 1a; HTS: high-throughput sequencing; KD: knockdown; LADs: lamina-associated chromosomal domains; Lam: lamin Dm0; M–W U test: Mann–Whitney U test; NGS: normal goat serum; Pc: Poly-comb; PcG: Polycomb group; PCR: polymerase chain reaction; POIs: proteins of interest; RPM: reads per million; TEs: transposable elements; TPM: transcripts per million; TSS: transcription start site.
Authors’ contributions
BvS conceived the project. BvS, AVP and YYS designed the experiments. AVP, AAI, MVT, EAM and YYS performed the experiments. AAI, AVI, VVN, LP, AVP and YYS analyzed the data. YYS and AVP wrote the manuscript. All authors read and approved the final manuscript.
Author details
1 Division of Gene Regulation, Netherlands Cancer Institute, 1066 CX Amster-dam, The Netherlands. 2 Department of Regulation of Genetic Processes, Insti-tute of Molecular and Cellular Biology, Siberian Branch of Russian Academy of Sciences, Novosibirsk, Russia 630090. 3 Laboratory of Structural, Functional and Comparative Genomics, Novosibirsk State University, Novosibirsk, Russia 630090. 4 Department of Molecular Genetics of Cell, Institute of Molecular Genetics, Russian Academy of Sciences, Moscow, Russia 123182. 5 Present Address: QC Biochemistry Lab, Yaroslavl Pharmaceutical Complex for Produc-tion of Finished Dosage Forms, R-Pharm Group, Yaroslavl, Russia 150061. 6 Department of Viral and Cellular Molecular Genetics, Institute of Molecular Genetics, Russian Academy of Sciences, Moscow, Russia 123182. 7 Department of Cell Biology, Erasmus University Medical Center, 3015 GE Rotterdam, The Netherlands.
Acknowledgements
We thank Garry Karpen for CenpA antibody, Paul Fisher for Lam anti-body, Christian Klambt for the repo-FLP fly stock, the Bloomington Drosophila Stock center for other fly stocks, and Center of Common Scientific Equipment of the Institute of Molecular Genetics, RAS, for providing access to the confo-cal microscope.
Competing interests
The authors declare that they have no competing interests.
Availability of data and materials
Raw and processed DamID-seq data for Pc, Lam and HP1a in the central brain, Elav-positive neurons, Repo-positive glia and the fat body are available in the NCBI Gene Expression Omnibus (GEO) under the accession number GSE109495. Scripts for DamID-seq analysis are available in the GitHub reposi-tory (https ://githu b.com/forii n/DamID -seq).
Consent for publication Not applicable.
Ethics approval and consent to participate Not applicable.
Funding
Funding for this work was provided by the ERC Advanced Grant (293662 to BvS), by Russian Foundation for Basic Research Grants (13-04-00602 and 16-04-00439), by the Program for Molecular and Cellular Biology from Presidium of Russian Academy of Sciences (0105-2018-0026), by Russian Fundamental Scientific Research Program (0310-2018-0009 and 0105-2018-0001) and by Russian Science Foundation Grants (16-14-10288 regarding DamID-seq data processing and 16-14-10081 in part of microscopic studies).
Publisher’s Note
Springer Nature remains neutral with regard to jurisdictional claims in pub-lished maps and institutional affiliations.
Received: 20 June 2018 Accepted: 26 October 2018
References
1. Trojer P, Reinberg D. Facultative heterochromatin: is there a distinctive molecular signature? Mol Cell. 2007;28:1–13.
2. Cabianca DS, Gasser SM. Spatial segregation of heterochromatin: uncov-ering functionality in a multicellular organism. Nucleus. 2016;7:301–7. 3. Solovei I, Kreysing M, Lanctôt C, Kösem S, Peichl L, Cremer T, Guck J, Joffe
B. Nuclear architecture of rod photoreceptor cells adapts to vision in mammalian evolution. Cell. 2009;137:356–68.
4. Prokocimer M, Davidovich M, Nissim-Rafinia M, Wiesel-Motiuk N, Bar DZ, Barkan R, Meshorer E, Gruenbaum Y. Nuclear lamins: key regulators of nuclear structure and activities. J Cell Mol Med. 2009;13:1059–85. 5. Gruenbaum Y, Foisner R. Lamins: nuclear intermediate filament proteins
with fundamental functions in nuclear mechanics and genome regula-tion. Annu Rev Biochem. 2015;84:131–64.
6. van Steensel B, Henikoff S. Identification of in vivo DNA targets of chro-matin proteins using tethered dam methyltransferase. Nat Biotechnol. 2000;18:424–8.
7. van Steensel B, Delrow J, Henikoff S. Chromatin profiling using targeted DNA adenine methyltransferase. Nat Genet. 2001;27:304–8.
8. Pickersgill H, Kalverda B, de Wit E, Talhout W, Fornerod M, van Steensel B. Characterization of the Drosophila melanogaster genome at the nuclear lamina. Nat Genet. 2006;38:1005–14.
9. Guelen L, Pagie L, Brasset E, Meuleman W, Faza MB, Talhout W, Eussen BH, de Klein A, Wessels L, de Laat W, et al. Domain organization of human chromosomes revealed by mapping of nuclear lamina interactions. Nature. 2008;453:948–51.
10. Peric-Hupkes D, Meuleman W, Pagie L, Bruggeman SW, Solovei I, Brug-man W, Gräf S, Flicek P, Kerkhoven RM, van Lohuizen M, et al. Molecular maps of the reorganization of genome-nuclear lamina interactions dur-ing differentiation. Mol Cell. 2010;38:603–13.
11. van Bemmel JG, Pagie L, Braunschweig U, Brugman W, Meuleman W, Kerkhoven RM, van Steensel B. The insulator protein SU(HW) fine-tunes nuclear lamina interactions of the Drosophila genome. PLoS ONE. 2010;5:e15013.
12. Ikegami K, Egelhofer TA, Strome S, Lieb JD. Caenorhabditis elegans chro-mosome arms are anchored to the nuclear membrane via discontinuous association with LEM-2. Genome Biol. 2010;11:R120.
13. Towbin BD, González-Aguilera C, Sack R, Gaidatzis D, Kalck V, Meister P, Askjaer P, Gasser SM. Step-wise methylation of histone H3K9 positions heterochromatin at the nuclear periphery. Cell. 2012;150:934–47. 14. Finlan LE, Sproul D, Thomson I, Boyle S, Kerr E, Perry P, Ylstra B, Chubb JR,
Bickmore WA. Recruitment to the nuclear periphery can alter expression of genes in human cells. PLoS Genet. 2008;4:e1000039.
15. Reddy KL, Zullo JM, Bertolino E, Singh H. Transcriptional repression mediated by repositioning of genes to the nuclear lamina. Nature. 2008;452:243–7.