Cervical Cell Classification using Learning Vector
Quantization (LVQ) Based on Shape and Statistical
Features
https://doi.org/10.3991/ijoe.v15i02.9796
Erlinda Metta Dewi, Endah Purwanti (*), Retna Apsari Airlangga University, Surabaya, Indonesia
Abstract—This research was conducted to design a system that is able to classify cervical cells into two classes, namely normal cells or abnormal cells. We use digital images of single cervical as research materials and Learning Vec-tor Quantization (LVQ) as classification method. Prior to classification, the nu-cleus areas of single cervical cell images were segmented and features were ex-tracted. The features used in this study are 7 kinds of which consist of 2 types of feature, namely shape features and statistical features. The shape features used are area, perimeter, shape factor, and roundness of the nucleus, while the statis-tical features of the grayscale image histogram used are mean, standard deviation, and entropy. LVQ optimal parameter values based on the highest accuracy of training data, are learning rate 0.1 and learning rate reduction 0.5. The highest accuracy of system obtained from 45 testing data is 93.33%.
Keywords—Single cervical cell image, cervical cell classification, features ex-traction, Learning Vector Quantization.
1
Introduction
Cervical cancer ranks as the second most common type of cancer affecting women around the world and 80% of death cases come from developing countries [1]. Unlike other cancers, cervical cancer can be prevented with proper treatment when the cells are still in the precancerous stage, it is the stage where the abnormal cervical cells al-ready detected but still have not reached the cancerous stage [2].
can be used as classification’s input [4]. Agustina use the ratio of the nucleus to the cytoplasm and produces an accuracy of 78% for abnormal cells image [5]. Meutia use the image intensity values from segmented cervical cell image to classify cervical cells using Learning Vector Quantization (LVQ) method which produces an accuracy of 82% [6]. LVQ is one of the ANN models which has a fairly simple architecture but has good performance as a classification engine.
This study seeks to combine the best features of previous research studies. There are 4 features of the form taken, including the area, perimeter, roundness and nucleus form factor. In addition we also propose 3 features of histogram, namely the mean, standard deviation and entropy with the aim of obtaining cervical cell texture. According to Hoda, the worse the abnormal condition of cervical cells, the cell nucleus will appear increasingly irregular and there is granulation [7]. So that the overall features used in this study are 7 features. For classification machines, we use LVQ as one of the super-vised neural network models that are reliable in speed and accuracy of data pattern recognition.
2
Materials and Methods
2.1 Data preparation
Digital image data of single cervical cell used in this study were obtained from the database built by Department of Pathology, Herlev University Hospital, Denmark. Each image was visually inspected (manually) and classified into normal cells and abnormal cells by 2 cytologists and a doctor. The entire images are in bitmap (*.bmp) with a resolution of 0.201 micrometer/pixel. The number of images used as many as 65 data for normal cells (50 data for LVQ training and 15 data for LVQ testing) and 130 data for abnormal cells (100 data for LVQ training and 30 data for LVQ testing).
2.2 Program design
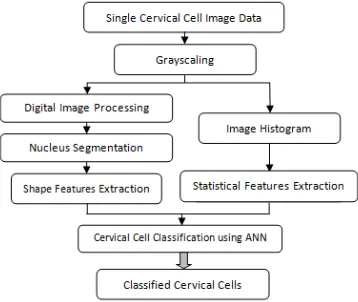
The design of the program consists of nucleus segmentation, shape and statistical features extraction, and classification of a single cervical cell with a artificial neural network, as shown in Figure 1.
Fig. 1. Flowchart of program design
2.3 Digital image processing
Digital images of a single cervical cell changed from a color image into a grayscale image that has only one color component with the intensity range from 0 to 255. Image preprocessing method of median filtering and contrast stretching were used to improve the image quality before further processing. Filtering is a method of improving the im-age quality and is used to reduce noise [8]. Median filtering is a filtering technique that uses the median values of the kernel matrix as a new pixel value at the center of the kernel. This technique is better than the mean filtering in terms of preserving the sharp-ness of image edges. Contrast stretching is a technique to improve image contrast by stretching the image field with remapped pixel intensities in the new range. Image con-trast stretching results are then processed by morphological processing operations such as opening and closing to reduce the small areas that appear light or dark (small bright or dark regions) that can interfere with the process of nucleus segmentation. Morpho-logical processing is an operation on the image to produce a binary modified image. Morphological processing basically consists of two basic operations, namely dilation and erosion [9]. Opening is a process that consists of erosion operation followed by a dilation operation with the same SE (structuring element). Conversely, closing is a pro-cess that consists of dilation operation followed by erosion operation with the same SE.
2.4 Nucleus segmentation
2.5 Features extraction
Types of features used in this study are shape features and statistical features. Shape features obtained from the binary image of the nucleus, while the statistical features obtained from a grayscale image histogram. The features used are as follows:
Shape Features [10]:
• Nucleus area: scalar value that states the total number of the nucleus pixels. • Nucleus perimeter: scalar value that states the number of nucleus outline pixels.
Nucleus shape factor: scalar value which is defined in equation 1.
(1) Nucleus roundness: scalar value which is defined in equation 2.
(2)
Statistical Features [7]:
Mean: scalar value which is defined in equation 3.
(3) Standard deviation: scalar value which is defined in equation 4.
(4) Entropy: scalar value which is defined in equation 5.
(5)
2.6 LVQ Training
Features extraction values will be used as the input data for ANN. LVQ is the ANN method that is used for the classification of cervical cells are. LVQ implementation includes two terms, the data training and the data testing. Cervical cell images will be classified into groups of normal cells and abnormal cells.
feature datasets in a 150 x 7 matrix size and used as input data for the ANN training process.
Initial weights used are the features values of image data for each of the target clas-sification, i.e. normal cells (the target was given a value of 1) and abnormal cells (the target was given a value of 2). LVQ parameters that are varied for system training needs are the learning rate (α) of 0.1; 0.01 and 0.001. Whereas the reduction in learning rate (decα) varied as follows: 0.01, 0.1; 0.25 and 0.5.
3
Result and Discussion
A total of 195 digital image data is passing through a series processes consist of image processing, nucleus segmentation, and feature extraction. The data is divided into two groups, there are 150 training data and 45 testing data for LVQ implementa-tion. Each group of data includes 2 target class, the normal cells and the abnormal cells. The testing data is used in the validation test that aims to determine the accuracy of the program that has been created.
3.1 Nucleus segmentation result
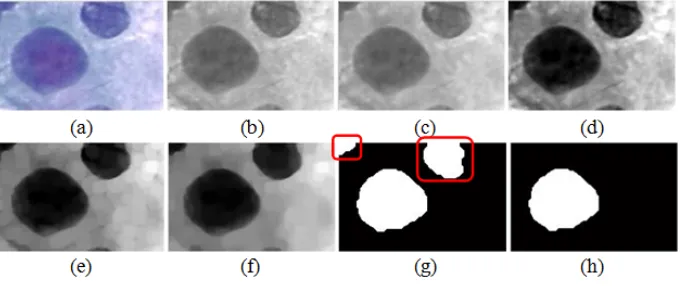
Having gone through the processes of image processing, starting from median filter-ing, contrast stretchfilter-ing, and morphological processing such as opening and closing op-eration, the nucleus from the image is then segmented. Nucleus segmentation is done by using thresholding method with a value of 0.2. The nucleus binary image result from thresholding still leaves other objects at the image border that are not part of the nu-cleus. A clearing operation from morphological processing method is used to remove that objects, as shown in Figure 2.
Fig. 2. Nucleus segmentation processes (a) original image
3.2 Features extraction result
From the features extraction results, there are 2 features which are the most powerful features, the nucleus area and the nucleus perimeter. It because these features have quite a big difference and not many overlapping values between normal cells and abnormal cells. While the other 5 features, which are nucleus shape factor and roundness, mean, standard deviation, and entropy, even though it can be used as features for classification of cervical cells, but these features are still classified as a weak feature due to the dif-ference values is significantly thinner and more values are overlapping between the normal cells and abnormal cells.
3.3 LVQ training result
LVQ training is done with the parameter values and some variations in the value of learning rate (α) and learning rate reduction (decα) as given in Table 1. After the LVQ training process is complete, the final weights obtained will be used for testing back the training image data that have previously been trained. The testing back is done to de-termine the optimal parameter values of α and decα to be used to classify cervical cells. The accuracy of training data based on the variation of parameter values α and decα is shown in Table 1.
Table 1. Table with the training data accuracy variation of α and decα
From Table 1, the highest value of the training data accuracy is 88.67%. This accu-racy obtained by using the parameter values α of 0.1 and decα of 0.5. The value of α and decα is the optimal parameter values for the classification of cervical cells. Hence-forth, the final weights obtained after LVQ training with these parameter values will be saved and used for the testing of testing image data to obtain the optimal accuracy of cervical cells classification system.
3.4 LVQ testing result
In LVQ testing, the image data used as many as 45 image data consist of 15 normal cell image data and 30 abnormal cell image data. The testing process is done based on
α Dec α Accuracy
0.1
0.01 83.33%
0.1 84%
0.25 84.67%
0.5 88.67%
0.01
0.01 83.33%
0.1 85.33%
0.25 86.67%
0.5 71.33%
0.001
0.01 85.33%
0.1 45.30%
0.25 40.30%
the final weights obtained after LVQ training with optimal parameter values α of 0.1 and decα of 0.5. Testing data classification is done based on the proximity distance (D) between the value of testing data features and the final weights obtained from LVQ training. If the distance between the value of testing data features and the first final weights (normal cell class) is smaller then the data will be classified into normal cells, to the contrary, if the distance between the value of testing data features and the second final weights (abnormal cell class) is smaller then the data will be classified into the abnormal cells.
To determine the optimal accuracy of cervical cell classification system, the results of testing data classification based on LVQ are compared with the target of classifica-tion which is the classificaclassifica-tion done by cytologists and doctor. The accuracy rate from testing data classification is shown in Table 2.
Table 2. Table of accuracy rate from testing data classification
Class Amount Match Not Match Accuracy
Normal cell 15 15 0 100%
Abnormal cell 30 27 3 90%
Total 45 42 3 93.33%
From the results of 45 testing data, 42 data are match and 3 data are not match. This results provide optimal accuracy of cervical cells classification system by 93.33%. If the accuracy is separated between normal and abnormal classes, the accuracy of normal class is 100% and the accuracy of abnormal class is 90%.
The highest accuracy rate of 93.33% is better than the previous study [6], which results an accuracy rate of 82% with the same ANN network (LVQ method) and the same case of classification, which is the classification of a single cervical cell into nor-mal and abnornor-mal classes.
4
Conclusion
This study has succeeded in identifying the digital image of a single cervical cell into 2 classes, namely the normal class and the abnormal class. The scenario of network parameter variations shows that the optimal LVQ parameter has been obtained, namely learning rate 0.1 and reduction in learning rate 0.5. The selection of the 7 best features of cervical cell images is also able to support the performance of the classification en-gine so that it can recognize 45 test data with the highest accuracy of 93.33%.
5
References
[1] WHO. 2002. Cervical Cancer Screening in Developing Countries. ISBN 92-4-154572-0, Geneva.
[3] Suwiyoga, I Ketut. 2004. Beberapa Masalah Pap Smear sebagai Alat Diagnosis Dini Karak-ter Serviks di Indonesia. Laboratorium Obstetri dan Ginekologi Fakultas KedokKarak-teran Uni-versitas Udayana. Denpasar.
[4] Norup, Jonas. 2005. Classification of Pap Smear Data by Transductive Neuro- Fuzzy Meth-ods. University of Denmark.
[5] Agustina, Silvia. 2008. Analysis of Pap Smear Image Using Computer Software. Faculty of Life Science, Biomedical Engineering, Swiss Germany University (SGU).
[6] Meutia, Syarifah Dina. 2009. Segmentasi Citra Sel Serviks Menggunakan Algoritma Mul-tifraktal dengan Adaptive Multiple Thresholding dan Klasifikasi Menggunakan Learning Vector Quantization. Fakultas Ilmu Komputer, Program Studi Ilmu Komputer, Universitas Indonesia.
[7] Hoda, Rana S., Hoda, Syed. A., 2007, Fundamental of Pap Test Cytology,Humana Press, Totowa, New Jersey.
[8] Gonzalez, R.C., Woods, Richard E. 2002. Digital Image Processing. Pearson Education, Inc: New Jersey.
[9] Solomon, C., Breckon, T. 2011. Fundamental of Digital Image Processing: A Practical Ap-proach with Examples in Matlab. John Willey & Sons, Ltd: United Kingdom.
[10] Ahmad, Usman. 2005. Pengolahan Citra Digital & Teknik Pemrogramannya. Penerbit Graha Ilmu: Yogyakarta.
[11]Putra, Darma. 2009. Pengolahan Citra Digital. Penerbit Andi: Yogyakarta.
6
Authors
Erlinda Metta Dewi is with the Faculty of Science and Technology at Airlangga
University.
Retna Apsari is a professor in the Faculty of Sciences and Technology. She has
conducted studies in the field of bio-optics and laser application.