Power Load Forecasting Based on Wireless Sensor
Networks
https://doi.org/10.3991/ijoe.v13i03.6861
Xingping Liu*
Hunan Institute of Engineering, Xiangtan, China [email protected]
Weidong Li
Powerchina Zhongnan Engineering Co Ltd., Changsha, China [email protected]
Abstract—At present, wireless sensor networks (WSN) technology is a field of much research interest in the area of information technology. The appli-cation of wireless sensor networks is expected to be very broad. With the de-velopment of communication protocol and their corresponding components, wireless sensor networks technology plays an increasingly important role in the power industry. The analysis and forecast of electric power data is essential to the construction and operation of the power network. Through the wireless sen-sor networks, we can obtain comprehensive power data. Then we can better forecast the power load through the data we obtain from the wireless sensor networks. In this paper, we propose an improved LSSVM method. We collect the power data by the wireless sensor networks and use the improved LSSVM method to forecast the power load. Experimental results demonstrate the effec-tiveness of the proposed method.
Keywords— LSSVM; WSN; power data
1
Introduction
With the advent of wireless sensor networks, networking and intelligent infor-mation gathering technology replace the independent single model. Wireless sensor networks have become an important research focus in the IT field [1-2].
Power energy is the primary energy supply form in modern society. Power systems has become a lifeline for the whole society [3-4]. With the development of the nation-al economy, the demand for electricity in both urban and rurnation-al areas is increasing in China contiguously. By the end of the year 2016, Chinese annual electricity genera-tion was 5 trillion and 920 billion kw/h, ranking first in power output globally.
Any fault in the power network may cause a chain reaction and may result in col-lapse. This will have disasterous results to the national economy and national security [6]. Therefore, the modern power network must use advanced monitoring, control and scheduling mechanism to maintain its stability and optimal operation. The expansion of the power network to accomidate the increasing demand will lead to the continuous improvement in the automation level of power network management and automatic level of operation [7-8].
In the power system automation field, the existing research applies the wireless sensor networks to remote meter reading [9], substation automation [10], transmission line real-time monitoring [11] and early warning [12], etc. At the same time, the data collected by the wireless sensor networks can also be used to forecast the power load and provide a powerful guarantee for the electrical needs of both daily life of the society and industry.
The least squares support vector machine replaces the inequality constraints of standard support vector machines with equality constraints [13]. The two program-ming problem is transformed into the problem of solving linear equations by quadrat-ic optimization index [14]. The computational complexity is reduced, the speed of the solution is improved and the ability of anti-jamming is enhanced. This is an extension of the standard SVM [15].
In this paper, we combine the wireless sensor networks with the power load fore-casting, and propose an improved LSSVM method. Firstly, we use the wireless sensor networks to collect the input data of power load forecasting. Then, we use the modi-fied LSSVM method to forecast the demand on the power load. The first part of this paper introduces the research background. In the second part, we introduce the com-bination of wireless sensor networks and power system. In the third part, we propose an improved LSSVM method. In the experimental stage, we use the improved LSSVM method to forecast the demand on the power load. Finally, the experimental results demonstrate the accuracy of the improved LSSVM method for power load forecasting based on wireless sensor networks.
2
Power data acquisition based on wireless sensor networks
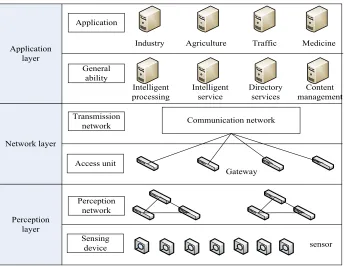
The internet of things architecture is divided into three levels of perception, net-work and application [16]. The perception layer is the bottom layer of the internet of things. Its main function is to collect data through various types of sensors data, such as RFID (radio frequency) data, video capture equipment data, etc [17]. The network layer is the second layer, which is built on the basis of communication technology and the internet.
Application layer
Network layer
Perception layer
Application
General ability
Transmission network
Access unit
Perception network
Sensing device
Industry Agriculture Traffic Medicine
Intelligent
processing Intelligent service Directory services managementContent
Communication network
sensor Gateway
Fig. 1. Three layer architecture of Internet of things.
The design of the wireless sensor networks node unit is the key to data acquisition and transmission. The node unit is the smallest unit in the network, but also an essen-tial link. The wireless sensor networks node unit often has the following characteris-tics.
1.Data processing and storage. Wireless sensor network nodes collect data through different front-end sensors. The different types of sensors collect different data. So, it is required that the processing module of the sensor node can be able to process and store the different signals.
2.High reliability. The transfer of the power load forecasting input data must be ex-act. Otherwise it will affect the predicted results.
3.Low energy consumption. We must consider the problem of the service life of the node. We also consider how to improve the use time of the node and how these nodes can have a long and stable operation.
4.Low cost. The engineering must consider the overall cost.
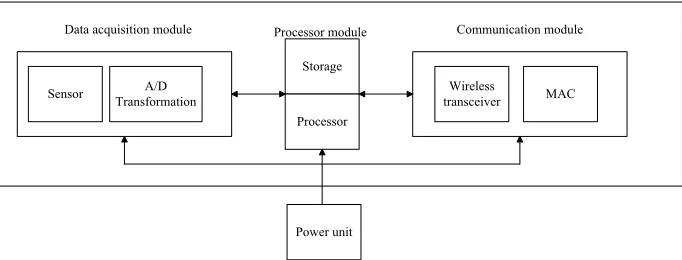
The main function of the wireless sensor network nodes is energy supply and data transmission. The wireless sensor network node is constituted of energy supply, sen-sors, processen-sors, wireless communications and other components.
Sensor TransformationA/D Data acquisition module
Storage
Processor Processor module
Wireless
transceiver MAC Communication module
Power unit
Fig. 2. Wireless sensor network node structure
3
PSO Algorithm.
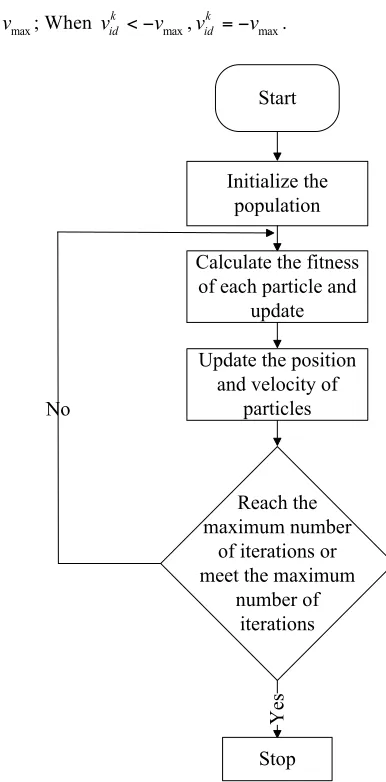
Particle Swarm Optimization (PSO) is proposed by American scholars Kennedy and Eberhart in 1951[21]. This is a global search optimization algorithm. Based on swarm intelligence theory, the PSO algorithm uses the simple particle position and velocity operation to optimize the search by swarm intelligence [22].
In the PSO algorithm, a particle in the population is a solution to the optimization problem. The algorithm initializes the particle. In the search space, we initializem par-ticles and get a new population as follows:
1 2
( , , , )
mX
=
x x
!
x
(1)The position of particles is:
1 2
( , , , )
Ti i i iN
x
=
x x
!
x
(2)This is a solution of the optimization problem. The fitness value of each particle is determined by the objective function. Each particle will then iterate through the solu-tion space. This posisolu-tion is changed by updating the particle velocity as follows:
1 2
( , , , )
T i i i iNv
=
v v
!
v
(3)1
1 1
2 2
( )
( )
k k k k
id id id id
k k
gd id
v wv c r p x
c r p x
+ = + !
+ ! (4)
1 1
k k k
id id id
x
+=
x
+
v
+(5)
vk
idis the velocity of i-th particle in the (k+1)-th iteration at the d dimension. xk+1 id is
the position of i th! particle in the (k+1)-th iteration at the d dimension.. c1 and c2 are the acceleration constant. w is the weight. r1 and r2 are the independent functions. The range is
( )
0,1
.When
max
k id
v
>
v
, k max idv
=
v
; When k max idv
< !
v
, k max idv
=
!
v
.Start
Initialize the population
Calculate the fitness of each particle and
update
Update the position and velocity of
particles
Reach the maximum number
of iterations or meet the maximum
number of iterations No
Yes
Stop
4
improved LSSVM method
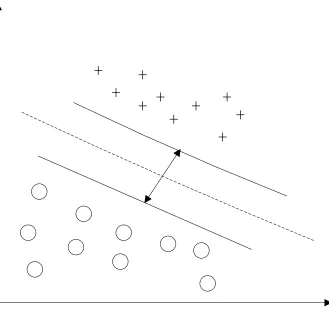
SVM theory is based on structural risk minimization and VC dimension. This is the most frequently used and the most successful algorithm in machine learning. SVM has a unique way to deal with the related problems of small samples, nonlinear and high dimension space. In recent years, SVM has been used in classification and re-gression computation. This method is becoming increasingly popular over others. The principle of two-dimensional space linear separation of SVM is shown in Fig. 4.
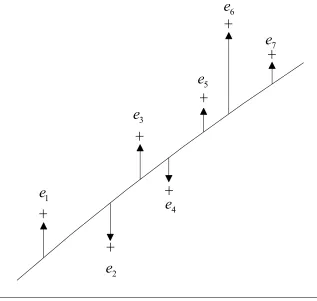
LSSVM and SVM have a same structure. They have the input layer and the output layer. But the working principle of LSSVM is different from SVM. LSSVM is based on the idea of equality of constraints, and SVM is based on inequality of constraints. LSSVM transforms the original problem from the two programming problem into a set of linear equations for linear KKT systems. The error processing principle of LSSVM is shown in Fig. 5.
1
e
2
e
3
e
4
e
5
e
6
e
7
e
Fig. 5. Error processing principle of LSSVM
As the improvement of the standard SVM model, the Lagrange multiplier and the error are proportional to the model that will lead to the noise sensitivity and robust-ness, although LS-SVM has inherited the advantages of SVM. In order to enhance the ability of the model to deal with the noise data, the improved LSSVM algorithm is proposed. The principle structure diagram of the LSSVM is as follows.
In the LSSVM algorithm, we set:
* * *
2
* * * *2
, , 1
1 1
min ( , )
2 2
N k k
b e J e k e
! ! = ! + "
$
=# (6)subject to:
*T ( ) * *, 1,2, ,
k k k
y =
! "
x +b e k+ = ! N (7)The lagrange function is:
* * * * * * * * * * 1 ( , , , ) ( , ) { ( ) } N T
k k k k
i
L b e J w e
x b e y
! "
" ! # =
=
$
%
+ + $(8)
The derivation is:
* * * 1 * * 1 * * * * * * *
0, ( )
0
0, 0
( ) 0
N k k i N k i
k k k
k
T
k k k
k L x L b L e e
L x b e y
! " #
!
"
" $ %
! & " = = ' ( = = )' ) ) ' = = )' ) * ' ) = + = )' ) ' ) = + + + = )' ,
(9)Delete the !*ande*
*
*
0 1 0
1 1 T v b y l
V
"
!
# $
# $ # $
% & =
% & % &
% '+ &( ) ( )
% &
( ) (10)
where:
1 2
( , , , )
NV dig
=
! !
!
!
(11)1 2
( , , , )T N
y= y y ! y (12)
* ( , , ,* * *)T
N N N
!
=! !
!!
(13)1 [1,1, ,1]= ! T
( , ), , 1,2, ,
ij K x x i ji j N
! = = ! (15)
The kernel function is used to support the vector machine, which can enhance the ability to deal with nonlinear and high dimensional space. The choice of the kernel function will affect the performance of support vector machine. If the support vector machine has a well performaning kernel function, it will have excellent generalization ability. Commonly used kernel functions include the Gauss radial basis function, polynomial kernel function and Sigmiod kernel function.
(1) Gauss radial basis function:
2 2
( , ) exp(k k 2 )
K x x = " "x x ! (16)
(2) Polynomial kernel function:
( , ) [( , ) 1]q
k k
K x x = x x + (17)
where qis the order of a polynomial. (3) Sigmiod kernel function:
( , ) tanh( (
k k) )
K x x
=
v x x
!
+
c
(18)0, 0
v> c<
In this paper, the Gauss radial basis function (RBF)
2 2
( , ) exp(k k 2 )
K x x = " "x x ! with global convergence is used as the kernel
func-tion. ! is core width. The RBF kernel function reduces the influence of the abnormal data on the overall performance of LS-SVM and improves the robustness of the mod-el.
!k=
1,if ek s!<!
!
ek s!,if ek s ! !! "
# $ $
% $ $
(19)
Weight parameter
!
must be determined. s!is used to measure the degree of devia-tion between the distribudevia-tion of unweighted error variable ek and Gaussian distribu-tion. sˆ is determined by the following:ˆ 1.483
(
k{ })
ks
=
med e med e
!
(20)* *
1
( , )
N
k k
k
y ! K x x b =
=
"
+(21)
In order to enhance the robustness of the LSSVM model, we add weight ek to ad-just the number of iterations.
Then, we improve the PSO part.
The particle swarm optimization with extended memory records the pre-global ex-treme position.
The individual extreme position and pre self-position through extended memory. The significance of extended memory is that the search experience which is accumu-lated by the individual particles can help the algorithm to more quickly converge. Compared with traditional PSO algorithms, the improved PSO algorithm has the advantages of fast convergence speed and simple implementation. This method main-tains the advantages of the swarm intelligence, parallelism, and fewer adjustment parameters of the PSO algorithm. The speed and the position update types are:
1 ( 1) 1
1 1 1
1 1
2 2 1
[ ( ) ( )]
[ ( ) ( )]
k k k k k k
id id l id id l id id
k k k k
l gd id l gd id
v wv c r p x p x
c r p x p x
!
!
!
!
+ " "
"
" " "
= + " + "
+ " + " (22)
1 1
k k k
id id id
x
+x
v
+=
+
(23)where 1 1 1 1
1
, l , i 1
i
R
! !
+!
" " =
#
$
= , !1 is current effective factor,!
l"1 is extendedmemory effective factor.
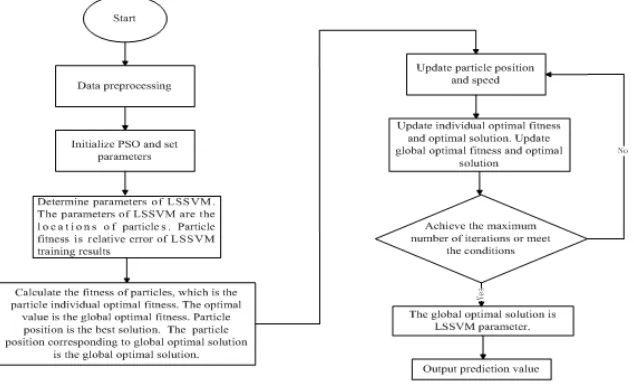
The flow chart of the algorithm is as follows:
The steps are as follows.
(1) Calculate the Lagrangian multipliers !k of LSSVM. We can obtain the un-weighted LSSVM error variable
e
k=
! "
k,
k
=
1,2, ,
!
N
.(2) Calculate weight coefficient!k (3) Obtain ( )V
!
"1I, where1 2
( , , , )
NV
=
! !
!
!
. Update the !k. (4) Solve partial derivative e* to obtain *( )i , 1k k
e =e i= . We set i i= +1 and return to step (2).
(5) When i M= or !*( 1)ki+ "!*ki #10"4, the algorithm ends. (6) Take the updated *
k
! andb* into type (1) to obtain the forecasting value.
Firstly we use the LSSVM model to fit the training data. Then, we use the PSO al-gorithm to search the parameters of the model in the fitting process to determine the parameters of the LSSVM model. Lastly, we use the improved LSSVM model to determine the forecasting value after the parameters of the LSSVM model have been determined.
5
Experiment
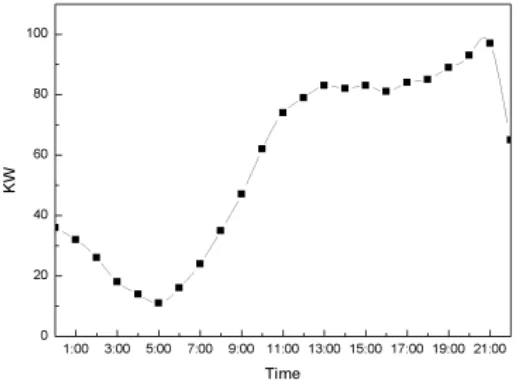
In the power industry, the use of wireless sensors to collect data has become the standard. Firstly, we use the wireless sensor to collect the power load data in a certain area. The specific data is shown in the following table.
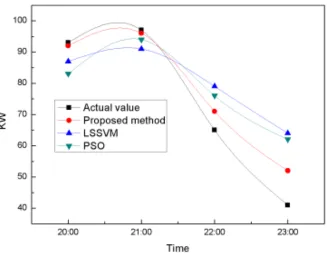
After that, we compare the proposed method with the traditional LSSVM method and the PSO method. We selected the first 20 data points as the training set, and the last four data points as the prediction value. The prediction results are as shown in Figure 9.
Fig. 9. Comparison result
From the above, we can see that the improved method proposed in this paper has a good prediction result in power load forecasting based on wireless sensor networks. Compared with the traditional LSSVM and PSO methods, this method has higher prediction accuracy. The experimental results show that the method is feasible and effective.
6
Conclusion
7
References
[1]Ravichandran, S., Chandrasekar, R. K., Uluagac, A. S., & Beyah, R. (2016). A simple vis-ualization and programming framework for wireless sensor networks: proviz. Ad Hoc Networks,53, 1-16. https://doi.org/10.1016/j.adhoc.2016.06.015
[2]Ye, R., Boukerche, A., Wang, H., Zhou, X., & Yan, B. (2016). Recodan: an efficient re-dundancy coding-based data transmission scheme for wireless sensor networks. Computer Networks,110, 351-363. https://doi.org/10.1016/j.comnet.2016.10.010
[3]Simonsen, E., & Osvalder, A. L. (2015). Aspects of the Nuclear Power Plant Control Room System Contributing to Safe Operation. International Conference on Applied Hu-man Factors and Ergonomics. 3, 1248-1255). https://doi.org/10.1016/j.promfg. 2015.07.260
[4]Memmott, M. J., Wilding, P. R., & Petrovic, B. (2016). An optimized power conversion system concept of the integral, inherently-safe light water reactor. Annals of Nuclear En-ergy. 100, 42-52. https://doi.org/10.1016/j.anucene.2016.08.015
[5]Chen, C., Long, H., & Zeng, X. . Planning a sustainable urban electric power system with considering effects of new energy resources and clean production levels under uncertainty: a case study of tianjin, china. Journal of Cleaner Production.
[6]Xiang, C., Ding, F., Wang, W., & He, W. (2017). Energy management of a dual-mode power-split hybrid electric vehicle based on velocity prediction and nonlinear model pre-dictive control. Applied Energy, 189, 640-653. https://doi.org/10.1016/j.apenergy. 2016.12.056
[7]Lei, Z., Qin, D., Liu, Y., Peng, Z., & Lu, L. (2017). Dynamic energy management for a novel hybrid electric system based on driving pattern recognition. Applied Mathematical Modelling, 940–954. https://doi.org/10.1016/j.apm.2017.01.036
[8]Di Iorio, S., Magno, A., Mancaruso, E., Vaglieco, B.M. (2016). Diesel/methane dual fuel strategy to improve environmental performance of energy power systems. International Journal of Heat and Technology, 34(S2), S581-S588. https://doi.org/10.18280/ijht.34S254 [9]Yaacoub, E., & Abu-Dayya, A. (2014). Automatic meter reading in the smart grid using
contention based random access over the free cellular spectrum. Computer Networks, 59(3), 171-183. https://doi.org/10.1016/j.bjp.2013.10.009
[10]Massana, J., Pous, C., Burgas, L., Melendez, J., & Colomer, J. (2015). Short-term load forecasting in a non-residential building contrasting models and attributes. Energy & Buildings,92, 322-330. https://doi.org/10.1016/j.enbuild.2015.02.007
[11]Depari, A., Ferrari, P., Flammini, A., Rinaldi, S., Rizzi, M., & Sisinni, E. (2014). Devel-opment and evaluation of a wsn for real-time structural health monitoring and testing. Pro-cedia Engineering,87, 680-683. https://doi.org/10.1016/j.proeng.2014.11.622
[12]Wang, P., Hou, H., He, X., Wang, C., Xu, T., & Li, Y. (2015). Survey on application of wireless sensor network in smart grid. Procedia Computer Science, 52, 1212-1217. https://doi.org/10.1016/j.procs.2015.05.161
[13]Song, X., Jian, L., Song, Y. (2017). A chunk updating LS-SVMs based on block Gaussian elimination method. Applied Soft Computing, 51, 96-104. https://doi.org/10.1016/ j.asoc.2016.12.004
[14]Barati-Harooni, A., Najafi-Marghmaleki, A., Arabloo, M., & Mohammadi, A. H. (2016). An accurate csa-lssvm model for estimation of densities of ionic liquids. Journal of Mo-lecular Liquids,224(A), 954-964. https://doi.org/10.1016/j.molliq.2016.10.027
[16]Ganzha, M., Paprzycki, M., Paw!owski, W., Szmeja, P., & Wasielewska, K. (2016). Se-mantic interoperability in the internet of things; an overview from the inter-iot perspective.
Journal of Network & Computer Applications. 81, 111-124. https://doi.org/10.1016/ j.jnca.2016.08.007
[17]Atzori, L., Iera, A., & Morabito, G. (2017). Understanding the internet of things: defini-tion, potentials, and societal role of a fast evolving paradigm. Ad Hoc Networks,56, 122-140. https://doi.org/10.1016/j.adhoc.2016.12.004
[18]Bello, O., Zeadally, S., & Badra, M. (2016). Network layer inter-operation of device-to-device communication technologies in internet of things (iot). Ad Hoc Networks. 57, 52-62. https://doi.org/10.1016/j.adhoc.2016.06.010
[19]Alam, F., Mehmood, R., Katib, I., & Albeshri, A. (2016). Analysis of eight data mining al-gorithms for smarter internet of things (iot). Procedia Computer Science, 98, 437-442. https://doi.org/10.1016/j.procs.2016.09.068
[20]Luo, S., & Ren, B. (2016). The monitoring and managing application of cloud computing based on internet of things. Comput Methods Programs Biomed, 130, 154-161. https://doi.org/10.1016/j.cmpb.2016.03.024
[21]Liu, Q., Niu, H., Xu, W., & Zhang, D. (2014). A service-oriented spectrum allocation al-gorithm using enhanced pso for cognitive wireless networks. Computer Networks,74, 81-91. https://doi.org/10.1016/j.comnet.2014.06.021
[22]Mangat, V., & Vig, R. (2014). Novel associative classifier based on dynamic adaptive pso: application to determining candidates for thoracic surgery. Expert Systems with Applica-tions,41(18), 8234-8244. https://doi.org/10.1016/j.eswa.2014.06.046
8
Authors
Xingping Liu is an associate professor with College of Electrical & Information Engineering, Hunan Institute of Engineering, Xiangtan 411101, China. He is mainly engaged in the study of communication control ([email protected]).
Weidong Li is a master of Power china Zhongnan Engineering Co Ltd., Changsha 410014, China. He is mainly engaged in communication technology re-search([email protected]).