Market Responsiveness to Corporate Social Responsibility
Zev Fried1 1
Silberman College of Business, Fairleigh Dickinson University, USA
Correspondence: Zev Fried, PhD, Fairleigh Dickinson University, USA. E-mail: zfried@fdu.edu
Received: August 26, 2019 Accepted: October 11, 2019 Online Published: October 12, 2019
doi:10.5430/afr.v8n4p114 URL: https://doi.org/10.5430/afr.v8n4p114
Abstract
Market reaction to surprises in earnings announcements has long been used to measure the quality of the information content of the announcement, and studies have explored various factors affecting the response. This study adds to this body of research by factoring in the level of corporate social responsibility (CSR) exhibited by the firm and employs a relatively new measure of a company’s level of CSR, rankings published by JUST Capital. This study hypothesizes that financial information reported by higher ranked companies is weighed more heavily by investors than those reported by non-ranked or lower-ranked companies. Using earnings response coefficients as a measure of the perceived quality of the financial information reported by the firms, this study measures the effect of being ranked by JUST Capital as well as the ranking of the firms on the marked response. The results provide direct support of the hypotheses, indicating that the market reacts more strongly to earnings surprises for firms with high JUST rankings than for unranked firms as well as reacting stronger for higher ranked firms relative to lower ranked firms. We conclude from this study that investors do take into account the level of a corporation’s social responsibility when evaluating earnings announcements. This result contributes new insights into the impact of a firm’s CSR in terms of the perceived quality of a firm’s financial reporting.
Keywords: corporate social responsibility, market reaction, earnings quality, earnings response coefficient, JUST capital ranking
1. Introduction
Previous literature has identified a positive relation between a corporation’s social responsibility (CSR) performance and its financial performance (Orlitzky et al., 2003: Friede et al., 2015). However, many of these studies suffer from issues related to the definition and measurability of attributes such as social and environmental responsibility (Pava and Krausz, 1996) as well as from a variety of self-selection and identification issues (Aupperle et al., 1985; McWilliams and Siegel, 2000).
Recently, a non-for profit organization known as JUST Capital began issuing an annual ranking of firms in the Russel 1000 based on environmental, social and governance (ESG) metrics.1 These rankings have gained traction in the investment community. An index tracking the top 50% of the Russel 1000 weighted by JUST rankings (known as the JUST 500 or JULCD) began trading in November 2016, and in June 2018, Goldman Sachs Asset Management launched an Exchange Traded Fund (ETF) based on this index.
In this paper, we examine whether there is a relation between the rankings published by JUST Capital and the perceived quality of financial reporting for these firms. Using earnings response coefficients (ERCs) to measure the perceived quality of information contained in the earnings report, this study tests to see if firms which are ranked by JUST have larger ERCs than unranked firms. ERCs have long been used to measure the relationship between equity returns and the information contained in a firm’s financial reporting. If investors view the level of a firm’s commitment and actions in regard to social issues as an indication (or signal) of the trustworthiness of said firms, they would expect that the information contained in announcements from these firms to be of a higher quality and more informative than information contained in reports of firms who are not as invested in these societal issues. Thus, we would expect to find larger ERCs in firms that are ranked by JUST when compared to non-ranked firms. Furthermore, within the population of JUST-ranked firms, we would expect to find larger ERCs for higher ranked firms when compared to lower ranked firms.
literature in that ERCs can be employed as measure of investors responsiveness both for positive and negative market returns, thus providing insight into the perceived financial reporting quality of these firms. Second, the use of the JUST rankings provides a unique framework within which this relation can be tested. In the past, many of the ESG measures were self-reported by firms. This leaves a gap to fill in the literature as there is no indication if the general public perceived that these firms are socially responsible. In contrast. the JUST rankings are compiled through the polling of everyday Americans to assess which social issues are of importance to them. Thus, the population of those who shaped these rankings is roughly the same as the population of those who invest, providing the opportunity to close this gap in the literature by examining whether people’s ideas of socially responsible firms actually translate into greater equity market participation. In short, this paper aims to explore the following research question – do investors value responsiveness to social issues by firms, insofar that it increases their confidence in the quality of earnings announcements of highly social conscious firms.
The remainder of the paper is organized as follows. Section 2 is devoted to a review and discussion of the JUST rankings and the background literature on corporate social responsibility and earnings response coefficients. Section 3 presents the hypotheses development, followed by the research design in section 4. Section 5 provides information on sample selection and summary statistics. Results and discussion and are presented in section 6. Finally, a summary and conclusion are provided in section 7.
2. Background and Literature Review
2.1 JUST Capital Rankings
JUST Capital was founded in 2013. According to their website, its mission is “to build a more just marketplace that
better reflects the true priorities of the American people”. According to their most recent Form 990 filing, its “definitive polling, rankings, indexes and data empower all market participants - workers, investors, business leaders, consumers, advocacy groups - with the information they need to support, purchase from, invest in, and work for companies that perform best on the issues they care about.” To that end, JUST companies are likely to have better pay, create jobs at a higher rate, give more charity and do more to reduce greenhouse gas emissions than non-JUST ranked firms.
JUST Capital ranks firms on a model weighted along seven broad issues including workers (25%), customers (18%), products (14%), environment (13%), jobs (12%), communities (11%) and leadership & shareholders (8%).2 Each of these issues are then broken down further into components. In total, there are 36 components. In order to produce their ranking, JUST collects and evaluates data regarding each of these components for each company. An aggregate score is assigned to each company based on the data collected and weights assigned to each issue and component. In total, JUST ranks 890 firms of the Russel 1000, with the first 801 ranked ordinaly from 1-801 and the last 89 grouped together as the “bottom 10%”.
2.2 Corporate Social Responsibility and Financial Performance
The relation between a firm’s social responsibly actions and its financial performance has been the subject of much debate in both the marketing and accounting literature. Dating all the way back to Friedman (1970), the original literature stated that imposing social expenses on corporations was damaging to the ultimate business goal of increasing profits.3 Early studies argued that companies that incur costs for socially responsible actions were put at a disadvantage relative to firms that did not incur such costs. Arlow and Gannon, writing in 1982, concluded by saying:
“social responsiveness is subordinate to other corporate goals that are primarily economic in nature”. They continued to assert that “Although business firms seem committed to socially responsible actions, the research studies do not provide strong support for a positive relationship between social responsiveness and economic performance.” However, others countered with the claim that these costs were minimal and firms actually benefited from the socially responsible actions. Auppele et al. (1985) showed that the results varied depending on the measure of corporate responsiveness. Similarly, later studies such as Jones and Wicks (1999) and McWilliams and Siegel, (2001) concluded that it was in the best interest of firms, even from a profit motive perspective to be socially conscious and responsible.
Empirically speaking, McGuire et al. (1988) and Stanwick and Stanwick (1998), among others, show that a firms’ financial performance is closely related to perceptions of a firm’s social responsibility. Pava and Krausz (1996) show that firms which have been perceived as having met social-responsibility criteria have generally been shown to have financial performance at least on par with, if not better than, other firms. Sasyetki (2015) show that strategic CSR which is disclosed in financial statements have a positive effect on financial performance. In a recent experimental study, Shen et al. (2016) evaluated the influence of CSR disclosure assurance on the investment decisions of nonprofessional investors in China and found that CSR reports that have been assured by an external third party increases the willingness of nonprofessional investors to invest in the firm.
There are a number of later metadata analyses that overwhelmingly conclude that it is beneficial from a profit standpoint for firms to be socially responsible. Margolis and Walsh (2001) look at 60 different studies and found that 53% of these studies documented a positive relationship, 24% found non-significant effect, 19% produced mixed results and only 5% showed a negative effect. Using 52 studies on this topic, Orlitzky et al. (2003) show that it is generally the case that corporate social performance is positively related to corporate financial performance. Even more recently, Friede et al. (2015) combined findings of over 60 review studies on the topic which amounted to more than 2,200 individual studies and concluded that roughly 90% of the studies find a nonnegative relation between ESG and corporate financial reporting with the large majority of studies finding a positive relation.
2.3 Earnings Response Coefficients
Earnings Response Coefficients measure the sensitivity of market returns to earnings surprises. The study of ERCs dates back to seminal works of Ball and Brown (1968) and Beaver (1968). Brown (1993) and O’Brien (1988) show that the most efficient method to verify if expected earnings reflect market expectations is by looking at ERCs.
There is a rich literature indicating how ERCs are related to investors’ previous expectations of a firms upcoming earnings report. Imhoff and Lobo (1992) show that ERCs will vary with the amount of ex-ante uncertainty regarding the firm’s future prospects. Eason and Zmijewski (1989) report that ERCs are positively associated with revision coefficients (coefficients relating current earnings to future earnings) and negatively associated with expected rates of return. ERCs have also been showed to be influenced by the differential quality of preannouncement information (Verrecchia, 1980), firms size (Atiase, 1985; Freeman, 1987), the effect of earnings predictability (Lipe, 1990), the firm’s auditors (Balsam et al., 2003; Teoh and Wong, 1993) and even which exchange the firm’s stock trades on (Grant, 1980; Aitase, 1987). Further, the literature has shown that when there is a lack of credibility in regards to a firm’s earnings announcements such as in the presence of a qualified earnings report (Choi and Jeter, 1992) or a restatement (Anderson and Yohn, 2002) there is a negative effect on ERCs.
3. Hypotheses Development
If corporate social responsibility is indeed an indication for the trustworthiness of a firm, we would expect that to translate into the perceived quality of financial reporting as well. Equity market participants who receive earnings reports should be more likely to value the information and quality of the earnings reports from firms that are more trustworthy.
The JUST rankings were obtained by surveying the American public on a regular basis to understand what issues represent just corporate behavior, how these issues should be defined, and the relative importance of each (JUST, 2018). JUST then collected and analyzed data on these issues for all the firms in the Russell 1000. Using this data and the relative weights for all of these issues, rankings were developed for each of these firms.
Since the social issues and their weights are objectively determined by surveying the public, the JUST rankings should be a clear indicator of what the public cares about. By extension, companies which score higher in these metrics should be more respected and trusted by the public. This in turn should lead to a better response to an earnings announcement by firms that are JUST-ranked. Thus, we should expect firms that are ranked by JUST to have than more positive response to their earnings report than do non-ranked firms.
This leads to the first hypothesis (stated in the alternative form):
H1: JUST ranked firms have larger earning response coefficients than non-JUST ranked firms.
being the case, we would expect that the ERCs for higher ranked firms be higher than those for lower ranked firms. This leads to the second hypothesis (stated in the alternative form):
H2: Firms that are ranked higher by JUST have relatively larger earning response coefficients than lower ranked firms
Additionally, it would be interesting to see to what extent these rankings matter. In other words, is there difference between being ranked in the top 10% vs the top 50% or the top 90%.
4. Research Design
To test H1, that JUST- ranked companies enjoy higher ERCs than do non JUST-ranked firms, we estimate the following regression for each firm, by quarter:
𝐶𝐴𝑅_3𝑗,𝑡= 𝛼 + 𝛽1𝑈𝐸𝑗,𝑡+ 𝛽2 𝐽𝑈𝑆𝑇𝑗,𝑡+ 𝛽3 𝐽𝑈𝑆𝑇𝑗,𝑡∗ 𝑈𝐸𝑗,𝑡+ 𝛽4𝑆𝐼𝑍𝐸𝑗,𝑡+ 𝛽5𝑀𝑇𝐵𝑗,𝑡+ 𝛽6 𝐿𝐸𝑉𝑗,𝑡+ 𝛽7 𝐿𝑂𝑆𝑆𝑗,𝑡+
𝛽8𝑄4𝑗,𝑡+ 𝜀 (1)
where CAR_3j,t , is the cumulative abnormal return measured over a three-day period surrounding the earnings
announcement date for firm j in quarter t. Following previous literature (Wilson, 2008; Collins & Kothari, 1989), we use a three-day time horizon to measure the market response to earnings surprise.4
The first independent variable, UE, is a measure of the firm’s quarterly earnings surprise or unexpected earnings.
This is measured as the difference between the actual quarterly earnings and the consensus analyst earnings forecast scaled by price. Following previous literature (Chi & Shanthikumar, 2017; Wilson, 2008; Livnat & Mendenhall, 2006), the consensus analyst earnings forecast is defined as the median of analysts’ most recent forecasts over 60 trading days before the announcement date. Consistent with prior literature, since the market reacts to this surprise, we would expect β1 to be positive.
JUST is a dummy variable which takes the value of 1 if the firm is a JUST – ranked firm and zero otherwise. Thus, the variable of interest is 𝐽𝑈𝑆𝑇𝑗,𝑡∗ 𝑈𝐸𝑗,𝑡, an interaction variable between this indicator variable and the earnings
surprise. The coefficient on this interaction variable will show the incremental response to earnings announcements for JUST-ranked firms. If the market views the information content of earnings for JUST-ranked firms more favorably that for non-JUST ranked firms, the coefficient, β3, should be positive.
We also include a number of control variables in the model to control for firm-specific factors that may impact the market return. We include controls for the firm’s size (SIZE), market to book ratio, (MTB), and leverage (LEV). SIZE
is defined as the log of the firm’s market value of equity. This study does not make a prediction for the direction of the coefficient on SIZE as there is mixed evidence in regards to the relation of a firm’s size with the market reaction. Some, such as Chaney and Jeter (1992) find that size is positively related to the market reaction. Others, including Atiase (1985) show that size is negatively related to earnings announcements as these announcements tend to be relatively more informative for smaller firms. As for the other control variables, Collins and Kothari (1989) show that a firm’s growth is positively related to the market reaction to a firm’s earnings while their financial risk is negatively associated with the market’s reaction, while Martikainen (1997) and Dhaliwal et al. (1991) argue that this is not always the case. Thus, we include these variables in the regression model but make no prediction in regards to the sign on either of these variables.
Finally, we include two indicator variable in the regression equation which have been shown to affect market reaction to earnings announcements. The first, LOSS, takes the value of 1 if the firm reported a net loss for that quarter, and zero otherwise. The information content of earnings for loss quarters has been shown to be lower than for positive-earnings quarters (Hayn, 1995). Thus, we expect β7, the coefficient on LOSS to be negatively related to the market reaction. The second indicator variable, Q4 is set to 1 if the quarter being measure is the fourth quarter of the fiscal year and zero otherwise. Salamon and Stober (1994), show that fourth quarter earnings announcements contain less information content, while Lee et al. (2016) show the opposite to be true. Thus, we do not make a prediction in regards to the sign of the coefficient on Q4.
Since there is a debate in the literature regarding the best time horizon to measure market reactions to earnings announcements, we also re-estimate the regression using a five-day time window (see for example Ma et al., 2009 and Ramiah, 2010) by estimating:
𝐶𝐴𝑅_5𝑗,𝑡= 𝛼 + 𝛽1𝑈𝐸𝑗,𝑡+ 𝛽2 𝐽𝑈𝑆𝑇𝑗,𝑡+ 𝛽3 𝐽𝑈𝑆𝑇𝑗,𝑡∗ 𝑈𝐸𝑗,𝑡+ 𝛽4𝑆𝐼𝑍𝐸𝑗,𝑡+ 𝛽5𝑀𝑇𝐵𝑗,𝑡+ 𝛽6 𝐿𝐸𝑉𝑗,𝑡+ 𝛽7 𝐿𝑂𝑆𝑆𝑗,𝑡+
where the dependent variable 𝐶𝐴𝑅_5𝑗,𝑡 ,is the cumulative abnormal return measured over a five-day period
surrounding the earnings announcement date for firm j in quarter t.
To test H2, that firms that are higher ranked by JUST- capital have larger ERCs than do lower ranked firms, we first begin by dividing the sample in half and estimate the following regression:
𝐶𝐴𝑅_3𝑗,𝑡= 𝛼 + 𝛽1𝑈𝐸𝑗,𝑡+ 𝛽2 𝐽𝑈𝑆𝑇_𝑇𝑂𝑃_50𝑗,𝑡+ 𝛽3 𝐽𝑈𝑆𝑇_𝑇𝑂𝑃_50𝑗,𝑡∗ 𝑈𝐸𝑗,𝑡+ 𝛽4𝑆𝐼𝑍𝐸𝑗,𝑡+ 𝛽5𝑀𝑇𝐵𝑗,𝑡+
𝛽6 𝐿𝐸𝑉𝑗,𝑡+ 𝛽7 𝐿𝑂𝑆𝑆𝑗,𝑡+ 𝛽8𝑄4𝑗,𝑡+ 𝜀 , (3)
where 𝐽𝑈𝑆𝑇_𝑇𝑂𝑃_50𝑗,𝑡 is an indicator variable which takes on the value of one for firms that are ranked in the top
50% of the JUST- rankings and zero otherwise. We expect the coefficient on 𝐽𝑈𝑆𝑇_𝑇𝑂𝑃_50 to be positive and significant. As before, we re-estimate the regression using 𝐶𝐴𝑅_5𝑗,𝑡 in place of 𝐶𝐴𝑅_3𝑗,𝑡.
To further pinpoint the effect of being higher ranked, we then take only the top 10% of JUST-ranked firms, and estimate the following regression:
𝐶𝐴𝑅_3𝑗,𝑡= 𝛼 + 𝛽1𝑈𝐸𝑗,𝑡+ 𝛽2 𝐽𝑈𝑆𝑇_𝑇𝑂𝑃_10𝑗,𝑡+ 𝛽3 𝐽𝑈𝑆𝑇_𝑇𝑂𝑃_10𝑗,𝑡∗ 𝑈𝐸𝑗,𝑡+ 𝛽4𝑆𝐼𝑍𝐸𝑗,𝑡+ 𝛽5𝑀𝑇𝐵𝑗,𝑡+
𝛽6 𝐿𝐸𝑉𝑗,𝑡+ 𝛽7 𝐿𝑂𝑆𝑆𝑗,𝑡+ 𝛽8𝑄4𝑗,𝑡+ 𝜀 (4)
Where 𝐽𝑈𝑆𝑇_𝑇𝑂𝑃_10𝑗,𝑡 is an indicator variable which takes on the value of one for firms that are ranked in the top
10% of the JUST- rankings and zero otherwise. Here too, we expect that the coefficient on this variable will be positive and significant. Again, we re-estimate the regression using 𝐶𝐴𝑅_5𝑗,𝑡 in place of 𝐶𝐴𝑅_3𝑗,𝑡.
Finally, to test how far reaching the effect is and if and at what level of ranking the effect wears off, we divide the sample of JUST-ranked firms into deciles and estimate the following regression:
𝐶𝐴𝑅_3𝑗,𝑡= 𝛼 + 𝛽1𝑈𝐸𝑗,𝑡+ ∑10𝑁=2 𝛽𝑁 𝐽𝑈𝑆𝑇_𝐷𝐸𝐶𝐼𝐿𝐸_𝑁𝑗,𝑡+ ∑19𝑁=11 𝛽𝑁 𝐽𝑈𝑆𝑇_𝐷𝐸𝐶𝐼𝐿𝐸_𝑁𝑗,𝑡∗ 𝑈𝐸𝑗,𝑡+ 𝛽20𝑆𝐼𝑍𝐸𝑗,𝑡+
𝛽21𝑀𝑇𝐵𝑗,𝑡+ 𝛽22 𝐿𝐸𝑉𝑗,𝑡+ 𝛽23 𝐿𝑂𝑆𝑆𝑗,𝑡+ 𝛽24𝑄4𝑗,𝑡+ 𝜀 (5)
where 𝐽𝑈𝑆𝑇_𝐷𝐸𝐶𝐼𝐿𝐸_𝑁 refers to the firms in each of the 10 deciles. We omit Decile 1 (the top 10%) as this will be the benchmark and will be captured in β1, the coefficient on UE. Here, we expect that the coefficient on each DN*UE
will be greater than the coefficient on DN+1*UE. Additionally, we conduct F-tests to test the difference between the
coefficient on each DN* UE and the coefficient on D1*UE as well as F-tests to test the difference in coefficients of
each DN*UE and the coefficient on the next decile, DN+1*UE. Finally, we re-run these tests using 𝐶𝐴𝑅_5𝑗,𝑡 in place
of 𝐶𝐴𝑅_3𝑗,𝑡.
5. Data Selection and Summary Statistics
5.1 Data Selection
The JUST Capital rankings are publicly available on their website.5 Market return data is obtained from CRSP, analyst forecast data from IBES and financial data from COMPUSTAT. Since the JUST data is for the year 2018, this study examines the previous 10 years (beginning in 2008) as well as 2018. After merging data from all the databases, and removing observations with insufficient data, as well as firms from highly regulated industries such as banking, insurance and utilities, the final sample consists of 101,649 firm quarter observations. Of these, 25,318 quarter observations are from 854 JUST-ranked companies and 75,331 are from non-ranked firms. For the 11 years that the sample covers, the percentage of JUST rank firms range from 20.43% to 28.89% with the mean being 25%.
5.2 Summary Statistics
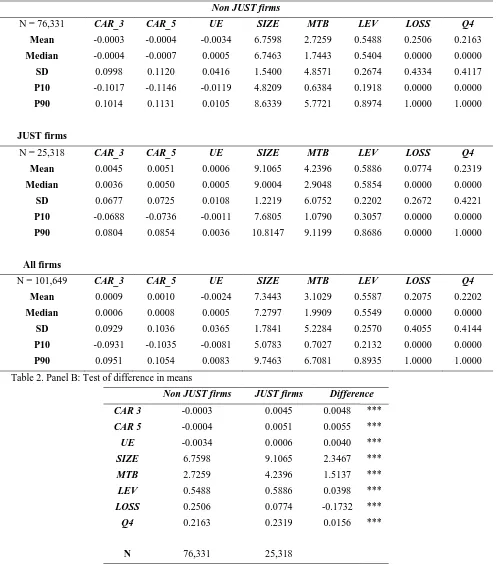
Table 1. Panel A: Descriptive Statistics
Non JUST firms
N = 76,331 CAR_3 CAR_5 UE SIZE MTB LEV LOSS Q4
Mean -0.0003 -0.0004 -0.0034 6.7598 2.7259 0.5488 0.2506 0.2163 Median -0.0004 -0.0007 0.0005 6.7463 1.7443 0.5404 0.0000 0.0000 SD 0.0998 0.1120 0.0416 1.5400 4.8571 0.2674 0.4334 0.4117 P10 -0.1017 -0.1146 -0.0119 4.8209 0.6384 0.1918 0.0000 0.0000 P90 0.1014 0.1131 0.0105 8.6339 5.7721 0.8974 1.0000 1.0000
JUST firms
N = 25,318 CAR_3 CAR_5 UE SIZE MTB LEV LOSS Q4
Mean 0.0045 0.0051 0.0006 9.1065 4.2396 0.5886 0.0774 0.2319 Median 0.0036 0.0050 0.0005 9.0004 2.9048 0.5854 0.0000 0.0000 SD 0.0677 0.0725 0.0108 1.2219 6.0752 0.2202 0.2672 0.4221 P10 -0.0688 -0.0736 -0.0011 7.6805 1.0790 0.3057 0.0000 0.0000 P90 0.0804 0.0854 0.0036 10.8147 9.1199 0.8686 0.0000 1.0000
All firms
N = 101,649 CAR_3 CAR_5 UE SIZE MTB LEV LOSS Q4
Mean 0.0009 0.0010 -0.0024 7.3443 3.1029 0.5587 0.2075 0.2202 Median 0.0006 0.0008 0.0005 7.2797 1.9909 0.5549 0.0000 0.0000 SD 0.0929 0.1036 0.0365 1.7841 5.2284 0.2570 0.4055 0.4144 P10 -0.0931 -0.1035 -0.0081 5.0783 0.7027 0.2132 0.0000 0.0000 P90 0.0951 0.1054 0.0083 9.7463 6.7081 0.8935 1.0000 1.0000 Table 2. Panel B: Test of difference in means
Non JUST firms JUST firms Difference
CAR 3 -0.0003 0.0045 0.0048 ***
CAR 5 -0.0004 0.0051 0.0055 ***
UE -0.0034 0.0006 0.0040 ***
SIZE 6.7598 9.1065 2.3467 ***
MTB 2.7259 4.2396 1.5137 ***
LEV 0.5488 0.5886 0.0398 ***
LOSS 0.2506 0.0774 -0.1732 ***
Q4 0.2163 0.2319 0.0156 ***
N 76,331 25,318
***, **, * indicates significance at the 1%, 5%, 10% level
Table 3. Correlations (coefficients and p-values)
6. Results and Discussion
To test H1, we estimate a regression for the entire sample with an indicator variable JUST as well as an interaction variable between JUST and UE. Results from this regression are presented in Table 3. The coefficient on JUST*UE
when using CAR_3 (column 1) is positive with a very large t-value of 35.89. Similarly, when testing using a five-day window (column 2), we again find a large significant (t=34.32) positive coefficient. This is consistent with H1, namely, that JUST-ranked firms have larger ERCs than do non-JUST ranked firms.
CAR3 CAR5 UE MTB SIZE LEV LOSS
CAR5 0.9012
0.0000
UE 0.1342 0.1275
0.0000 0.0000
SIZE -0.0038 -0.0062 0.1114
0.2243 0.0478 0.0000
MTB -0.0085 -0.0088 0.0208 0.1462
0.0068 0.0052 0.0000 0.0000
LEV 0.0065 0.0075 -0.0554 -0.0291 0.0737
0.0380 0.0162 0.0000 0.0000 0.0000
LOSS -0.0948 -0.0887 -0.2498 0.0245 -0.3722 -0.0380
0.0000 0.0000 0.0000 0.0000 0.0000 0.0000
Q4 0.0130 0.0163 -0.0094 -0.0007 0.0294 0.0085 -0.0156
Table 4. Regression analysis JUST vs. non-JUST
(1) (2)
CAR_3 CAR_5
UE 0.292*** 0.313***
(35.89) (34.32)
JUST 0.003*** 0.005***
(3.60) (4.94)
JUST_UE 6.559*** 6.642***
(27.11) (24.56)
SIZE -0.004*** -0.004***
(-17.18) (-17.66)
MTB -0.000 -0.000
(-0.03) (-0.21)
LEV 0.004***
(3.57) (3.86)
LOSS -0.018*** -0.019***
(-23.27) (-21.96)
Q4 0.003*** 0.005***
(4.86) (5.89)
Intercept 0.027*** 0.030***
(16.47) (16.50)
t statistics in parentheses *p < 0.10, **p < 0.05, ***p < 0.01
Next, to test H2, we divide the JUST-ranked firms in half and estimate a regression with the variable JUST_TOP_50
Table 5. Regression analysis JUST TOP 50
𝐶𝐴𝑅𝑗,𝑡 = 𝛽0+ 𝛽1𝑈𝐸𝑗,𝑡+ 𝛽2 𝐽𝑈𝑆𝑇_𝑇𝑂𝑃_50𝑗,𝑡+ 𝛽3 𝐽𝑈𝑆𝑇_𝑇𝑂𝑃_50𝑗,𝑡∗ 𝑈𝐸𝑗,𝑡+ 𝛽4𝑆𝐼𝑍𝐸𝑗,𝑡+ 𝛽5𝑀𝑇𝐵𝑗,𝑡+ 𝛽6 𝐿𝐸𝑉𝑗,𝑡
+ 𝛽7 𝐿𝑂𝑆𝑆𝑗,𝑡+ 𝛽8𝑄4𝑗,𝑡+ 𝜀
(1) (2)
CAR_3 CAR_5
UE 0.505*** 0.445***
(10.90) (8.95)
JUST_TOP_50 0.001 0.002
(0.96) (1.61)
JUST_TOP_50*UE 0.219** 0.196**
(2.47) (2.06)
SIZE -0.004*** -0.005***
(-10.06) (-11.32)
MTB 0.000 0.000
(1.21) (0.71)
LEV -0.002 -0.000
(-0.79) (-0.13)
LOSS -0.007*** -0.007***
(-4.42) (-3.95)
Q4 0.001 0.002**
(1.47) (2.31)
Intercept 0.040*** 0.047***
(11.31) (12.36)
t statistics in parentheses *p < 0.10, **p < 0.05, ***p < 0.01
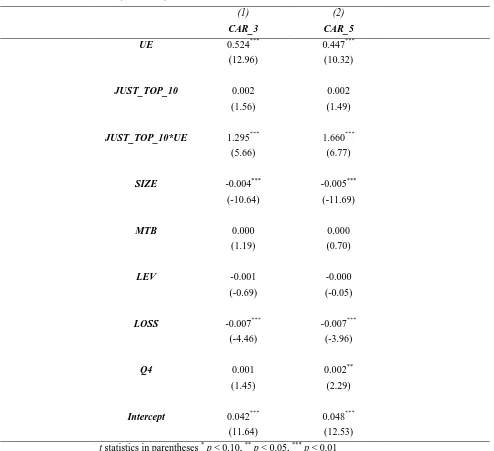
Table 6. Regression analysis JUST TOP 10
𝐶𝐴𝑅𝑗,𝑡 = 𝛽0+ 𝛽1𝑈𝐸𝑗,𝑡+ 𝛽2 𝐽𝑈𝑆𝑇_𝑇𝑂𝑃_10𝑗,𝑡+ 𝛽3 𝐽𝑈𝑆𝑇_𝑇𝑂𝑃_10𝑗,𝑡∗ 𝑈𝐸𝑗,𝑡+ 𝛽4𝑆𝐼𝑍𝐸𝑗,𝑡+ 𝛽5𝑀𝑇𝐵𝑗,𝑡+ 𝛽6 𝐿𝐸𝑉𝑗,𝑡
+ 𝛽7 𝐿𝑂𝑆𝑆𝑗,𝑡+ 𝛽8𝑄4𝑗,𝑡+ 𝜀
(1) (2)
CAR_3 CAR_5
UE 0.524*** 0.447***
(12.96) (10.32)
JUST_TOP_10 0.002 0.002
(1.56) (1.49)
JUST_TOP_10*UE 1.295*** 1.660***
(5.66) (6.77)
SIZE -0.004*** -0.005***
(-10.64) (-11.69)
MTB 0.000 0.000
(1.19) (0.70)
LEV -0.001 -0.000
(-0.69) (-0.05)
LOSS -0.007*** -0.007***
(-4.46) (-3.96)
Q4 0.001 0.002**
(1.45) (2.29)
Intercept 0.042*** 0.048***
(11.64) (12.53)
t statistics in parentheses *p < 0.10, **p < 0.05, ***p < 0.01
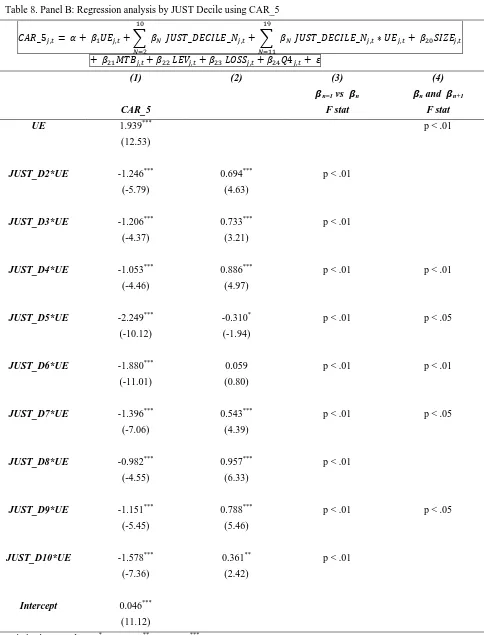
Having established that higher ranked firms have larger ERCs than lower ranked firms and that this effect is stronger in the highest 10% of firms than it is in the top 50%, we now examine at which point this effect weakens. We divide the JUST firms into 10 deciles and estimate a regression including all 9 of the 10 deciles. The top decile, that is the top 10%, will be accounted for in the coefficient on UE. Results from this regression are presented in Table 6. Panel A presents the results when the dependent variable is the 3-day cumulative return. Column 1 presents the coefficient for each interaction between the unexpected returns and the decile. Column 2 is the interpretation of the coefficient; that is the sum of the coefficient on UE (the top 10% of firms) alone plus the incremental of the interaction.
Finally, we perform an F test for the coefficient on each decile N, against the coefficient on the next decile, N+1 to see where the differences fade out. Significant levels from these results are presented in column 4 of Table 6. Interestingly, we find that while the difference between the Decile 1 (the top 10%) and Decile 2 (11%-20%) are significant at the 1% level, the difference between Deciles 2 and 3 and Deciles 3 and 4 do not produce a significant F-statistic. This indicates that while being ranked in the top 10% is related to larger ERCs, there is not much difference between being in the 11% to 40% range. However, between Deciles 4 and 5 there again is a significant F- value while between deciles 5 and 6 there is not. This would indicate that there is still value of being in the top 40% vs being below the 60th percent.
Lastly, we observe that the F-statistic on the test between Deciles 6 and 7 is significant at the 1% level, while the rest of the F-statistics are small and either significant only at the 10% level or insignificant, indicating that being ranked below the top 60% has a much bigger relation to the ERCs than being ranked in the bottom 40%.
In sum, these results would indicate that the effect that JUST rankings have on ERCs can be divided up into four segments. The top 10% has by far the largest effect. After that, companies ranked within the 40th percentile would be the second most effected. The third effect is from the 41st percentile until the 60th. Below the 60th has very little effect, although those ERCs still tend to be bigger than the non-JUST ranked firms. Clearly, the benefit of being ranked by JUST increases as firms rise in the rankings but the increase in benefits is not linear.
Table 7. Panel A: Regression analysis by JUST Decile using CAR_3 𝐶𝐴𝑅_3𝑗,𝑡=
𝛼 + 𝛽1𝑈𝐸𝑗,𝑡+ ∑10𝑁=2 𝛽𝑁 𝐽𝑈𝑆𝑇_𝐷𝐸𝐶𝐼𝐿𝐸_𝑁𝑗,𝑡+ ∑19𝑁=11 𝛽𝑁 𝐽𝑈𝑆𝑇_𝐷𝐸𝐶𝐼𝐿𝐸_𝑁𝑗,𝑡∗ 𝑈𝐸𝑗,𝑡+ 𝛽20𝑆𝐼𝑍𝐸𝑗,𝑡+
𝛽21𝑀𝑇𝐵𝑗,𝑡+ 𝛽22 𝐿𝐸𝑉𝑗,𝑡+ 𝛽23 𝐿𝑂𝑆𝑆𝑗,𝑡+ 𝛽24𝑄4𝑗,𝑡+ 𝜀
(1) (2) (3) (4)
𝜷n=1 vs 𝜷n 𝜷n and 𝜷n+1
CAR_3 F stat F stat
UE 1.738*** p < .01
(12.04)
JUST_D2*UE -1.049*** 0.689*** p < .01
(-5.23) (4.93)
JUST_D3*UE -1.068*** 0.670*** p < .01
(-4.15) (3.14)
JUST_D4*UE -0.661*** 1.078*** p < .01 p < .01
(-3.00) (6.48)
JUST_D5*UE -1.719*** 0.019 p < .01
(-8.29) (0.13)
JUST_D6*UE -1.606*** 0.132* p < .01 p < .01
(-10.08) (1.94)
JUST_D7*UE -1.099*** 0.640*** p < .01 p < .10
(-5.95) (5.54)
JUST_D8*UE -0.786*** 0.952*** p < .01
(-3.90) (6.76)
JUST_D9*UE -1.017*** 0.721*** p < .01
(-5.16) (5.35)
JUST_D10*UE -1.113*** 0.625*** p < .01
(-5.56) (4.49)
Intercept 0.039***
(10.11)
Table 8. Panel B: Regression analysis by JUST Decile using CAR_5
𝐶𝐴𝑅_5𝑗,𝑡 = 𝛼 + 𝛽1𝑈𝐸𝑗,𝑡+ ∑ 𝛽𝑁 10
𝑁=2
𝐽𝑈𝑆𝑇_𝐷𝐸𝐶𝐼𝐿𝐸_𝑁𝑗,𝑡+ ∑ 𝛽𝑁 19
𝑁=11
𝐽𝑈𝑆𝑇_𝐷𝐸𝐶𝐼𝐿𝐸_𝑁𝑗,𝑡∗ 𝑈𝐸𝑗,𝑡+ 𝛽20𝑆𝐼𝑍𝐸𝑗,𝑡
+ 𝛽21𝑀𝑇𝐵𝑗,𝑡+ 𝛽22 𝐿𝐸𝑉𝑗,𝑡+ 𝛽23 𝐿𝑂𝑆𝑆𝑗,𝑡+ 𝛽24𝑄4𝑗,𝑡+ 𝜀
(1) (2) (3) (4)
𝜷n=1 vs 𝜷n 𝜷n and 𝜷n+1
CAR_5 F stat F stat
UE 1.939*** p < .01
(12.53)
JUST_D2*UE -1.246*** 0.694*** p < .01
(-5.79) (4.63)
JUST_D3*UE -1.206*** 0.733*** p < .01
(-4.37) (3.21)
JUST_D4*UE -1.053*** 0.886*** p < .01 p < .01
(-4.46) (4.97)
JUST_D5*UE -2.249*** -0.310* p < .01 p < .05
(-10.12) (-1.94)
JUST_D6*UE -1.880*** 0.059 p < .01 p < .01
(-11.01) (0.80)
JUST_D7*UE -1.396*** 0.543*** p < .01 p < .05
(-7.06) (4.39)
JUST_D8*UE -0.982*** 0.957*** p < .01
(-4.55) (6.33)
JUST_D9*UE -1.151*** 0.788*** p < .01 p < .05
(-5.45) (5.46)
JUST_D10*UE -1.578*** 0.361** p < .01
(-7.36) (2.42)
Intercept 0.046***
(11.12)
7. Conclusion
Although previous studies have shown that investors value firms that invest in corporate social responsibility, this study measures this relation using earnings response coefficients. Thus, it examines the public’s confidence in the reliability of earnings reports for firms that are reputed to be socially conscious. Moreover, the metric used to measure a firms’ social responsiveness, the JUST- rankings is a relatively new measure which has the distinction of being directly linked with social issues that are most valued by the public at large, creating a unique setting to examine the relation between CSR and market returns.
Based on the findings in this study, it does indeed seem to be the case that investors value companies that score higher on these measures of social responsibility. This is especially true of the top 10% of firms as well as the top 50%. However, the effect seems to weaken somewhat for firms that are no longer in the top 40% of the rankings. We conclude from this study that investors do take into account the level of a corporation’s social responsibility when evaluating earnings announcements. Investors perceive increased quality and decision usefulness in earnings announcements for firms that are more socially responsible.
While this paper adds to the ongoing study of the link between CSR and market performance, there are still many avenues for research in this area. Perhaps one such avenue would be to examine the individual components that make up the JUST rankings and see how the market reacts to firms that score higher (or lower) on one or more particular components. Another possible area of research would be a look-forward approach to see if and how JUST-rankings affect investor behavior moving forward.
References
Alniacik, U., Alniacik, E. & Genc, N. (2011). How corporate social responsibility information influences stakeholders' intentions. Corporate Social Responsibility and Enviornmental Management, 18(4), 234-245. https://doi.org/10.1002/csr.245
Anderson, K. L. & Yohn, T. L. (2002). The Effect of 10k Restatements on Firm Value, Information Asymmetries, and Investors' Reliance on Earnings. https://doi.org/10.2139/ssrn.332380
Arlow, P. & Gannon, M. (1982). Social Responsiveness, Corporate Structure, and Economic Performance. Academy of Management Review, 7(2). https://doi.org/10.5465/amr.1982.4285580
Atiase, R. (1985). Predisclosure Information, Firm Capitalization, and Security Price Behavior Around Earnings Announcements. Journal of Accounting Research, 23(1), 21-36. https://doi.org/10.2307/2490905
Atiase, R. (1987). Market Implications of Predisclosure Information: Size and Exchange Effects. Journal of Accounting Research, (25), 168-176. https://doi.org/10.2307/2491265
Aupperle, K. E., Carrol, A. B. & Hatfield, J. D. (1985). An empirical examination of the relationship between corporate social responsibility and profitability. Academy of Management Journal, 28(2), 446-463. https://doi.org/10.2307/256210
Ball, R. & Brown, P. (1968). An empirical evaluation of accounting income numbers. Journal of Accounting Research, 6, 159-177. https://doi.org/10.2307/2490232
Balsam, S., Krishnan, J. & Yang, J. (2003). Auditor Industry Specialization and Earnings Quality. Auditing: A Journal of Practice & Theory, 22(2), 71-97. http://dx.doi.org/10.2139/ssrn.436260
Beaver, W. (1968). The Information Content of Annual Earnings Announcements. Journal of Accounting Research, 6, 67-92. https://doi.org/10.2307/2490070
Brown, L. D. (1993). Earnings forecasting research: its implications for capital markets research. International Journal of Forecasting, 9(3). https://doi.org/10.1016/0169-2070(93)90023-G
Chaney, P. K. & Jeter, D. C. (1992). The effect of size on the magnitude of long-window earnings response coefficients. Contemporary Accounting Research, 8(2), 540-560. https://doi.org/10.1111/j.1911-3846.1992.tb00860.x
Chi, S. S. & Shanthikumar, D. M. (2017). Local bias in google search and the market response around earnings announcements. The Accounting Review, 92(4), 115-143. https://doi.org/10.2308/accr-51632
Collins, D. & Kothari, S. (1989). An analysis of intertemporal and cross-sectional determinants of earnings response coefficients. Journal of Accounting and Economics, 11(2-3), 143-181. https://doi.org/10.1016/0165-4101(89)90004-9
Dhaliwal, D. S., Lee, K. J. & Fargher, N. L. (2010). The association between unexpected earnings and abnormal security returns in the presence of financial leverage. Contemporary Accounting Research, 8(1), 20-41. https://doi.org/10.1111/j.1911-3846.1991.tb00832.x
Easton, P. D. & Zmijewski, M. E. (1989). Cross-Sectional Variation in the Stock Market Response to the Announcement of Accounting Earnings. Journal of Accounting and Economics, 11(2-3), 117-141. https://doi.org/10.1016/0165-4101(89)90003-7
Freeman, R. N. (1987). The association between accounting earnings and security returns for large and small firms.
Journal of Accounting and Economics, 9(2), 195-228. https://doi.org/10.1016/0165-4101(87)90005-X
Friede, G., Busch, T. & Bassen, A. (2015). ESG and financial performance: aggregated evidence from more than 2000 empirical studies. Journal of Sustainable Finance & Investment, 5(4), 210-233. https://doi.org/10.1080/20430795.2015.1118917
Friedman, M. (1970, September 13). New York Times Magazine, p. 33ff.
Gamerschlag, R., Möller, K. & Verbeeten, F. (2011). Determinants of voluntary CSR disclosure: empirical evidence from Germany. Review of Managerial Science, 5(2-3), 233-262. https://doi.org/10.1007/s11846-010-0052-3
Grant, E. B. (1980). Market Implications of Differential Amounts of Interim Information. Journal of Accounting Research, 18(1), 255-268. https://www.jstor.org/stable/2490401
Hayn, C. (1995). The information content of losses. Journal of Accounting and Economics, 20(2), 125-153. https://doi.org/10.1016/0165-4101(95)00397-2
Imhoff Jr., E. A. & Lobo, G. J. (1992). The Effect of Ex Ante Earnings Uncertainty on Earnings Response Coefficients. The Accounting Review, 67(2), 427-439
Jones, T. M. & Wicks, A. C. (1999). Convergent Stakeholder Theory. Academy of Management Review, 24(2). https://doi.org/10.5465/amr.1999.1893929
JUST CAPITAL. (2018). 2018 JUST Capital Ranking Methodology. Retrieved August, 22, 2019, from https://s3.amazonaws.com/com-justcapital-web-v2/pdf/JUSTCapital_2018Methodology.pdf
Lee, A., Lim, C. Y. & Zhang, T. C. (2016). Cross-quarter differential market reactions. Pacific Accounting Review, 28(2), 219-235. https://doi.org/10.1108/PAR-07-2015-0030
Lipe, R. (1990). The relation between stock returns and accounting earnings given alternative information. The Accounting Review, 65(1), 49-71.
Livnat, J. & Mendenhall, R. R. (2006). Comparing the post-earnings announcement drift for surprises calculated from analyst and time series forecasts. Journal of Accounting Research, 44(1), 177-205. https://doi.org/10.1111/j.1475-679X.2006.00196.x
Ma, J., Pagan, J. A. & Chu, Y. (2009). Abnormal Returns to Mergers and Acquisitions in Ten Asian Stock Markets.
International Journal of Business.
Mackey, A., Mackey, T. B. & Barney, J. B. (2007). Corporate social responsibility and firm performance: Investor preferences and corporate strategies. Academy of Management Review, 32(3). https://doi.org/10.5465/amr.2007.25275676
MacKinlay, A. C. (1997). Event Studies in Economics and Finance. Journal of Economic Literature, 35(1), 13-39
Margolis, J. D. & Walsh, J. P. (2001). People and Profits? The Search for A Link Between A Company's Social and Financial Performance. New York: Psychology Press. https://doi.org/10.4324/9781410600622
Martikainen, M. (1997). Accounting Losses and Earnings Response Coefficients: The Impact of Leverage and Growth Opportunities. Journal of Business Finance & Accounting, 24(2), 277-292. from https://doi.org/10.1111/1468-5957.00105
McWilliams, A. & Siegel, D. (2000). Corporate social responsibility and financial performance: correlation or misspecification? Strategic Management Journal, 21(5), 603-609. https://doi.org/10.1002/(SICI)1097-0266(200005)21:5<603::AID-SMJ101>3.3.CO;2-V
McWilliams, A. & Siegel, D. (2001). Corporate Social Responsibility: a Theory of the Firm Perspective. Academy of Management Review, 26(1), 117-127. https://doi.org/10.5465/amr.2001.4011987
O'Brien, P. C. (1988). Analysts' forecasts as earnings expectations. Journal of Accounting and Economics, 10(1), 53-83. https://doi.org/10.1016/0165-4101(88)90023-7
Orlitzky, M., Schmidt, F. L. & Rynes, S. L. (2003). Corporate Social and Financial Performance: A Meta-analysis.
Organization Studies, 24(3), 403-441. https://doi.org/10.1177/0170840603024003910
Pava, L. M. & Krausz, J. (1996). The association between corporate social-responsibility and financial performance: The paradox of social cost. Journal of Business Ethics, 15(3), 321-357. https://doi.org/10.1007/BF00382958
Ramiah, V., Cam, M.-A., Calabro, M., maher, D. & Ghafouri, S. (2010). Changes in equity returns and volatility across different Australian industries following the recent terrorist attacks. Pacific-Basin Finance Journal, 18(1), 64-76. https://doi.org/10.1016/j.pacfin.2009.07.001
Salamon, G. L. & Stober, T. L. (1994). Cross-quarter differences in the stock price responses to earnings announcements: Fourth-quarter and seasonality influences. Contemporary Accounting Research, 11(1). https://doi.org/10.1111/j.1911-3846.1994.tb00445.x
Sayekti, Y. (2015). Strategic Corporate Social Responsibility (CSR), Company Financial Performance, and Earning Response Coefficient: Empirical Evidence On Indonesian Listed Companies. Procedia - Social and Behavioral Sciences, 211, 411-420. https://doi.org/10.1016/j.sbspro.2015.11.054
Shen, C.-H., Wu, M.-W., Chen, T.-H. & Fang, H. (2016). To engage or not to engage in corporate social responsibility: Empirical evidence from global banking sector. Economic Modelling, 55, 207-225. https://doi.org/10.1016/j.econmod.2016.02.007
Stanwick, P. A. & Stanwick, S. D. (1998). The Relationship Between Corporate Social Performance, and Organizational Size, Financial Performance, and Environmental Performance: An Empirical Examination.
Journal of Business Ethics, 17(2), 195-204. https://doi.org/10.1023/A:1005784421547
Teoh, S. & Wong, T. (1993). Perceived Auditor Quality and the Earnings Response Coefficient. The Accounting Review, 68, 346-366.
The Business Roundtable. (2019). Statement on the Purpose of a Corporation. Retrieved August 22, 2019, from https://opportunity.businessroundtable.org/wp-content/uploads/2019/08/Business-Roundtable-Statement-on-the-Purpose-of-a-Corporation-with-Signatures.pdf
Verrecchia, R. E. (1980). Consensus Beliefs, Information Acquisition, and Market Information Efficiency. American Economic Review, 70(5), 874-884.
Notes
Variable Name Variable Description
JUST An indicator variable equal to 1 for firms that are ranked by JUST Capital and 0
otherwise.
CAR_3 (CAR_5)
Cumulative abnormal return surrounding the earnings announcement for firm j at quarter t, measured over a three-day (five-day) window, where the abnormal return
is the firm’s return less the CRSP value-weighted market return.
UE
The quarterly earnings surprise for firm j at quarter t’s announcement date, scaled
by actual earnings, where expected earnings is based on the median of analyst forecasts outstanding within 60 days prior to the day before the earnings
announcement.
SIZE The log of the firm’s market value of equity.
MTB The firm’s market to book ratio.
LEV The firm’s leverage ratio.
LOSS An indicator variable equal to 1 if actual reported earnings per share are less than
zero, and 0 otherwise.
Q4 An indicator variable equal to 1 if the earnings announcement is for the fourth quarter of the firm’s fiscal year, and 0 otherwise.
Note 1. Although the universe of JUST ranked companies is composed of firms in the Russell 1000 (roughly equivalent to the 1,000 largest, publicly traded U.S. companies by market capitalization) due to data availability as well as companies that have been acquired, in actuality only 890 companies were ranked by JUST Capital in 2018.
Note 2. These weights, provided by JUST Capital (https://justcapital.com/polling/) add up to 101%, presumably due to rounding.
Note 3. Just recently, The Business Roundtable, an association of the chief executive officers of nearly 200 of America’s largest and most influential companies, released a new Statement on the Purpose of a Corporation
(available at
https://opportunity.businessroundtable.org/wp-content/uploads/2019/09/BRT-Statement-on-the-Purpose-of-a-Corpor ation-with-Signatures-1.pdf ), signed by 181 CEOs in which they essentially reject Friedman’s idea. In the statement, they commit to delivering value to customers, investing in employees, dealing fairly and ethically with suppliers and supporting communities. The very last commitment they mention is to generate long-term value for shareholders.
Note 4. When performing an event study of earnings announcements, the day following the announcement day is usually added to the event window to capture the market reaction in the event the announcement occurs after trading hours. Additionally, one day prior to the announcement day is added to capture the market reaction to possible information leakages preceding the official earnings announcement. Adding too many days may lower the accuracy of the test due to the possibility of confounding effects from other market events (MacKinlay, 1997). To examine the sensitivity of the earnings announcement to different lengths, we test both for abnormal returns for a three-day window (-1, +1) and a five-day window (-2, +2).