Phylogenetic Tree Construction Using K-Mer
Forest-Based Distance Calculation
https://doi.org/10.3991/ijoe.v16i07.13807
G. Gamage(*), N. Gimhana, I. Perera, S. Bandara, T. Pathirana University of Moratuwa, Moratuwa, Srilanka
A. Wickramarachchi, V. Mallawaarachchi
The Australian National University, Canberra, Australia
Abstract—Phylogenetics is one of the dominant data engineering research disciplines based on biological information. More particularly here, we consider raw DNA sequences and do comparative analysis in order to come up with mean-ingful conclusions. When representing evolutionary relationships among differ-ent organisms in a concise manner, the phylogenetic tree helps significantly. When constructing phylogenetic trees, the elementary step is to calculate the ge-netic distance among species. Alignment-based sequencing and alignment-free sequencing are the two leading distance computation methods that are used to find genetic relatedness of different species. In this paper, we propose a novel alignment-free, pairwise, distance calculation method based on k-mers and a state of art machine learning-based phylogenetic tree construction mechanism. With the proposed approach, we can convert longer DNA sequences into compendious k-mer forests which gear up the efficiency of comparison. Later we construct the phylogenetic tree based on calculated distances with the help of an algorithm build upon k-medoid clustering, which guaranteed significant efficiency and ac-curacy compared to traditional phylogenetic tree construction methods.
Keywords—Phylogenetics; genetic relatedness; genetic distance; k-mer forest; k-medoid clustering.
1
Introduction
distances are used to identify the origins of biodiversity. Knowledge of biodiversity is essential for breeding domestic and phylogenetically valued animals. Some rare breeds should be protected to keep the genetic diversity equilibrium in the future [4].
The phylogenetic tree (Evolutionary tree) is a branching diagram that shows the evo-lutionary relationships among various organisms. It is constructed by considering the similarities and differences of species genetically or physically. Phylogenetic trees can be used in scenarios such as identifying the origins of species, finding common ances-tors, cluster species etc. Genetic distance calculation is the crucial step of phylogenetic tree construction. The proposed two-stage methodology in this paper is introduced as a more accurate and efficient way of constructing phylogenetic trees. In the first stage, a novel genetic distance computation method is used to build a distance matrix. In the next step, the sophisticated machine learning approach is used to construct the tree based on the distance matrix. Other than tree construction, the distance matrix is one of the key inputs of most of the biological applications, including population genetics and metagenomic binning. Similarly, phylogenetic trees are also used in various bioinfor-matics based researches as a fundamental component. Thus, from the distance matrix construction and phylogenetic tree construction methods we made here an open path to several research areas branching in the field of bioinformatics
2
Background
There are two stages in the pipeline of phylogenetic tree construction. In the first stage, it is required to get all to all genetic distances among species. The final output of this stage is to build the distance matrix. In the next step, phylogenetic tree construction is happening based on this distance matrix. Genome sequence alignment [5] is one ap-proach used to compute genetic distances in bioinformatics which rely on alignment. BLAST [6] a well-known Basic Local Alignment Search Tool, can be taken as an ex-ample of an alignment-based distance calculation method. Since its searching capabil-ities against a database, BLAST is also used as a bioinformatics teaching material. However, when dealing with larger sequences, its performance is poor as it focuses more on aligning regions while discarding the mismatches [7]. These alignment-based methods are highly based on heuristics, and because of that, when some parts are getting aligned other parts can be ignored even if they are similar. Thus these approaches tend to generate less accurate results in certain scenarios. Besides, alignment-based tools need users to do heavy processing steps to make sequences eligible for alignment-based comparisons. Hence it is clear that the use of these implementations makes distance calculations strenuous in practice.
experiments instead of humans. But when we use alignment-based tools, they tend to provoke lesser similarity, which is not correct compared to actual values. Another rea-son makes bioinformaticians demotivate on these methods is the high time consumption [8]. Hence, several research studies are conducted to enhance traditional alignment-based distance calculation methods by introducing hardware support[9] and recommen-dation systems[10].
Alignment free methods were suggested by bioinformaticians to address the short-comings in alignment-based methods. These methodologies represent genome se-quences as estimations (Time-series distribution / Feature vector, etc.) of the raw ge-nome sequences to speed up the comparison process. Typically, other than distance calculation, alignment-free approaches are used in sequence similarity searches [11], clustering and classification of sequences [12]. Since the lower usage of computational resources, alignment-free methods are named as a better choice for most genome-re-lated comparison experiments. Since these methods are based on subsequence occur-rences, they are considered as high memory consuming algorithms [13]. Compared to the alignment-based methods, this kind of approaches is still in the development stage. Therefore, it is clear that to apply alignment-free methods to phylogenetic applications, we need further testing for robustness and scalability.
In present days, alignment-free k-mer and word frequency-based techniques are used in phylogeny applications instead of the genome alignment methods [14]. In a general context, comparison of word frequencies is a smooth process than aligning massive genome sequences which utilizing a high cost of computational resources [15][16]. Fea-ture Frequency Profiles (FFP) of whole genomes is an example of such method in this alignment-free context, which uses word frequencies supported by ‘a variation of a text or book comparison’ method[17]. Composition vector (CV) is another method that computes the normalized frequency of every potential k-mer in given sequences to cal-culate the genetic relatedness.
In alignment-free approaches, genetic distances are approximated generally with Co-sine distance function [18],[19]. Both FFP and CV will interpret the genome sequence using the frequencies of word presence. Moreover, there are some other methodologies, such as spaced-word frequencies to match words for a predefined pattern[20].
Unlike described alignment-free methods, Return Time Distribution (RTU) esti-mates the genome sequence as a time distribution. Instead of word count, it considers the amount of time required for the reappearance of k-mers [21]. In alignment-free methods, all most all of them are estimating and represent the genome in different for-mats. Even though these estimation-based genome representations reduce the compar-ison time, the resultant accuracy is also decreased because of information loss. How-ever, to get a higher accurate genome comparison based on words, we must avoid these estimations and consider both common and distinct k-mers/words of pairwise raw se-quences. Yet the problem is this process requires a considerable amount of time and processing as we are comparing raw sequences. Thus when sequences are longer, this method became infeasible.
[22]. For the genetic distance calculation, we consider both common and distinct k-mers in each corresponding sequence pairs. Further, we use the Jaccard Index [23] to generate highly accurate distance values that are based on the concept of intersection over the union. As elaborated later in the paper, our method is developed with the ex-pectation of generating the genetic distances with a minimum error when compared to existing alignment-free methods like RTD or FFP. That is because, in the proposed approach, it directly considers similar and dissimilar word counts instead of estimations (e.g., reappearance time-RTD or occurrence patterns-FFP).
Since we do compare genomes using k-mer forests instead of direct scanning through larger sequences for k-mer matching, we have achieved considerably high efficiency. In addition to that, with the help of the pruning algorithm, we developed, we can expect up to 50% speedup in forest comparison. We can guarantee that the proposed method-ology provides more accuracy while satisfying the efficiency requirements.
There are several existing methods and tools for phylogenetic tree construction. (IQTree, MEGA). Most of those methods developed by using the neighbour-joining approach. Neighbour-joining is a bottom-to-top approach which means it combines most similar pairs of species and continues to grow the tree upwards. This method in-herits some issues. More particularly, in each step, it is required to construct a distance matrix, and this repeated process consumes a considerable amount of time and unnec-essary effort leading to reduced efficiency in the process. When getting distances with the combined branches, it takes the arithmetic mean as the new distance which intro-duces some error. Thus, when distances have less variation, this might lead to the wrong branch joining. Addition to that, if an error occurred, that will propagate to each itera-tion of the distance matrix. In such scenarios, UPGMA might be failing.
Compared to neighbour-joining methods, our proposed idea is more accurate since it follows a top-to-bottom mechanism by considering all the genetic distances in each of the steps for constructing the tree. Because it considers actual genetic distance in-stead of arithmetic mean approximation, error propagation does not happen. In addition to that, tree construction is efficient as there is no repeated work as the neighbour-join-ing method. Because of this, we can mention that our tree construction mechanism is also accurate and efficient than conventional phylogenetic tree construction methods.
3
Research Materials and Datasets
3.1 Genomic datasets
The whole-genome sequences (FASTA format - *.fna) were downloaded from the NCBI database (ftp.ncbi.nlm.nih.gov/genomes/). For the comparisons and results, we used genomes of Bolivian squirrel monkey (ID 6907), Honeybee (ID 48) and North American deer mouse (ID 11397).
3.2 Development tools and environmental configurations
For the K-mer counting, we used the DSK k-mer counting tool ([25]). Python was the primary programming language used to implement algorithms. Testing Environ-ment: 32GB RAM, four cores of CPU, 1TB Storage, Ubuntu 16.04
After downloading the corresponding genome datasets from NCBI, we extracted k-mers using the DSK tool. The output contains a list of k-mer strings and their frequen-cies. We converted that output to CSV (Comma Separated Values) to achieve the ubiq-uitousness and compactness of data.
4
Methodology
To address the issues mentioned above, we proposed a novel method of genetic dis-tance calculation and phylogenetic tree construction.
The proposed method of genetic distance calculation is based on k-mer count (word count), and it is an alignment-free technique. K-mers are substrings that have a length of k. As we have discussed in the background section, existing alignment-free methods such as Feature frequency profiles (FFP) [17], Composition vector (CV) and Return time distribution (RTD) use different of estimations to represent the genomes, which reduce the accuracy in distance calculation. Additionally, these methods are failing to consider common and distinct k-mers in relevant sequences that are required to give high precision in comparison. However, with our approach of generating the k-mer for-ests, we can represent large whole-genome sequences in a compact and simplified man-ner, which helps us to consider common and distinct substrings conveniently.
More particularly, with this method, we can expect high accuracy as well as effi-ciency. Calculating genetic distance consists of two major steps, explained in Part A and Part B below. At the end of those two steps, the distance matrix can be generated. Then, we move to Part C, i.e. phylogenetic tree construction using those distances.
4.1 Part A - Creating k-mer forests for sequences
The initial step of genetic distance calculation is constructing k-mer forests for each of the whole genome sequences. To build the forest, initially, it is required to list all distinct k-mers of the genome sequence. To do that, we used DSK (disk streaming of k-mers) k-mer counting software which lists k-mers with a considerable low memory and disk usage [25]. After collecting the distinct k-mers, the k-mer forest is built, as explained in the flowchart in Fig. 2.
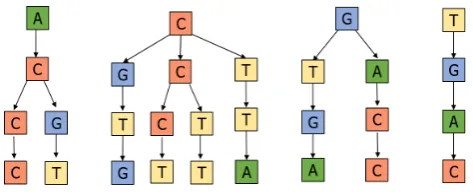
max-imum number of trees became 20 as alphabet size is 20. Hence ultimately massive ge-nome sequences are converted to a simplified structure, which is straightforward to compare the genetic distance with this k-mer forest construction method. Figure 1 shows an example of constructing a k-mer forest for a given sequence.
Fig. 1. Building a k-mer forest for an example sequence
Fig. 2. Flow chart for the algorithm of building the k-mer forest
still we get this size of forest (with max four trees), and each tree's depth is also k. Because of this approach, even though the genome sequence is several billion charac-ters long,still we get a forest of max size equal to alphabet size and max tree depth equal to value k.It is expected to perform better than comparing naked genome sequences to find common and distinct k-mers.
4.2 Part B - Calculate distances using the tree comparison algorithm
After completing Part A, we have successfully converted the large DNA sequences to concise k-mer forests. In this second stage, we compare those forests to get the ge-netic distance between species. To do that we are proposing a novel tree comparison algorithm supported with tree pruning. With that, forests are compared with optimal traversal and minimum time consumption. Following algorithm 1 shows the implemen-tation of tree comparison mechanism
Here in pruning based comparison,instead of traversing entire forests from root to leaves to find common and distinct k-mers, we can prune certain tree sections based on identification in higher levels.With that, the amount of work reduced by a considerable amount. When we compare two forests, it happens level by level from root to leaves. If forest A is compared with forest B, this algorithm returns Jaccard similarity between A and B. Pruning happens once any node is encountered uncommon and then,without traversing through children of that node in the second tree, using a recursive function [26] add the child count to the distance directly (uncommon k-mer count).With that, efficiency is drastically improved as no need for traversing children of such a node.
parent C) is present in the forest I but not in forest II. Thus, here pruning taking place and child count of that Node A is directly added to the distance without traversing through its children nodes (circled in Fig. 3).
Fig. 3. k-mer forest pruning
Ultimately here it identifies there are no any kmer starting with “CA” in Forest II and rapidly get distance updated from “CA” starting k-mers in Forest I.
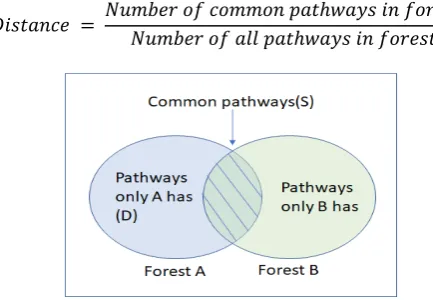
𝐷𝑖𝑠𝑡𝑎𝑛𝑐𝑒 = 𝑁𝑢𝑚𝑏𝑒𝑟 𝑜𝑓 𝑐𝑜𝑚𝑚𝑜𝑛 𝑝𝑎𝑡ℎ𝑤𝑎𝑦𝑠 𝑖𝑛 𝑓𝑜𝑟𝑒𝑠𝑡𝑠 𝑁𝑢𝑚𝑏𝑒𝑟 𝑜𝑓 𝑎𝑙𝑙 𝑝𝑎𝑡ℎ𝑤𝑎𝑦𝑠 𝑖𝑛 𝑓𝑜𝑟𝑒𝑠𝑡𝑠
Fig. 4. Venn diagram showing the pathways of forest A and B
In summary, once we get set of genome sequences to construct the phylogenetic tree, we build k-mer forest for each of those sequences using the method in Part A. After-wards, we compare each of those forests and calculate all-to-all distances using the technique explained in Part B. The outcome of these two stages is an all-to-all distance matrix, which consists of genetic relatedness among the given species set.
4.3 Part C - Creating phylogenetic tree
After completing Part A and Part B, the distance matrix is made, and the next step is to construct the phylogenetic tree based on these distances. To do that, we used an al-gorithm built on top of k-medoid clustering. That can overcome the problems we have in conventional neighbour-joining tree construction approaches. Algorithm 2 shows the method we used to construct the tree.
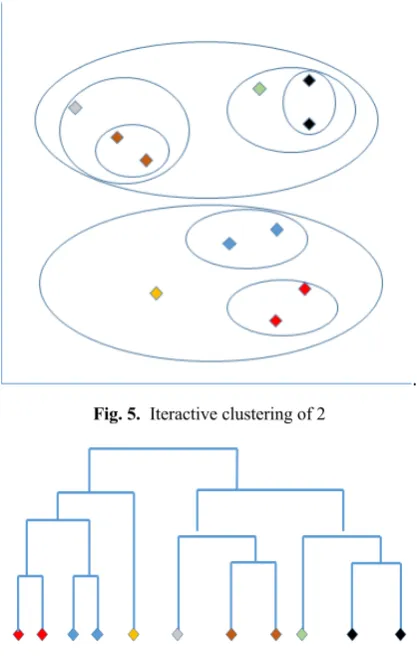
Here we use the k medoid algorithm by taking K as 2. First, we are dividing the entire species set to two clusters by considering all to all distances from the distance matrix. Afterwards, we iteratively apply the same process to those two clusters and separate each into another two clusters as all together we get 4 clusters. This process is repeated until a single species belongs to one cluster. In the algorithm, we have satisfied this by recursive techniques.
.
Fig. 5. Iteractive clustering of 2
Fig. 6. The generated phylogenetic tree
5
Results and Evaluations
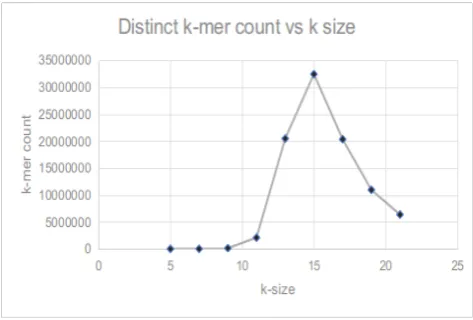
In this section, we present the results and evaluations we made on our genetic dis-tance calculation and phylogenetic tree construction methods. When considering the k-mer forest construction, one of the crucial decisions is to select the best appropriate k value to extract k-mers. When we are using different k values, the number of distinct mers can be obtained from the sequence is changing. When the number of distinct k-mers is increasing, it can describe the genome sequence better. Thus, we experimented to figure out the best suitable value to construct the k-mer forest to get better results.
this particular experiment, we have chosen the whole DNA sequence of Apis mellifera (Honeybee).
Fig. 7. Distinct k-mer count vs k-mer size graph
In addition to that, we have evaluated how forest comparison time varies with the different k values of the genome. For this experiment too, we have used the k-mer forest of species Apis mellifera. The comparison is made against itself to get the worst-case comparison (no pruning).
When comparing this graph with the previous graph, it shows a similar nature and meets the peak point at 15. Hence, this explains that forest comparison time-varying proportionally to the number of distinct k-mers.
Fig 8 shows the worst-case forest comparison time at the peak; still, it takes only about 50 seconds to make the entire forest comparison. Hence, this is again considera-bly high performance compared to other alignment-free approaches.
5.1 Performance of tree comparison algorithm – Pruning
As we discussed above, the tree comparison algorithm is based on tree pruning. If a particular node does not exist in the other forest without traversing through its child nodes, all subroutines of that node will be added to the distance using Algorithm 3. With this, tree comparison time can be improved by up to 50%.
The following table shows the percentage of speed-up in comparison when pruning occurs. For this, we have taken the 13-mer forest of Peromyscus maniculatus which consists of 67108864 distinct k-mers in 4 trees. There are five cases, and each of those cases forest is compared with itself by removing trees. Speed up is calculated concern-ing the non-prunconcern-ing case [26].
Tree count in A Trees count in B Pruned tree count Time taken (s) % speedup
4 4 0 (non-pruning
case) 28.927 0%
4 3 1 (25%) 27.413 5.25%
4 2 2 (50%) 24.743 14.48%
4 1 3 (75%) 20.326 29.73%
4 0 4(all trees are
pruned) 14.408 50.19%
Table 1. Comparison time speedup with pruning
5.2 Phylogenetic tree construction
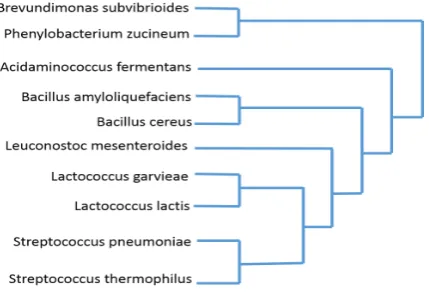
Using the distance matrix we built at the end of steps A and B, we made the phylo-genetic tree using our modified version of the k-medoid algorithm. Here we have used 10 Bacteria as our species set and the phylogenetic tree is constructed as follows (Figure 9). Bacteria set is used as genetic distance variance is extremely low, and high sensitiv-ity is required to cluster them. Our method has successfully built the forest as below.
When comparing the above tree with the NCBI taxonomy, this shows better accuracy compared to the neighbour-joining method as bacteria belong to the same kingdom, are in the same sub-branches. Reason for that is when getting arithmetic means in less var-iant distances results mismatchings. Therefore, when comparing the tree constructed by neighbour-joining with the taxonomy, we can justify that our method is performed at an increased accuracy.
5.3 Accuracy of genetic distances and phylogenetic tree
For assessing the accuracy of the genetic distances, either we must evaluate our re-sults with globally recognized ground truths or use distance values calculated by other existing methods. When considering the existing genetic distance calculation methods, they use their techniques to generate distances.
Because of the specificity of the existing methods, we cannot compare the distances since they belong to different scales and interpretations. However, one good way to evaluate the accuracy of distances is to compare relative distances between species from different methods. To do that, the best approach is to compare phylogenetic trees gen-erated from different methods as they are a direct indication of relative distances. At the same time, we cannot guarantee that the existing methods such as FFP, RTU, BLAST can provide us high accurate phylogenetic trees because of their inherited is-sues as we explained in the background section of the paper.
Fig. 10.Phylogenetic tree accuracy compared to taxonomy
When considering tree construction performance, as not required to construct the distance matrix in each step, our method has comparatively small phylogenetic tree construction time. As explained by the following diagram (Fig. 9), forest construction time increased with the number of species. Here when constructing a phylogenetic tree using all 10 species only required about 600 ms.
Fig. 11.Phylogenetic tree construction time vs species count graph
6
Discussion and Conclusion
When comparing our genetic distance calculation method to other existing methods, our method outperforms both the accuracy and efficiency-wise. The reason behind that is in our approach we consider the direct representations to genome sequences by k-mer forests instead of estimations. With the help of tree comparison and pruning mech-anism, the efficiency is further increased.
The outcome of the genetic distance calculation method is to construct the distance matrix. The phylogenetic tree is made based on this distance matrix. Our way of phy-logenetic tree construction is efficient and accurate in contrast to most of the existing neighbour-joining based tree construction methods. Avoidance the repeated work, error propagation, and using a top-down approach is the reason behind it.
As the next stage of our research, we are planning to enhance the accuracy of the genetic distance calculation method by considering the kmer frequency. We planned to optimized tree pruning by keeping child count at each internal node. So in situations like case 5 in pruning performance table, we can complete comparison in near-zero time. Further, we are working on proposing a neural network to add new species to the already constructed phylogenetic trees efficiently. Addition to that it is expected to in-crease the performance of genetic distance calculation tree construction methods by integrating GPU capabilities [28]. Once the entire phylogenetic tree construction and updating workflow is built, it is expected to integrated with our existing bioinformatics learning workflow[29].
7
References
[1]Contributors to Wikimedia projects, “Genetic distance - Wikipedia,” Wikimedia Founda-tion,Inc.,21-Sep-2005.[Online].Available:https://en.wikipedia.org/wiki/Genetic_distance. [Accessed:10-May-2019].
[2]Meynell, E., Meynell, G. G., & Datta, N. (1968). Phylogenetic relationships of drug-re-sistance factors and other transmissible bacterial plasmids. Bacteriological reviews, 32(1), 55–83. https://doi.org/10.1128/mmbr.32.1.55-83.1968
[3]S. Mallick et al., “The Simons Genome Diversity Project: 300 genomes from 142 diverse populations,” Nature, vol. 538, no. 7624, p. 201, Sep. 2016.
[4]Ruane, J. (1999). A critical review of the value of genetic distance studies in conservation of animal genetic resources. Journal of Animal Breeding and Genetics, 116(5), 317-323. Chicago. https://doi.org/10.1046/j.1439-0388.1999.00205.x
[5]Vinga, S; Almeida, J (2003). "Alignment-free sequence comparison a review". Bioinformat-ics. 19 (4): 513–23, doi:10.1093/bioinformati cs/btg005. PMID 12611807.
[6]"BLAST: Basic Local Alignment Search Tool", Blast.ncbi.nlm.nih.gov, 2019. [Online]. Available: https://blast.ncbi.nlm.nih.gov/Blast.cgi. [Accessed: 08- May- 2019]. https://doi. org/10.1007/978-3-7643-8526-2_6
[7]"BWA," Github, [Online].Available: https://github.com/lh3/bwa. [Accessed 9 May 2019]. [8]Zielezinski, A., Vinga, S., Almeida, J. et al. Alignment-free sequence comparison: benefits,
applications, and tools. Genome Biol 18, 186 (2017). https://doi.org/10.1186/s13059-017-1319-7
[9]
Computer Applications (ICSCA 2019), ACM, New York, USA, 2019, pp. 6-10, Malaysia. https://doi.org/10.1145/3316615.3316630
[11]O. G. Samarasinghe, J. A. C. G. Jathunarachchi, H. M. D. Jeewanthi, D. A. Meedeniya, S. Rajapaksa, “Rule-Based Recommendation System for Phylogenetic Inference”, Moratuwa Engineering Research Conference (MERCon), IEEE explorer, Sri Lanka, 2019. pp. 704-709. https://doi.org/10.1109/mercon.2019.8818878
[12]Hide, W; Burke, J; Davison, DB (1994). "Biological evaluation of d2, an algorithm for high-performance sequence comparison". Journal of Computational Biology. 1 (3): 199–215. https://doi.org/10.1089/cmb.1994.1.199
[13]Miller, RT; Christoffels, AG; Gopalakrishnan, C; Burke, J; Ptitsyn, AA; Broveak, TR; Hide, WA (1999). "A comprehensive approach to clustering of expressed human gene sequence: the sequence tag alignment and consensus knowledge base". Genome Research. 9 (11): 1143–55. https://doi.org/10.1101/gr.9.11.1143
[14]C. X. Chan and M. A. Ragan, “Next-generation phylogenomics,” Biology Direct, vol. 8, no. 1, Jan. 2013, doi: 10.1186/1745-6150-8-3 https://doi.org/10.1186/1745-6150-8-3.
[15]Chan, CX; Ragan, MA (Jan 2013). "Next-generation phylogenomics". Biology Direct. 8: 3. PMC 3564786. PMID 23339707. https://doi.org/10.1186/1745-6150-8-3
[16]R. Bromberg, N. V. Grishin, and Z. Otwinowski, “Phylogeny Reconstruction with Align-ment-Free Method That Corrects for Horizontal Gene Transfer,” PLoS Comput. Biol., vol. 12, no. 6, p. e1004985, June. 2016. https://doi.org/10.1371/journal.pcbi.1004985
[17]El-Seoud, S. A., Mohamed, R. F., & Ghoneimy, S. (2017). DNA Computing: Challenges and Application. International Journal of Interactive Mobile Technologies (iJIM), 11(2), 74. https://doi.org/10.3991/ijim.v11i2.6564
[18]G. E. Sims, S.-R. Jun, G. A. Wu, and S.-H. Kim, “Alignment-free genome comparison with feature frequency profiles (FFP) and optimal resolutions,” Proceedings of the National Academy of Sciences, vol. 106, no. 8, pp. 2677–2682, Feb. 2009. https://doi.org/10.107 3/pnas.0813249106
[19]Apostolico, A; Denas, O (March 2008). "Fast algorithms for computing sequence distances by exhaustive substring composition". Algorithms for Molecular Biology. 3. https://doi.org/ 10.1186/1748-7188-3-13
[20]Apostolico, A; Denas, O; Dress, A (September 2010). "Efficient tools for comparative sub-string analysis". Journal of Biotechnology. 149 (3): 120–126. https://doi.org/10.1016/j.jbiotec.2010.05.006
[21]Leimeister, CA; Boden, M; Horwege, S; Lindner, S (2014). "Fast alignment-free sequence comparison using spaced-word frequencies". Bioinformatics. 30 (14): 1991–1999. doi:10.1093/bioinformatics/btu177. PMC 4080745. PMID 24700317. https://doi.org/10.1093/bioinformatics/btu177
[22]P. Kolekar, M. Kale, and U. Kulkarni-Kale, “Alignment-free distance measure based on return time distribution for sequence analysis: Applications to clustering, molecular phylog-eny and subtyping,” Molecular Phylogenetics and Evolution, vol. 65, no. 2, pp. 510–522, Nov. 2012, https://doi.org/10.1016/j.ympev.2012.07.003
[23]H. Li, “Minimap2: pairwise alignment for nucleotide sequences,” Bioinformatics, vol. 34, no. 18, pp. 3094–3100, May 2018, https://doi.org/10.1093/bioinformatics/bty191
[24]"Jaccard index", En.wikipedia.org, 2019. [Online]. Available: https://en.wikipedia.org/wi ki/Jaccard_index. [Accessed: 11- May- 2019].
[25]Ncbi.nlm.nih.gov. (2019). FTP access to GenBank data Bacteria. [online] Available at: ftp://ftp.ncbi.nlm.nih.gov/genomes/genbank/bacteria/ [Accessed 7 Aug. 2019].
[27]G. Gamage, N. Gimhana, A. Wickramarachchi, V. Mallawaarachchi, and I. Perera, “Align-ment-free Whole Genome Comparison Using k-mer Forests,” in 2019 19th International Conference on Advances in ICT for Emerging Regions (ICTer), 2019, https://doi.o rg/10.1109/icter48817.2019.9023714
[28]"Taxonomy browser (root)", Ncbi.nlm.nih.gov, 2019.[Online].Available at:https://www.ncb i.nlm.nih.gov/Taxonomy/Browser/wwwtax.cgi. [Accessed: 27- Oct- 2019]
[29]S. Rajapaksa, W. Rasanjana, I. Perera, and D. Meedeniya, “GPU Accelerated Maximum Likelihood Analysis for Phylogenetic Inference,” in Proceedings of the 2019 8th Interna-tional Conference on Software and Computer Applications - ICSCA ’19, 2019, https://doi.org/10.1145/3316615.3316630
[30]V. Mallawaarachchi, A. Wickaramarachchi, A. Weliwita, I. Perera, and D. Meedeniya, “Ex-periential Learning in Bioinformatics – Learner Support for Complex Workflow Modelling and Analysis,” International Journal of Emerging Technologies in Learning (iJET), vol. 13, no. 12, p. 19, Dec. 2018, https://doi.org/10.3991/ijet.v13i12.8608
8
Authors
G. Gamage is a Junior Consultant in Dept. of Computer Science & Engineering (CSE), University of Moratuwa, Srilanka. Former Research Assistant at LiveLabs, School of Information Systems, Singapore Management University. His research areas are Bioinformatics, Computer Vision, Data Science and Machine Learning. E-mail [email protected]
N. Gimhana is a graduate from Dept. of CSE, University of Moratuwa, Srilanka. His research areas are Machine Learning, Bioinformatics and Information Systems.
S. Bandara is a graduate from Dept. of CSE, University of Moratuwa, Srilanka. His research areas are Machine Learning, Bioinformatics and Data Mining.
T. Pathirana is a graduate from Dept. of CSE, University of Moratuwa, Srilanka. His research areas are Machine Learning, Software Engineering and Bioinformatics.
I. Perera is a Senior Lecturer at the Dept. of CSE, University of Moratuwa, Sri Lanka. He holds a PhD (St Andrews, UK) MBS (Colombo), MSc (Moratuwa), PGDBM (Colombo) and B.Sc. Eng. (Hons) (Moratuwa). His research interests include software engineering, UX and Health Informatics. He is a Fellow of HEA(UK), MIET, SMIEEE and a Chartered Engineer registered at EC (UK) and IE(SL).
A. Wickramarachchi, isa PhD student at ANU, Australia (Computer Science/Com-putational Biology). He graduated from the University of Moratuwa, studied Computer Science and Engineering. He holds CIMA adv. dip. in MA and a Diploma in AutoCAD.
V. Mallawaarachchi is a PhD student at ANU, Australia (Computer Science/Com-putational Biology. Her academic interests are in the areas of Bioinformatics, Software Engineering, Software Architecture, HCI, Algorithms and Data Mining.