Web-based Platform for Training in Biomedical Signal
Processing and Classification: the Particular Case of
EEG-based Drowsiness Detection
https://doi.org/10.3991/ijoe.v14i03.8193Daniel Ribeiro, César Teixeira, Alberto Cardoso!!"
University of Coimbra, Coimbra, Portugal
Abstract—Online Experimentation, which comprises remote and virtual experimentation, has played an important role, over the years, in the develop-ment of the students learning process. One of its examples is the use of web-based resources to study physiological events in topics of biomedical engineer-ing. This article discusses the use of a virtual experimentation environment as a training tool for studying different methodologies that can be applied to detect drowsiness based on electroencephalogram (EEG) signals. As a result of this web-based platform, students can be more motivated to learn different methods that can be used in the processing and analysis of physiological data. As a final result, it can even be used to create a real-time detector for drowsiness, thus preventing the occurrence of road accidents.
Keywords—Drowsiness, Electroencephalogram (EEG), Web-based resources, Online experimentation
1
Introduction
This article presents a web-based platform that aims to improve the learning pro-cess of biomedical engineering students on signal propro-cessing and classification. Here, the drowsiness detection based on EEG signals is taken as an example.
Sleep can be categorized into two types, rapid eye movement (REM) and non-rapid eye movement (NREM). The latter can be further divided into 4 stages: 1, 2, 3 and 4 [7]. In this work, the focus is into stage 1 because it corresponds to the transition period between awareness and sleepiness, the case study considered in this paper. At this stage, the brain waves and activities begin to slow down, translating into de-creased EEG signal frequency and, in some cases, contractions called hypnagogic myoclonus may occur, preceded by a falling sensation. This stage has an average duration of 1 to 7 minutes in the initial cycle [7].
The paper is organized as follows: Section 2 describes the methods developed in this work, regarding the signal processing and classification, as well as how to use the web platform. Section 3 is devoted to presenting the results obtained with the differ-ent methodologies. Finally, in Section 4 some conclusions are drawn.
2
Methods
2.1 Signal processing & classification pipeline
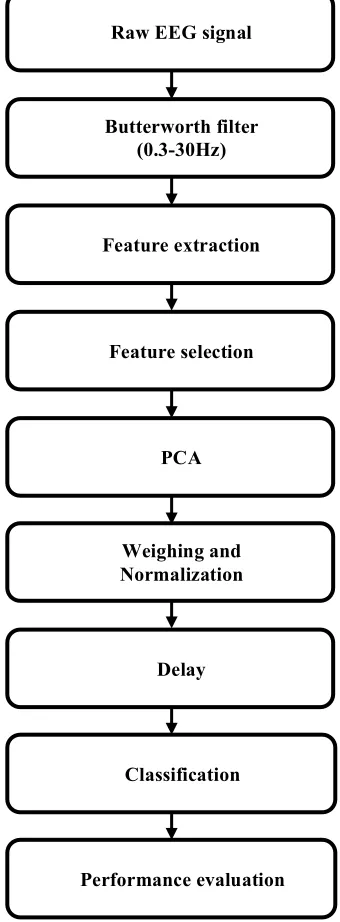
The developed platform uses Matlab as processing engine. The implemented pro-cessing steps are shown in Figure 1. First, these signals were filtered with a band-pass Butterworth filter, with a pass-band from 0.3 to 30Hz. This frequency range was cho-sen since outside it we have no biological meaning for the physiological process in question: below 0.3Hz, we have the presence of artifacts from other signals and in the 50Hz range, the presence of noise.
In a next step, the features were extracted, using different window sizes and incre-ments, for further study. Having extracted the amount of 13 features, the most repre-sentative ones were selected, using appropriate selection methods. In total, five selec-tion methods were used. It has been decided that a feature is considered relevant to the problem if it is selected as relevant by at least two methods. The features were extracted from the time and frequency domains. From the time domain, mean, vari-ance, asymmetry, kurtosis and Hjorth coefficients (complexity and mobility) were extracted. As features from the frequency domain, entropy, average power, power spectrum density and relative power in conventional EEG sub-bands were taken into account. Later, the use of Principal component Analysis as a feature reduction method was studied.
In the final step, the introduction of delay in the input data was studied, and then different classifiers were created and trained so that they could be used later in the web platform. Regarding classification, classifiers were trained to identify the drows-iness and non-drowsdrows-iness states.
Fig. 1. Processing steps implemented for drowsiness detection.
Raw EEG signal
Butterworth filter (0.3-30Hz)
Feature extraction
Feature selection
PCA
Weighing and Normalization
Delay
Classification
2.2 Web Platform
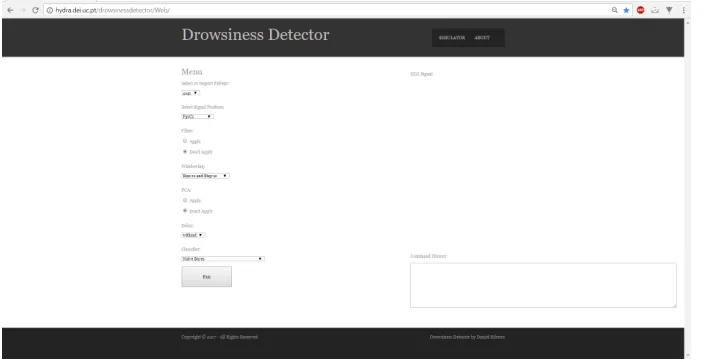
Development. Has already mentioned, the web platform, shown in Figure 2, was developed with the purpose of helping students to study and understand the best methodologies to detect situations of drowsiness, thus offering an initial help in the development of their work through a different learning process. Additionally, with this platform, students can improve their sensitivity on the impact of certain method-ologies used in signal analysis and processing.
Fig. 2. Web platform developed to study methods for the detection of drowsiness.
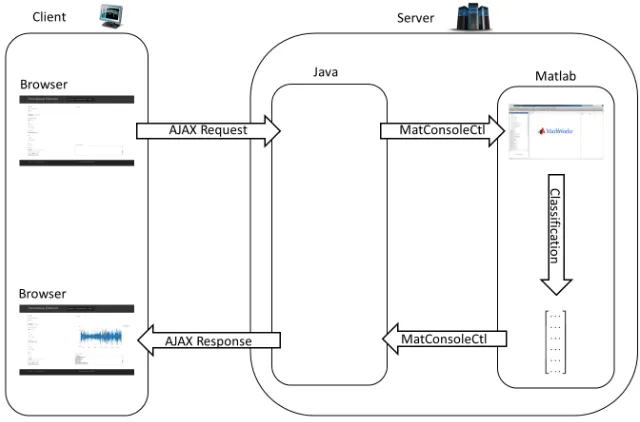
Regarding the web platform, on the server side, Java was used, while on the client side, several web languages were considered, such as Hypertext Markup Language (HTML), JavaScript, among others. More precisely, all the structuring and presenta-tion of the content is done through HTML, along with the Cascading Style Sheets (CSS), where the styles (colors, fonts, spacing, etc.) of the web document are defined. The purpose of CSS is to store all information related to the project, rather than being placed in HTML, making the project more structured and organized.
Also in the client-side, JavaScript was used, which is "triggered" when the user presses the Run button, using Asynchronous JavaScript and XML (AJAX) to make asynchronous requests. With AJAX, the web platform can send requests to the server and receive them asynchronously (in the background) without interfering with the display and behavior of the existing webpage. By separating the submission layer from the presentation layer, AJAX allows webpages to dynamically change their content without the need to reload the entire page. To facilitate the use of AJAX, the JavaScript Object Notation (JSON) is adopted. To simplify the code in the created script, the jQuery, a JavaScript function library, was used.
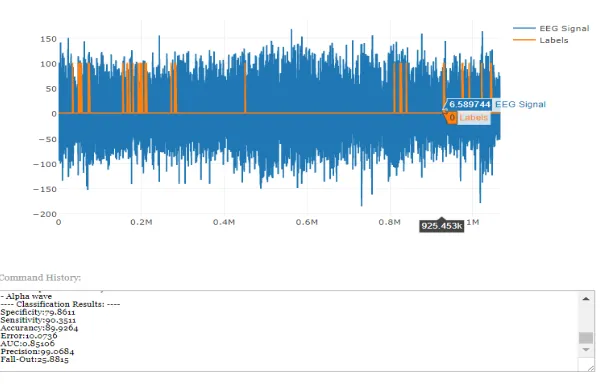
MatCon-soleCtl library, available in Github, is used, which basically allows making calls to Matlab from Java. This library establishes a session with Matlab, allowing the call of certain functions. These functions were developed in simulation mode, with the return values being sent to the client-side. They are then presented as a graph with the EEG signal(s) and the results of the classification, showing the performance of the selected methodology. This mechanism is illustrated, in synthesis, in Figure 3.
Fig. 3. Mechanism describing the operation of the web platform.
2.3 Use of the web platform
In the web platform, the user has the possibility to choose an EEG signal from the available signal set, which can vary in the position(s) and be of different persons. To filter the signal, according to Figure 4, the following parameters/options have to be chosen: the width and the step of the sliding windows; the application of PCA; the application of delay selecting one of 5 different values; and select the classifier.
Fig. 4. Available options for user selection.
3
Results
In this article, the database considered to test and evaluate the application of the methodologies and the use of the web platform was retrieved from Physionet [8], and is titled “The Sleep-EDF Database [Expanded]”. This database consists of 39 poly-somnograms, with an average duration of 20 hours, with the respective hypnograms and annotations of the different sleep stages of healthy individuals. As the intention was to use only EEG signals, the other signals present in the polysomnograms were omitted.
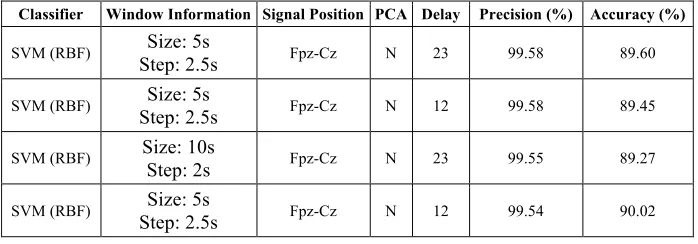
Regarding the different methodologies considered throughout this study, Table 1 shows the results obtained with the best ones. As can be observed, the best results were obtained with the use of delays, specifically with the 23 and 12 combinations, in which the second and third previous epochs, and the past and second previous epochs, respectively, were used. In all cases, classifiers based on Support Vector Machines (SVM) with radial basis function (RBF) kernel were adopted. With these approaches, classifications with about 99.5% of precision and 90% of accuracy were obtained.
Table 1. Best results obtained for the detection of drowsiness.
Classifier Window Information Signal Position PCA Delay Precision (%) Accuracy (%)
SVM (RBF) Step: 2.5sSize: 5s Fpz-Cz N 23 99.58 89.60
SVM (RBF) Step: 2.5sSize: 5s Fpz-Cz N 12 99.58 89.45
SVM (RBF) Size: 10s Step: 2s Fpz-Cz N 23 99.55 89.27
SVM (RBF) Step: 2.5s Size: 5s Fpz-Cz N 12 99.54 90.02
4
Conclusions
This article presents a web-based platform that is the front-end of a system that al-lows the processing and classification of biomedical signals. In this work, the problem of drowsiness detection based on EEG signals was studied, considering the database “The Sleep-EDF Database [Expanded]” from Physionet to compare and evaluate the application of different methodologies for classification purposes. According to the results, classifiers based on SVM with RBF kernel presented the best performance for the detection of drowsiness.
The described web platform provides an alternative environment for the students’ learning process, contributing to better understanding the role of different classifica-tion methods for the processing and analysis of physiological data.
5
References
[1]Driver, R., Leach, J., Scott, P., Wood-Robinson, V. (1994). Young people’s understand-ding of science concepts: implications of cross-age studies for curriculum planning. Stud-ies in Science Education, 24, 75-100. https://doi.org/10.1080/03057269408560040
[2]Rocard, M. (2007). Science education NOW: a renewed pedagogy for the future of Eu-rope. Luxembourg: Office for Official Publications for the European Commission. Availa-ble at: http://ec.europa.eu/research/science-society/document_library/pdf_06/report-rocard-on-science-education_en.pdf.
[3]Cardoso, A., Vieira, M., Gil, P. (2012), A Remote and Virtual Lab with Experiments for Secondary Education, Engineering and Lifelong Learning Courses. International Journal of Online Engineering (iJOE), 8(Special Issue: exp.at’11): 49-54. https://doi.org/10.3991/ ijoe.v8iS2.1984
[4]Sánchez, J., Morilla, F., Dormido, S., Aranda, J., Ruipérez, P. (2002). Virtual and Remote Control Labs Using Java: A Qualitative Approach. IEEE Cont. Syst. Mag. 22 (2): 8-20.
https://doi.org/10.1109/37.993309
[5]Dikke, D., Tsourlidaki, E., Zervas, P., Cao, Y., Faltin, N., Sotiriou, S., Sampson, D. (2014). GOLABZ: Towards a federation of online labs for inquiry based science education at School. Proceedings of the 6th International Conference on Education and New Learn-ing Technologies (EDULEARN2014).
[6]Zacharia, Z.C. (2007). Comparing and combining real and virtual experimentation: an ef-fort to enhance students’ conceptual understanding of electric circuits, Journal of Comput-er Assisted Learning, 23: 120-132. https://doi.org/10.1111/j.1365-2729.2006.00215.x
[7]Colten, HR., Altevogt, BM. (2006). Sleep Disorders and Sleep Deprivation: An Unmet Public Health Problem. Institute of Medicine, National Academies Press (US).
[8]Goldberger AL, Amaral LAN, Glass L, Hausdorff JM, Ivanov PCh, Mark RG, Mietus JE, Moody GB, Peng C-K, Stanley HE. (2000). PhysioBank, PhysioToolkit, and PhysioNet: Components of a New Research Resource for Complex Physiologic Signals. Circulation. 101(23): e215-e220. https://doi.org/10.1161/01.CIR.101.23.e215
6
Authors
Daniel Ribeiro received the M.Sc. degree in Biomedical Engineering from the University of Coimbra, Portugal. (email: [email protected])
César Teixeira received the Ph.D. degree in Electronics Engineering and Infor-matics from the University of the Algarve, and is with the Department of InforInfor-matics Engineering and the Centre for Informatics and Systems of the University of Coimbra (CISUC). (email: [email protected])
Alberto Cardoso received the Ph.D. degree in Informatics Engineering from the University of Coimbra, and is with the Department of Informatics Engineering and the Centre for Informatics and Systems of the University of Coimbra (CISUC). (email: [email protected])