ORIGINAL SCIENTIFIC ARTICLE
Get Rad! The Evolution of the Skateboard Deck
Anna Marie Prentiss&Randall R. Skelton&
Niles Eldredge&Colin Quinn
Published online: 24 June 2011
#Springer Science+Business Media, LLC 2011
Abstract Today there is growing interest in material culture studies among a wide range of social and biological scientists. Researchers recognize that some concepts drawn from biology can be useful in understanding aspects of material culture evolution. Indeed, recent research has demonstrated that material culture can evolve in a branching manner (vertical transmission) similar to that of biological species. However, there are many complicating factors as well, particularly the human penchant for borrowing and resurrecting old ideas resulting in extensive blending and hybridization (lateral transmission). But blending and hybridization occurs in biology as well depending upon the nature and scale of interacting organisms. There is far more lateral information transfer between populations within species than between species (although there are always exceptions). History can also be expected to play a role in the degree to which evolution is affected by vertical versus lateral transmission processes. All things equal, we should expect branching to be most important early in the history of a cultural system since blending could
not become significant without the early development of distinct lineages. This is different from most biological systems in the sense that the development of distinct lineages would significantly reduce (or prevent) opportunities for blending. We explore these ideas with an analysis of skateboard decks spanning the history of professional skateboards since 1963. We apply cladistic and networking models in order to develop an understanding of the degree by which skateboard evolution was affected by branching and blending/hybridization pro-cesses. The study is enhanced by a historical record that provides significant insight into the actual innovation and borrowing processes associated with skateboard evolution. Results confirm that both branching and blending played important roles and that branching was most critical early in professional skateboard history. The study offers the important implication that while cultural systems will typically incorpo-rate far more horizontal transmission in the evolutionary process (particularly in later stages) than many biological systems, general principles governing early stage branching and disparity may apply to both.
Keywords Evolution . Cultural transmission . Cladistic analysis . Skateboard
By 1975 many choices faced the skateboard consumer….The number of choices went from minimal to maximum in a short period of time, something like the Cambrian explosion 540 million years ago with its evolutionary profusion of body types. And like the Cambrian explosion, this spurt of growth and divergent developments went on at a frantic pace for a while and then leveled off, with many species not making it(Weyland2002:36–37).
Skateboarders themselves were the first to recognize the potential evolutionary implications of skateboard history. As chronicled by Weyland (2002) and others (e.g., Brooke A. M. Prentiss (*)
:
R. R. SkeltonDepartment of Anthropology, The University of Montana, Missoula, MT 59812, USA
e-mail: anna.prentiss@umontana.edu
R. R. Skelton
e-mail: randall.skelton@umontana.edu
N. Eldredge
Division of Paleontology,
The American Museum of Natural History, New York, NY 10024, USA
e-mail: epunkeek@amnh.org
C. Quinn
Museum of Anthropology, University of Michigan, 4013 Ruthven Museums Building, 1109 Geddes Ave., Ann Arbor, MI 48109-1079, USA
1999; Goodrich2010) the skateboard deck evolved through a series of divergent forms in a late twentieth and early twenty-first century process at times resembling that of biology. Skateboard history offers significant potential for understanding the operation of critical processes associated with generation of variation and its evolution through time leading to the formation of evolutionary lineages. Skateboard design history is well known, providing scholars with the ability to identify innovations and borrowing of ideas in creation of new designs. Skateboards have also been subject to an evolutionary process that replicates evolution by natural selection in that the users of skateboards receive feedback on the utility of particular designs, which can come in the form of a great ride or scrapes and contusions. Functional design characteristics in skateboards, as is the case with any such character in technology or biology, could evolve through a process of tinkering to make improvements to enhance safety and performance. Highly effective designs could thus achieve equally high degrees of replicative success, while poor designs could just as easily be cast aside (or sorted out).
The simple model of innovation and selection only partially describes the evolutionary process, particularly as applied to human artifacts like skateboards. If innovation and selection alone characterized cultural evolution then cultural histories could always be depicted as simple branching trees. The human penchant for imitation and borrowing however leads to the possibility of significant complexity in cultural evolutionary history. Some anthro-pologists argue that cultural evolution is simply too complex to even be modeled using the branching tree metaphor, favoring instead a blending process as depicted by the braided stream image of ethnogenesis (Moore1994). The contrasting branching tree versus braided stream models have been tested in a number of studies (e.g., Jordan and Shennan2009; Tehrani and Collard2002,2009) resulting in the conclusion that there is evidence for both branching and blending in cultural lineages. However, the extent to which each is manifested appears to vary highly between different artifact histories (e.g., Tëmkin and Eldredge 2007) and geographic–social contexts (Tehrani and Collard 2009; Tehrani et al. 2010). There has been relatively little study of variability in branching versus blending processes through time within artifact lineages. Research by Eldredge (2009) suggests that not only could these processes vary in their effects over time but that extra-cultural factors ranging from innovations in related technologies to changing cultural preferences could also have impacts on the evolution of particular artifact designs.
Our study of skateboard deck evolution permits us to address a number of fundamental problems in material culture evolution. First, we assess the pattern of evolution asking if, as observed by Weyland (2002), skateboards diversified early followed later by a sorting out of less
effective or popular designs—a pattern widely recognized in paleobiology (e.g., Gould 1989) and archaeology (e.g., Prentiss and Chatters 2003). Second, we test for branching and blending in skateboard evolution with the expectation that given high degrees of social interactions between skateboard designers and skaters, blending should play a significant role in the evolutionary process. Finally, we examine the effects of external factors such as changing economic conditions and technological innovations on rates of branching and blending in skateboard history. This permits us to address interesting questions concerning underlying conditions favoring variability in rates of innovation and borrowing. Ultimately, this is a“proof of concept”study that demonstrates the validity of using phylogenetic analysis to understand artifact evolution. We start with a class of artifacts with a well-understood history and then seek to replicate that history using our phylogenetic approach. Thus our work differs from many phylogenetic studies that attempt to reconstruct previously unknown evolutionary histories. We believe that the paper offers some unique insights into the evolutionary process and it provides opportunities for teachers to engage students with evolutionary questions using a very familiar element of modern material culture.
Skateboard History
Skateboard history is chronicled through a series of boom and bust periods. Booms are associated with significant popularity and associated commercial sales of skateboards. Bust periods tend to correspond with decline in interest and subsequent sales. The first skateboard boom in 1963–1965 followed a lengthy initial gestation period that featured exploration of the potential for riding a piece of wood with mounted roller skate assemblies (see Figs. 1 and2 for key skateboard terms). In 1963, Larry Stevenson was the first to develop what was widely considered to be a professional skateboard (the Makaha Phil Edwards model, named for the prominent surfer Phil Edwards) featuring a wooden deck shaped loosely like a miniature surfboard, Chicago trucks, and clay wheels. During the first boom other manufacturers explored alternative materials for board construction, the most famous of which was the Gordon and Smith
Fig. 1 Skateboard diagram with labels of parts
Skateboard historians (Brooke 1999; Weyland 2002) generally agree it was not innovation to the skateboard deck the triggered the second boom. Rather, it was the invention of a key innovation, the urethane wheel, by Frank Nasworthy in 1972 and its ready acceptance by a population of skaters and surfers in southern California. The urethane wheel permitted the rider to move far faster in a more controlled manner on varied terrain and it was far safer, meaning that it did not automatically stop cold upon encountering a small rock or other obstruction (and thus launching the rider). Innovations in urethane resulted in softer wheels for street racing and hard wheels for wall riding. Shortly after the innovation of urethane wheels, the first professional“high performance”trucks were debuted by Ron Bennett in 1973 offering greater height between the board and the ground as well as a far greater degree of maneuverability compared to the old Chicago trucks that had been originally designed for roller skates.
With the innovations of kicktail boards, urethane wheels, and high performance trucks, skateboarders had the tools to take the sport in new directions. This was facilitated by two developments in southern California unrelated to skate-boarding. First, delayed development of housing tracts in hilly La Costa provided a mecca of freshly paved roads and sidewalks for skateboarders interested in downhill and slalom racing. Second, and perhaps more importantly, the regional drought of 1975 and 1976 provided a nearly endless array of terrain ranging from drainage ditches and spillways to empty swimming pools for those willing to find a way to get into these places. By 1977, skateboarding had branched into four distinctive pursuits: downhill, slalom, freestyle, and bowl or wall riding. For maximum performance, particularly at the emerging professional levels, each required specially designed boards. Downhill required long boards (greater than 36 inches in length) generally without kicktails given the goal of maximum speed and stability. It is not clear who first developed the long board though Tom Sims is often given credit for early experiments adapting long boards from water skis (Brooke 1999). Slalom required speed and maneuverability (much like the requirements for slalom skiing), favoring shorter boards than those used for downhill racing and very narrow ends to avoid wheels rubbing the base of the deck during sharp turns. While many riders and manufacturers explored slalom designs in the mid-1970s, Turner Summer Ski is typically given significant credit for innovations (Goodrich 2010) that included not only board shape but also development of cambered design (Fig. 2) to permit maximum flex for pumping through slalom courses.
Bowl/wall riding took off in the mid-1970s and several manufacturers quickly sought to capitalize. Innovations in deck design including kicktails originally associated with Larry Stevenson and Makaha and“rocker”shapes (loosely
the inverse of cambered designs) innovated in 1973 by Zephyr and Z-Flex had already enhanced the ability of skaters to perform on steep terrain. In 1977, Gordon and Smith (G&S) added to these designs with new lines of somewhat wider and longer boards including the G&S Bowl Rider and shortly later, the Warptail. The Warptail was part of a new wave of boards that included the innovation of maple laminate construction likely from Canadian skater and board maker,“Wee”Willie Winkels, which reduced the weight of the board while maintaining some limited flex. The first bowl rider boards ranged in width up to around eight inches, but this was not to last for very long. By 1978, skaters and manufacturers from Santa Monica, California (especially Tony Alva) introduced the first“pig”boards (ten plus inches in width), offering maximum stability and hold for feet during vertical wall riding (as in empty pools and skateparks). Some manufacturers explored a concave deck surface (Fig.2) for maximum foothold.
Meanwhile, freestyle boards, designed for doing tricks on flat ground, did not significantly change from designs in use during the early 1970s. Riders still preferred a smallish board, with a kicktail to facilitate rapid board movement in tricks like “walk the dog,” “Casper Disaster,” and “360s.” Minor changes included develop-ment of wider noses (compared to early generic board designs from the 1960s and early 1970s), occasional double (front and back) kicktails, and use of maple laminate manufacturing materials.
concave surfaces, and occasional double kicktails. Finally, the post-1999 period can also be described as one of skateboard nostalgia where manufacturers reissued many classic designs going back to the early 1970s (e.g., the Z-Flex Rocker and the Logan Earth Ski Bruce Logan).
Methods and Materials: Documenting and Explaining Variability in Skateboard Decks
The historical record suggests that while skateboard deck designs diversified via a range of innovations during the second boom of the 1970s, later developments were probably more heavily conditioned by borrowing of older design elements. Despite the incredible rate of innovation during the 1970s it is also clear that there was a high degree of interaction between skateboarders and skateboard designers suggesting that borrowing and blending of ideas could have played critical roles even during the second boom. It also undoubtedly true that given the large number of independent designers and makers of skateboards (from corporations to the skater in his backyard woodshop), Eldredge’s (2006) “Hannah” principle asserting indepen-dent solutions to common problems, probably operated in many places. We can test for the effects of innovation/ branching versus borrowing/blending by using quantitative methods drawn from evolutionary biology. More specifi-cally, we apply cladistic and network analyses to skateboard deck data.
Cladistic approaches to evolutionary analysis seek to capture patterns of character states among a set of taxa that were created by descent with modification from ancestors through time (Freeman and Herron2007). Character states are alternative forms of some characteristic. Taxa are the objects or groups under investigation and may be actual biological taxa or other objects such as skateboards. Cladistic methods produce output in the form of a tree, which is the expected outcome of phylogenetic evolution. Since the phylogenetic signal is produced only by descent with modification from ancestors, none of the branches may reticulate (rejoin each other) after splitting. The type of tree produced can be described as a cladogram, which is defined as a tree that depicts all taxa as having evolved from common ancestors (sisters) with no taxon in the analysis being considered the ancestor of any other (Semple and Steele2003).
Three approaches to cladistic analysis are generally recognized, parsimony analysis (PA), maximum likelihood, and distance methods (Kitching et al. 1998). The PA approach is to find the shortest tree (i.e., the one involving the fewest evolutionary innovations and character state transitions, which is therefore most parsimonious) among all possible trees that can explain the distribution of
character states among the taxa being considered. Maxi-mum likelihood methods utilize Bayesian statistical princi-ples and generally ask the question of what is the most likely evolutionary scenario to explain the distribution of character states among the taxa. Distance methods involve calculating the distances between the taxa and subsequently grouping them together into a tree based on these distances. Parsimony methods require non-metric data, though metric data can always be coded in some non-metric fashion and several methods for doing so exist. Maximum likelihood and distance methods can be used with any type of data.
In addition to the phylogenetic signal there may be one or more tokogenetic signals that are patterns that result from lateral transfer of character states through borrowing, admixture, or similar processes (Doyle 1997). It is important to distinguish tokogenetic processes from homo-plasy, which consists of convergence (independent evolu-tion or invenevolu-tion) and reversal (evoluevolu-tion of a character state followed by its reversion to a previous state). In particular, borrowing and convergence may produce similar patterns of character states but the mechanisms by which these patterns are produced are significantly different. Tokogenetic signals are captured and displayed using a network type of graph, which allows reticulations that represent the patterns of similarities produced by tokoge-netic events.
PA is the most popular, and is arguably considered the standard form of cladistics analysis. An advantage of parsimony analysis is that the efficiency of a given cladogram in explaining the distribution of the character states can be estimated using a variety of metrics. The consistency index (CI) is defined as the sum over all characters ofm/s, wheremis the minimum number of state changes for that character andsis the number of character state changes for that character required by the cladogram (Kitching et al. 1998). CI gives a score that ranges from zero to one, with one representing a cladogram that explains the evolution of the character states through time with an absolute minimum of steps. Other related metrics can be calculated as well, including the homoplasy index (HI), which is one minus CI.
most theoretically similar to PA in that it seeks to capture the phylogenetic signal by finding the cladogram with the shortest summed distances over all the branches (Saitou and Nei1987). An advantage of the NJ method over PA is that only a single tree is produced, avoiding the necessity of finding a consensus cladogram. The neighbornet (NN) method (Bryant and Moulton 2004) is based on a mathematical algorithm similar to NJ, but seeks to capture both the phylogenetic and tokogenetic signals in a network. Using the pairing of NJ with NN allows direct comparison of the reconstructed phylogenetic signal and the recon-structed combination of phylogenetic and tokogenetic signals. This should allow periods of less borrowing and periods of more borrowing in the evolution of skateboards to be identified.
Materials for our analysis are derived from a sample of 17 skateboard decks reflecting the major developments on deck technology from 1963 through the 2000s (Table1). As such we included early flat boards (Makaha Phil Edwards,
G&S Fibreflex, G&S Fiberglass), an early kicktail model (Hang Ten Aluminum), earlier bowl rider boards (Logan Earth Ski Bruce Logan, G&S Bowl Rider, Alva Logo), later bowl riders (Alva Pig, Skull Skates Hosoi Hammerhead), downhill and slalom boards (Turner Summer-Ski, Tunnel Competition, BC Pintail 39), a freestyle board (Powell-Peralta Rodney Mullen), early street/bowl boards (Z-Flex Rocker, Santa Cruz 5-Ply), and late street/bowl boards (Arbor Rail, Skull Skates Soup Can). Due to requirements of our quantitative models, we used non-metric variables to describe the form and raw material associated with each board (Table1).
Skateboard Deck Evolution
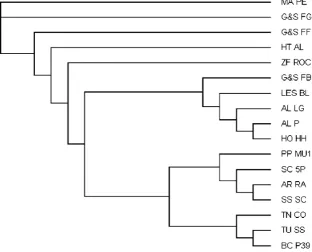
In our first analysis we performed PA and NJ to find cladograms representing the phylogenetic signal using PAUP 4.b10 for DOS (Swofford 1998) and PaupUp (Calendini and Martin 2005), choosing the Branch and Bound algorithm for tree searching and the 50% rule for finding a consensus cladogram (Figs. 3 and 4). We rooted each tree with the Makaha Phil Edwards board and results of each tree were very similar. However, the NJ tree appears to best reflect our current knowledge of skateboard design history. The G&S Fiberglass, Fibreflex, Hang Ten Alumi-num, and Z-Flex Rocker boards branch from the Makaha Phil Edwards base much as we know occurred in actual history. Then we recognize three clades (clusters), the bowl rider group, the street/bowl group, and the downhill/slalom group. The single freestyle board (PP-MU1) falls within the street/bowl group but close to the bowl riders, which is not surprising given its generic design. The position of the street/bowl group between the bowl riders and downhill/ slalom boards is probably significant as an indicator of the potential importance for blending inheritance in these designs.
In order to estimate the potential effects of blending in the PA cladogram we examined the CI and a HI based upon the results of the parsimony cladograms. The CI is the primary measure of how well a parsimony tree fits the pattern of evolution of characters. Precisely, it is the ratio of the number of characters in the data set to the length of the tree (the number of evolutionary trans-formations required by the tree). A tree with no homoplasy or blending would have a C.I. of 1.0; a tree with twice as many steps as needed to straightforwardly evolve the characters under pure descent with modifica-tion would have a CI of 0.5. The consensus of five equally parsimonious trees all with length = 69 (i.e., it took 69 steps to evolve 28 traits) provides a CI of .406. This is a relatively low score suggesting that blending likely does play a significant role. The Homoplasy Index, Table 1 Sample of skateboard decks and associated attributes (deck
name, deck name code, date of first manufacture, binary code: length <28 inches, length 28–34 inches, length >34 inches, width less than seven inches, width seven to nine inches, width greater than nine inches, nose length less than four inches, nose length four plus inches, tail length less than four inches, tail length four plus inches, standard kicktail, rocker, front kicktail, concave deck, camber, maximum width tail, maximum width center, maximum width front-center, minimum width nose, minimum width ends, wheel wells, material hard wood, material fiberglass, material fiberglass laminate, material wood laminate)
Makaha Phil Edwards (MA_PE) 1963
1001001010000000101001000
G&S Fiberglass (G&S_FG) ca. 1970–1974
1001001010000000100100100
G&S Fibreflex (G&S_FF) 1964/ 1974
1001001010000000011000011
Hang Ten Aluminum (HT_AL) ca. 1970–1974
1001001001101000011000000
Z-Flex Rocker (ZF_ROC) 1976 1000101001010000011000100 Turner Summer Ski (TU_SS) 1975 0100101010000010100100001 Tunnell Competition (TN_CO) 1976 0010101001000110101000001 BC Pintail 39 (BC_P39) post-2000 0010101010000100100100001 Powell-Peralta Rodney Mullen
(PP-MU) ca. 1980
1000100101100000101000001
Logan Earth Ski Bruce Logan (LES_BL) ca. 1974
0100101001100000101001000
G&S Fibreflex Bowl Rider (G&S_FB) 1977
0100101001100000011000011
Alva Logo (AL_LG) 1977 0100101001100000011010001 Alva Pig (AL_P) 1978 0100011001100001001010001 Skull Skates Hosoi Hammerhead
(HO_HH) 1985
0100011001100101001000001
Santa Cruz 5-Ply (SC_5P) ca. 1977 0100100101010000011000001 Arbor Rail (AR_RA) post-2000 0010100101100000010100001 Skull Skates Soup Can (SS_SC)
ca. 1991–1992
which is one minus CI, indicates the potential for homoplasies in the cladograms. What this actually means is that the index looks for degree of influence of evolutionary similarities deriving from parallel evolution,
convergence through different evolutionary pathways, and potentially, character state reversal (O’Brien and Lyman 2003). However, cultural borrowing and blending could produce the same data patterns in artifact histories as
Fig. 4 PAUP neighbor-joining tree
homoplasy thus making true homoplasy indistinguishable from borrowing. Our calculation returned a score of .594 that can be interpreted as there being 59.4% homoplasy in these characters or more homoplasy (and/or borrowing) that what would be expected in pure phylogenetic evolution.
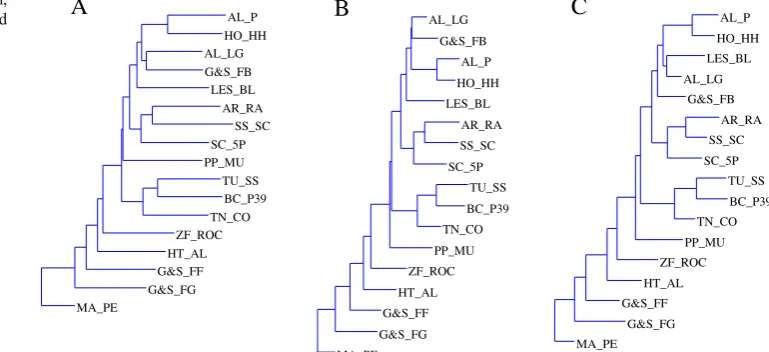
Next, we used PAST version 2.04 (Hammer et al.2001) to produce NJ phylograms (Fig. 5). A phylogram differs from a cladogram in that the lengths of the branches reflect the distances assigned to the branch, whereas a cladogram assigns equal distances to all branches. For NJ, PAST offers five distance measures that are optimized for binary data. When using the five binary distance measures plus Euclidean, there are three very similar phylograms pro-duced. Euclidean and Jaccard distance give a phylogram that is not the same as the PAUP NJ cladogram. The basic outline is the same, but the details of the clades higher up the tree are slightly different. Dice, Kulzcynski, and Ochiai distance all agree on a second phylogram that differs from the Euclidean/Jaccard phylogram only in the placement of the Powell-Peralta Rodney Mullen. Simpson distance gives a third phylogram that is similar to the Dice/Kulzcynski/ Ochiai phylogram except for the placement of Logan Earth Ski Bruce Logan, Alva Logo, and G&S Fiberglass, which are in the same clade but rearranged somewhat. Overall, we think the Euclidean and Jaccard distance phylogram provides the best approximation of skateboard evolution so far since it clearly subdivides the four distinct groups (the bowl, street/bowl, freestyle, and downhill/slalom boards) and appropriately places the Powell-Peralta Mullen board close to the street/bowl group.
Despite some variation, the cladograms and phylograms produced quite similar results identifying distinct groups of boards. This implies that skateboard evolution must have included some critical innovation and branching. Yet, we also know that the evolutionary process must have included a high degree of borrowing/blending of ideas. The next
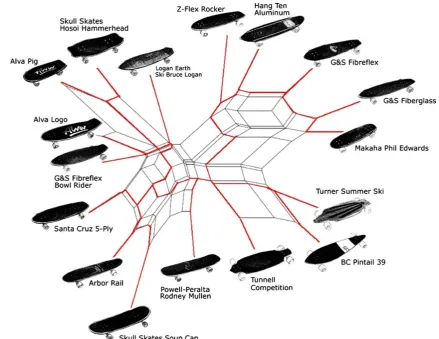
question therefore is did the rate of borrowing vary over time and with different groups of boards? To explore this question we produced a network plot (Fig.6) using the NN technique (Bryant and Moulton2004) and performed using SplitsTree4 (Huson and Bryant 2006). As noted by Jordan (2009), where the neighbornet plot closely resembles a tree diagram we can conclude that phylogenesis (branching) has been the primary mode of evolution. In contrast, if the plot is complex with many linkages between members produc-ing complex box-like shapes, then we can conclude that horizontal borrowing/blending played a stronger role. The complex form depicted in Fig. 6 clearly illustrates a high degree of borrowing in skateboard evolution. Interestingly, the plot identifies four clusters of boards including the early models (Makaha Phil Edwards through Z-Flex Rocker), the downhill/slalom group (lower right), the bowl rider group (upper left), and a street/bowl/freestyle group (lower left). Each cluster illustrates a pattern of networking that is particularly strong for the street/bowl/freestyle group and secondarily, the early group.
We can gain a better understanding of the relationship between the pattern produced by phylogenetic evolution and borrowing by superimposing the results of our favored phylogram (Euclidean, Jaccard distance) on the network plot by plotting the shortest links between nodes while replicating the basic branching structure from Fig.5a. The resulting plot (Fig. 7) supports the idea that the bowl rider and downhill slalom groups branched with the least blending, whereas the generally later street/bowl group along with the single freestyle board evolved through a process that included far more extensive borrowing of ideas. The earliest period of skateboard development likely also included some degree of borrowing. However, the substantial separation of some boards may also imply independent solutions to some problems, as is the case, for example, with the unique“rocker”shape associated with the Z-Flex Rocker board.
A
AL_PB
C
HO_HH AL_LG G&S_FB LES_BL AR_RA SS_SC SC_5P PP_MU TU_SS BC_P39 TN_CO ZF_ROC HT_AL G&S_FF G&S_FG MA_PE AL_LG G&S_FB AL_P HO_HH LES_BL AR_RA SS_SC SC_5P TU_SS BC_P39 TN_CO PP_MU ZF_ROC HT_AL G&S_FF G&S_FG MA_PE AL_P HO_HH LES_BL AL_LG G&S_FB AR_RA SS_SC SC_5P TU_SS BC_P39 TN_CO PP_MU ZF_ROC HT_AL G&S_FF G&S_FG MA_PE
Discussion
We are able to draw a number of conclusions and implications from this study. First, our assessment of the historical record and subsequent quantitative analysis confirms the conclusions of earlier skateboard historians (Weyland2002) that in the most macroevolutionary sense, skateboard evolution did loosely parallel that of many biological sequences. Following a long period of limited change there was a short-lived period where under optimal conditions, a radical diversification process produced a disparity in skateboard designs that was subsequently cut back as access to resources (sales) declined and conditions grew more competitive. Our quantitative analysis confirms that the disparity in designs during the second boom was driven in part, if not substantially, by a macroevolutionary branching process. Second, it is also clear that unlike biological evolution, blending processes acted throughout the sequence, indeed becoming stronger during and after the second boom period. Thus, unlike biology, greater variation in “species” does not reduce the possibility of blending, but actually increases it. Third, although some
innovation appears to have occurred during boom and bust periods, the highest rate of innovation (leading to branching and formation of clades) occurred during the second boom period and was apparently conditioned by the convergence of optimal economic conditions and development of key innovations independent of skateboard decks (e.g., urethane wheels). Interestingly, cultural processes associated with branching during the second boom occurred largely within a single area of North America (southern California). New board designs during the post third boom period depended less upon true innovation than on extensive borrowing (e.g., popsicle stick boards). Finally, as has been recognized elsewhere for other technological systems (Chatters 2009; Eldredge 2009), “sleeper” technologies and historical contingency played a role in skateboard evolution.
several thousand years and abruptly became highly com-mon under 4,000 years ago. Eldredge (2009) offers a similar example using cornets in the nineteenth and early twentieth centuries.
Materials like fiberglass and wood laminates and design elements like front kicktails had been around for some time before their common use in skateboard manufacture during the second and third boom periods. As long as professional skateboarding was dominated by flatland free styling, favoring what were essentially gymnastics (handstands, leaps, etc.) on moving boards, there was little call for development of technologically sophisticated board designs. A flat piece of hard wood would work just fine. This came to a sudden end when in 1975 the Zephyr skate team of Santa Monica swept into the Del Mar Nationals changing forever the face of skateboarding and truly ushering in the second boom. For the coming decades skaters would no longer represent themselves as clean cut athletes but as outlaws styling on high tech designs and engaging in pursuits unimaginable to the rest of the general public. It is striking that even skaters, with their active counter-culture identities and perhaps anti-school
mentali-ties, may find themselves at the center of a scientific case study as real world participants in material culture evolutionary processes.
Acknowledgments We thank Eric Carlson for his excellent skate-board depictions and for his help in designing Figs.1,2, and7. We also thank two anonymous peer reviewers for their helpful comments on the manuscript. Finally, we thank those generations of skaters and skateboard designers whose“get rad”exploits unintentionally provid-ed us with such a wonderful source of data for evolutionary analysis.
References
Brooke M. The concrete wave: the history of skateboarding. Toronto: Warwick Publications; 1999.
Bryant D, Moulton V. Neighbornet: an agglomerative method for construction of planar phylogenetic networks. Mol Biol Evol. 2004;21:255–65.
Calendini, F., Martin J.-F. PaupUP v1.0.3.1 A free graphical frontend for Paup* Dos software 2005. http://www.agro-montpellier.fr/ sppe/Recherche/JFM/PaupUp/main.htm.
Chatters JC. A macroevolutionary perspective on the archaeological record of North America. In: Prentiss AM, Kuijt I, Chatters JC, editors. Macroevolution in Human Prehistory: Evolutionary Theory and Processual Archaeology. New York: Springer; 2009. p. 213–34.
Doyle JJ. Trees within trees: genes and species, molecules and morphology. Syst Biol. 1997;46(3):537–53.
Eldredge NF. In: Lipo C, O’Brien MJ, Collard M, Shennan SJ, editors. Mapping our ancestors: phylogenetic approaches in anthropology and prehistory. New Brunswick: Transaction Publishers; 2006. p. xiii–xvi. Eldredge N. Material cultural macroevolution. In: Prentiss AM, Kuijt I, Chatters JC, editors. Macroevolution in human prehistory: evolutionary theory and processual archaeology. New York: Springer; 2009. p. 297–316.
Freeman S, Herron JC. Evolutionary analysis. 4th ed. San Francisco: Pearson Benjamin Cummings; 2007.
Goodrich, J. Skateboard history time line—1920s to 2010. http:// jimgoodrich.net/skateboardtimeline.htm. 2010.
Gould SJ. Wonderful life: the burgess shale and the nature of history. New York: W.W. Norton and Co.; 1989.
Hammer, Ø., Harper, D.A.T., Ryan, P. D. PAST: Paleontological Statistics Software Package for Education and Data Analysis. Palaeontologia Electronica 2001; 4(1): 9 pp. http://palaeo-electronica.org/2001_1/past/issue1_01.htm.
Huson DH, Bryant D. Application of phylogenetic networks in evolutionary studies. Mol Biol Evol. 2006;23(2):254–67. Jordan P. Linking pattern to process in cultural evolution: investigating
material culture diversity among the Northern Khanty of Northwest Siberia. In: Shennan S, editor. Pattern and Process in Cultural Evolution. Berkeley: University of California Press; 2009. p. 61–84.
Jordan P, Shennan S. Diversity in hunter–gatherer technological traditions: mapping trajectories of cultural‘descent with modifi-cation’ in Northeast California. Journal of Anthropological Archaeology. 2009;28:342–65.
Kitching IJ, Forey PL, Humphries CJ, Williams DM. Cladistics: the theory and practice of parsimony analysis. 2nd ed. Oxford: Oxford University Press; 1998.
Moore JH. Putting anthropology back together again: the ethnogenetic critique of cladistic theory. American Anthropologist. 1994;96:925–48.
O’Brien MJ, Lyman RL. Cladistics and archaeology. Salt Lake City: University of Utah Press; 2003.
Prentiss WC, Chatters JC. Cultural diversification and decimation in the prehistoric record. Curr Anthropol. 2003;44:33–58. Saitou N, Nei M. The neighbor-joining method: a new method for
reconstruction of phylogenetic trees. Mol Biol Evol. 1987;4:406– 25.
Semple C, Steele M. Phylogenetics. Oxford: Oxford University Press; 2003.
Swofford DL. PAUP*: Phylogenetic Analysis Using Parsimony (and Other Methods) Sunderland. MA: Sinauer Associates; 1998. Tehrani J, Collard M. Investigating cultural evolution through
biological phylogenetic analyses of Turkmen textiles. Journal of Anthropological Archaeology. 2002;21:443–63.
Tehrani J, Collard M. The evolution of material culture diversity among Iranian tribal populations. In: Shennan S, editor. Pattern and Process in Cultural Evolution. Berkeley: University of California Press; 2009. p. 99–112.
Tehrani JJ, Collard M, Shennan SJ. The cophylogeny of populations and cultures: reconstructing the evolution of Iranian tribal craft traditions using trees and jungles. Philosophical Transactions of the Royal Society B. 2010;365:3865–74.
Tëmkin I, Eldredge N. Phylogenetics and material cultural evolution. Curr Anthropol. 2007;48:146–54.