First order dynamics approaching of broiler chicken deep body
temperature response to step changes in ambient temperature
Takoi K. Hamrita
1*,
Richard H. Conway
2(1.College of Engineering, University of Georgia, Driftmier Engineering Center, Athens, Georgia 30602, USA; 2. United Technologies Corporation 700 Olympic Dr. Athens, GA 30601, USA)
Abstract: Traditional environmental control methods for poultry housing which rely solely on environmental factors fall short
in meeting thermal and physiological needs of the animals. New methods are needed that factor in the physiological needs and responses of the animals in order to maximize well-being of the animals and minimize heat stress. Deep body temperature (DBT) has been shown in the literature to be a strong indicator of heat stress, therefore studies are needed that help us gain a deeper understanding of the relationship between this variable and environmental conditions. The aim of this study was to identify the order of the dynamic response of poultry DBT to large step changes in ambient temperature (AT). Temperature steps had to be big enough to take the chickens out of their homeothermic zone. A total of 46 DBT/AT data sets with 23 upward AT steps and 23 downward AT steps were obtained using a biotelemetry system, and involving three chickens. DBT responses of individual chickens to step changes in AT were found to have a 0.88 average Pearson correlation suggesting consistency in chickens’ responses to the same stimuli (p<0.0005). The data indicated that DBT responses to AT followed a first order behavior in most cases with an average time constant of 1.6 h, and the curve fitting method was used to validate this observation. There was a 0.88 average correlation between DBT model and measured data (p<0.0005). These results indicate statistical significance in the data used and the model derived from it. In conclusion, it is reasonable to assume that the dynamic response of poultry DBT to large step changes in ambient temperature follows a first order model. Although further studies are needed to more fully derive the model, this study provided a stepping-stone towards gaining a better understanding of the relationship between DBT and AT, therefore taking us one step closer towards making optimal management and risk assessment decisions that are based on physiological needs of the chickens.
Keywords: environmental control, ambient temperature, deep body temperature, biotelemetry, step response, dynamic
modeling, broiler chicken, physiological responses
DOI: 10.25165/j.ijabe.20171004.2336
Citation: Hamrita T K, Conway R H. First order dynamics approaching of broiler chicken deep body temperature response to
step changes in ambient temperature. Int J Agric & Biol Eng, 2017; 10(4): 13–21.
1 Introduction
Physiological responses of animals to environmental stimuli provide a much-needed insight into how well chickens are coping with stressful conditions. Modeling
Received date: 2016-01-05 Accepted date: 2016-10-17
Biographies: Richard H. Conway, Engineer. Email:
*Corresponding author: Takoi K. Hamrita, PhD, Professor, research interests: embedded systems, precision agriculture. School of Electrical and Computer Engineering. College of Engineering, University of Georgia, Driftmier Engineering Center, Athens GA 30602. Tel: +1-706-542-1973, Fax: +1-706- 542-8806, Email: [email protected].
such responses not only presents an invaluable tool for predicting behavior to environmental stimuli, therefore informing management and risk assessment decisions, but it also offers a unique opportunity to design model-based environmental controllers that respond directly to real-time physiological needs of the chickens. Control of poultry housing environmental conditions using physiological responses from the chickens is an exciting
new direction in poultry management research[1].
Hamrita et al.[2] highlighted the limitations of current
poultry environmental control practices and called for new research and practices that incorporate physiological
research opportunities in environmental control of confined animal housing systems through what they referred to as precision livestock farming. This term was used to imply that the use of continuous and automatic monitoring of physiological behavior among other things, contributes to more precise assessment and management of the animals’ wellbeing. Moreover,
Fournel et al.[4] presented a critical review of the state of
the art of precision environment control of livestock buildings, identifying knowledge gaps, research
opportunities and technical challenges. Hamrita et al.[5]
highlighted advances in biotelemetry, which make it possible to monitor chickens physiological responses in real-time for the purposes of modeling and control.
Sellier et al.[6] reviewed methods to monitor animal body
temperature in precision farming due to the importance of
this variable. Hamrita et al.[7] investigated the use of
variable air velocity for closed loop control of poultry deep body temperature. Studies, which examine and model the dynamic impact of environmental conditions on chickens’ physiological responses such as deep body temperature and heat production are a prerequisite for developing physiologically responsive dynamic control systems. In particular, model-based control schemes often require compact mathematical models to predict the
dynamic process response to the controller[8].
Several studies have been reported in the literature on real-time monitoring of dynamic physiological responses
of poultry such as DBT[9-13], heat production[14,15] and
heart-rate[16,17], to changes in ambient stimuli, such as
light, humidity and AT. Fewer studies have gone as far as modeling physiological responses to environmental
stressors. Nascimento et al.[18] developed mean surface
temperature prediction models for broiler chickens. But of particular interest to our study is the research
conducted by Aerts et al.[8,14,15] in modeling poultry heat
production. Aerts et al.[8] identified the order of the
dynamic heat production response of broiler chickens to step changes in temperature and light intensity concluding that it was a first order response. Moreover,
Aerts et al.[15] studied the dynamic and static responses of
total heat production of broiler chickens to step changes in temperature and light intensity using a dynamic first
order transfer function model. The static response was quantified by means of the steady state gain. The dynamic response was quantified by means of a time
constant. In a later study[4], the same group further
explored dynamic data-based modeling of heat production and growth of broiler chickens for the purposes of developing an integrated poultry process management system.
The study described in this paper is part of a long-term research project aimed at developing the next-generation poultry environmental controller, which integrates chickens’ physiological responses into the control process. Of particular interest is the use of real-time measurements of DBT responses to ambient conditions as a feedback variable to the controller. A
preliminary PID-type controller was developed[7] to
adjust ambient conditions with the goal of maintaining DBT below a set-point. This controller was based strictly on real-time measurements of DBT and ambient conditions, and although the results were promising, the controller was unstable. In order to improve process control, it is necessary to develop dynamic models that
correlate DBT measurements with ambient conditions[8,19].
Such models would be used to anticipate future process response to control actions, therefore optimizing current and future process behavior. This type of controller is called model predictive controller (MPC) and it relies on empirically developed compact mathematical models
developed through system identification[8]. The current
study is concerned with modeling the dynamic response of DBT to large step changes in AT as an essential step towards integrating DBT into the controller. In particular, the study presents an empirical approach for identifying the order of dynamics that govern the relationship between the two variables. To our knowledge, this study is the first of its kind to model DBT and to suggest that a first order dynamic model represents a good approximation of poultry dynamic DBT responses to large step changes in AT.
2 Materials and methods
July, 2017 Hamrita T K, et al. Approaching of chicken deep body temperature response to ambient temperature Vol. 10 No.4 15
that responds directly to physiological needs of the chickens. The experimental setup and preparation of subjects have been described in detail in a previous
study[7] and are summarized here for completeness of this
paper.
2.1 Care and maintenance of the animals
In this study, three commercial breed broilers acquired at 21 d of age were used. Throughout the duration of the experimental period, chickens were kept in an environmentally controlled experimental chamber initially at kept 25°C-28°C, and then temperature was dropped to 19°C-22°C as the chickens aged. Lights were controlled on a 12 h cycle. The supplied feed mix was poultry crumble, with a manufacturer published minimum of 16% protein and 3% fat. A 2 m long
Ziggitty Poultry Systems (Ziggitty Poultry Systems,
Middlebury, IN 46540, USA) nipple-drinking pipe was
used to provide access to water ad-libitum. Food was also provided ad-libitum. During experiments, chickens were housed in individual wire cages. Between experiments, chickens were housed together in an
uncovered pen of approximately 3 m2.
2.2 Biotelemetry
The biotelemetry system was acquired from Data Sciences International (DSI, Data Sciences International, St. Paul, MN 55126, USA) and was used to monitor DBT of the chickens. The system consisted of sensor implants (TA11CTA-F40) with a 0.1°C accuracy, a receiver for each implant, a data exchange matrix, and the data acquisition computer. The data exchange matrix/data acquisition system recorded the data from
the receivers as well as AT and filtered out noise. At 24 d old, the chickens were implanted with the DBT sensors under veterinary supervision following UGA-IACUC approved Animal Use Protocol (AUP A200210087). The implant was inserted into the peritoneal cavity.
2.3 Experiments and data collection
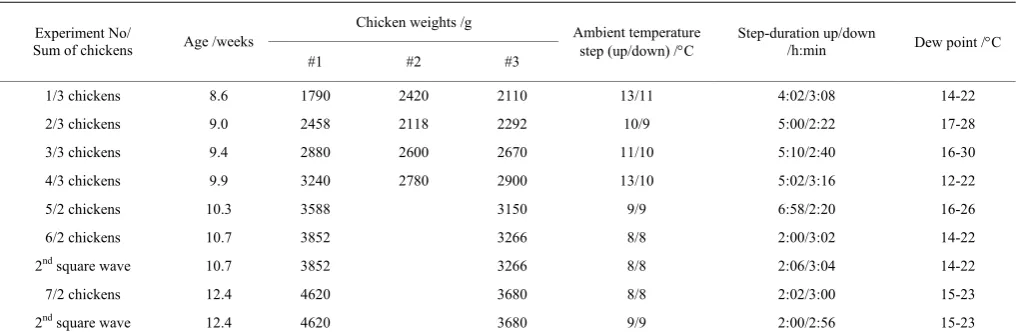
Chickens were given a week to recover from surgery, then the following three weeks were spent evaluating the biotelemetry system and determining ambient conditions that caused a significant DBT response in the chickens. Beginning at 8.6 weeks of age, seven consecutive experiments were conducted over the span of 5 weeks using the three chickens initially, and then two chickens after one died, possibly due to low tolerance for heat stress. In each experiment, chickens were heated using a square pulse of AT averaging approximately 10°C and lasting for at least 2 h. The large size of the step was selected to drive the chickens out of their homeothermic zone. Table 1 summarizes the test conditions for each experiment. DBT, AT, and relative humidity were monitored continuously and recorded every 2 min. AT measurements were noisy and showed small fluctuations about AT values. Figure 1 shows an example of such a pulse compared to an ideal pulse. In order to make the trends in DBT more evident, data were smoothed using a moving average of 9 values (3% of the total data). Moreover, erroneous measurements were eliminated using an error detection algorithm. The experiments have led to a total of 46 DBT/AT data sets with 23 upward AT steps and 23 downward AT steps.
Table 1 Experimental test conditions Chicken weights /g
Experiment No/
Sum of chickens Age /weeks
#1 #2 #3
Ambient temperature step (up/down) /°C
Step-duration up/down
/h:min Dew point /°C
1/3 chickens 8.6 1790 2420 2110 13/11 4:02/3:08 14-22
2/3 chickens 9.0 2458 2118 2292 10/9 5:00/2:22 17-28
3/3 chickens 9.4 2880 2600 2670 11/10 5:10/2:40 16-30
4/3 chickens 9.9 3240 2780 2900 13/10 5:02/3:16 12-22
5/2 chickens 10.3 3588 3150 9/9 6:58/2:20 16-26
6/2 chickens 10.7 3852 3266 8/8 2:00/3:02 14-22
2nd square wave 10.7 3852 3266 8/8 2:06/3:04 14-22
7/2 chickens 12.4 4620 3680 8/8 2:02/3:00 15-23
Figure 1 Comparison of ideal and actual air temperatures for typical dual-square wave pattern
3 Results and model analysis
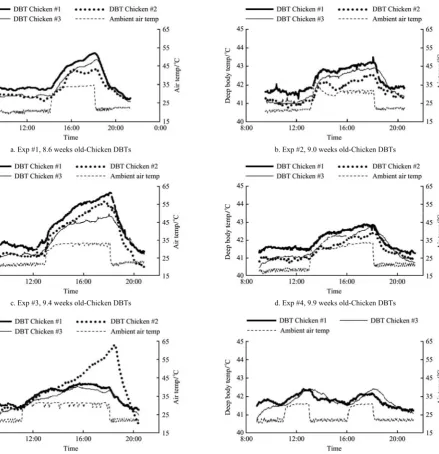
Figure 2 shows the dynamic DBT responses of chickens to AT for the seven experiments. The graphs for experiments 6 and 7 show the responses of only two chickens since chicken #2 died during experiment 5. Examination of DBT plots under the various AT test
conditions revealed that DBT responses of each heat stressed chicken varied dynamically, predictably, and measurably as a response to AT pulses. DBT rose almost immediately as the upward step was applied, and started decreasing almost just as quickly as the downward step was applied. One thing that was strongly evident from the plots is that regardless of environmental conditions, the DBT response trends among the chickens were consistent. This is in agreement with results in several previous studies, which have arrived at similar
conclusions[7,9,10,13]. Scatter plots were developed to
study the relationship between chicken responses to the same environmental conditions, and the results suggested a fairly linear relationship.
a. Exp #1, 8.6 weeks old-Chicken DBTs b. Exp #2, 9.0 weeks old-Chicken DBTs
c. Exp #3, 9.4 weeks old-Chicken DBTs d. Exp #4, 9.9 weeks old-Chicken DBTs
July, 2017 Hamrita T K, et al. Approaching of chicken deep body temperature response to ambient temperature Vol. 10 No.4 17
g. Exp #7, 12.4 weeks old-Chicken DBTs
Figure 2 Dynamic DBT responses of individual chickens to step changes in AT
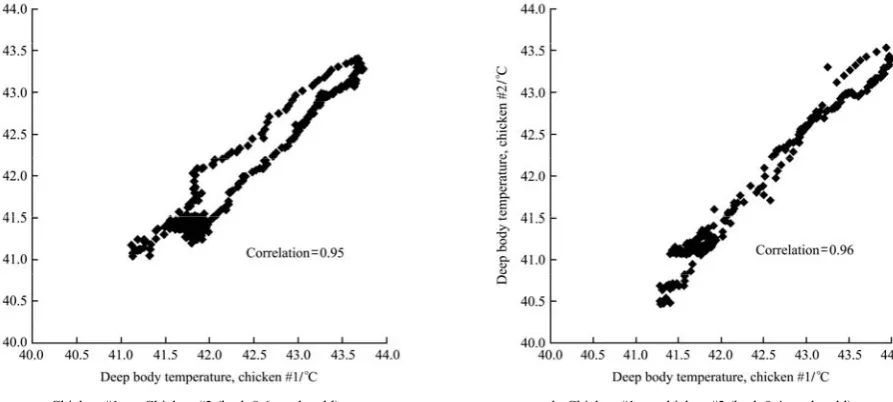
Figure 3 shows example scatter plots for two of the seven experiments. Pearson correlation coefficients (a measure of the strength of association between variables) were also computed for all experiments using Minitab 16 statistical software and the average coefficient for the
entire study was 0.84 with a p<0.0005. This indicates a
statistically significant positive correlation between individual chicken DBTs. The individual correlations for the various experiments are listed in Table 2. One important application of this result is that a small group of chickens’ DBTs could be used to estimate the response of the flock.
a. Chicken #1 vs. Chicken #3 (both 8.6 weeks old) b. Chicken #1 vs. chicken #2 (both 9.4 weeks old)
Figure 3 Scatter plots of chickens’ DBT responses
Table 2 Pearson correlations of dynamic deep body temperature of individual chickens to step changes in AT
Age /weeks Chickens 1-2 Chickens 1-3 Chickens 2-3
8.6 0.91 0.95 0.94
9.0 0.90 0.86 0.90
9.4 0.96 0.93 0.94
9.9 0.83 0.75 0.84
10.3 0.95
10.7 0.74
12.4 0.60
Test Average 0.90 0.83 0.91
Experiment Average 0.88
Further examination of the plots in Figure 2 revealed that chickens’ responses to upward and downward AT steps followed a first order model as follows:
T(t)=T∞+(Ti–T∞)e–t/τ (1)
where, T(t) is the DBT at time t; T∞ is the steady-state
DBT; Ti is the initial DBT, and τ is the time constant of
the chicken’s DBT rise. Time domain curve fitting and numerical methods to determine the parameters of an assumed model and minimize error between an actual and
an estimated response is common in the literature[20,21].
In particular, the authors of these studies performed process identification by curve fitting step responses. In this study, the time constant, initial temperature, and final temperature constants in the assumed first order model were determined to best fit the experimental data. For
days when air temperature went through two pulses, Ti,
parameters were kept constant for upward and downward step responses. All three parameters varied from one experiment to the next and as the birds aged.
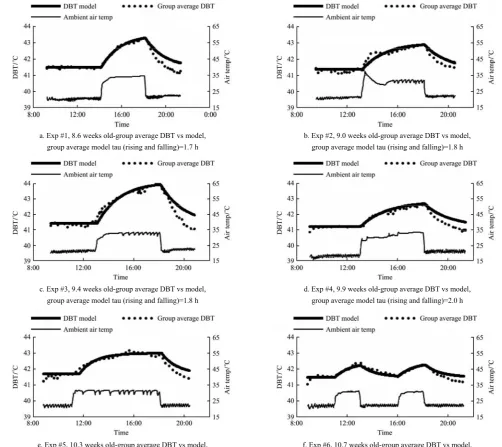
Figure 4 shows average DBT responses for each experiment overlaid with theoretical responses using the first order exponential model. The average response
was obtained by averaging the responses of the three (or in some cases two) chickens for that particular
experiment. The τfound to best fit the data varied from
1.2 h to 2.0 h and was different for each experiment.
The τ for each experiment is reflected in Figure 4. The
average τwas 1.6 h.
a. Exp #1, 8.6 weeks old-group average DBT vs model, group average model tau (rising and falling)=1.7 h
b. Exp #2, 9.0 weeks old-group average DBT vs model, group average model tau (rising and falling)=1.8 h
c. Exp #3, 9.4 weeks old-group average DBT vs model, group average model tau (rising and falling)=1.8 h
d. Exp #4, 9.9 weeks old-group average DBT vs model, group average model tau (rising and falling)=2.0 h
e. Exp #5, 10.3 weeks old-group average DBT vs model, group average model tau (rising and falling)=1.2 h
f. Exp #6, 10.7 weeks old-group average DBT vs model, group average model tau (rising and falling)=1.2 h
g. Exp #7, 12.4 weeks old-group average DBT vs model, group average model tau (rising and falling)=1.5 h
July, 2017 Hamrita T K, et al. Approaching of chicken deep body temperature response to ambient temperature Vol. 10 No.4 19
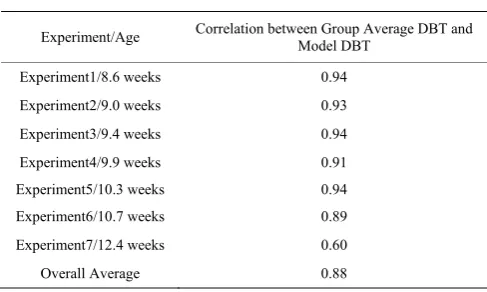
The Pearson correlation test calculated an average correlation of 0.88 between model data and experimental data for all tests. Table 3 shows the individual
correlations. The corresponding p-value was less than
0.0005, indicating statistical significance.
Table 3 Correlation between group average DBT and model DBT
Experiment/Age Correlation between Group Average DBT and Model DBT
Experiment1/8.6 weeks 0.94 Experiment2/9.0 weeks 0.93 Experiment3/9.4 weeks 0.94 Experiment4/9.9 weeks 0.91 Experiment5/10.3 weeks 0.94 Experiment6/10.7 weeks 0.89 Experiment7/12.4 weeks 0.60 Overall Average 0.88
It is difficult to compare our results to other studies in the literature since to date, chicken DBT responses to step changes in ambient temperature have been measured but almost never modeled, with the exception of one study by
Hamrita et al.[22] in which the authors predicted DBT
responses to stressful step changes in AT using neural networks. No studies could be found in the literature that quantify the order of the dynamics of DBT responses to AT. However, studies conducted by Aerts et al.
modeling heat production using a first order model[8,15]
are the only studies of their kind found in the literature, and they provide very useful results and observations that assist in the analysis of our own results. Close examination of the figures and related results reveals the following observations:
1) Although chickens are very complex living creatures with a complex cooling system, and although intuitively, a first-order differential equation does not seem likely to be a good model of poultry DBT responses to step changes in AT, Figure 4 and the correlation analysis seem to indicate that it is a decent approximation.
This is not unlike the study conducted by Aerts et al.[8] in
which the authors approximated the poultry heat production model using first order dynamics.
2) The same first order model used to fit the measured responses of the chickens for both upward and downward AT steps led to a closer approximation when the steps were going upward. Figure 4 shows that measured
downward DBT responses were, almost in every case, faster to go down than the model response. This implies
that the actual τ in the measurements is smaller than the
one in the assumed model. These results lead us to believe that the dynamic DBT response to step changes in AT is faster when DBT decreases (AT temperature decreases) and it is slower when DBT increases (AT temperature increases). Therefore, the DBT dynamic response to upward and downward steps in AT is asymmetrical. This type of behavior was observed in
the study conducted by Aerts et al.[8] to model heat
production responses to step changes in ambient temperature using a first order model. Their study revealed a similar asymmetry in the responses wherein responses to downward steps (increased heat production) were faster than those to upward steps (decreased heat production).
3) Close examination of the variations in τ as the
chickens aged did not show a strong relationship between this model parameter and the chickens’ age. Since the chickens were acclimating to heat-stress as they grew older, it is not possible, based on the limited set of experiments conducted for this study, to draw any conclusions regarding the relationship between the DBT response and age or acclamation. Similar conclusions
were reached in the study conducted by Aerts et al.[8] to
model heat production.
4) Similarly, no strong relationship could be found between the gain of the model and age or acclamation. Although it is evident in Figure 4 that the response was generally dampened as time progressed (as is clearly apparent in the 12.4 weeks response), it is not possible with the limited set of experiments to make definitive statements about this point. Note looking at the responses of chickens at 9.4 weeks, the amplitude of the responses seemed to get un-proportionally higher than those obtained in other experiments, suggesting a higher gain in the model. Similarly, note the un-proportionally high response of chicken number 2 at 10.3 weeks of age.
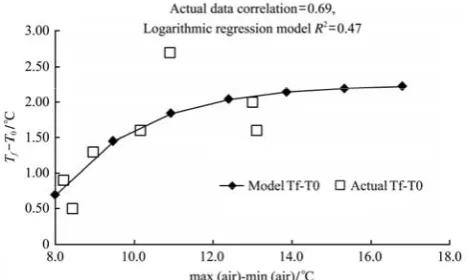
model parameters would have to be estimated in real-time
as well. As a most basic approach, initial DBT, Ti, and
steady-state DBT, T∞, could be estimated from the initial
and final ambient air temperatures, Ti,air and T∞,air.
Figure 5 shows an initial analysis of the data indicating a
positive correlation of 0.69 between ln(T∞–Ti) and
T∞,air–Ti,air, with a p-value of 0.086. A least squares
regression has led to the relationship ln(T∞ –Ti) =
0.19(T∞,air –Ti,air) –1.64 with R
2 = 0.47. This obviously is
not a reliable relationship, and follow up research is needed for improvement.
Figure 5 Comparison of logarithmic model and actual data of DBT model temperature difference vs. actual air temperature
difference
6) Looking at Figure 2, it is easy to note that responses to downward AT steps followed a first order dynamic more closely than responses to upward steps. For instance, looking at experiments conducted at 8.6 weeks, it is evident in Figure 6 that chicken 2’s internal thermoregulation mechanism was working to lower the chicken’ DBT and that first order dynamics do not reflect these dynamics accurately. This may suggest that there is a highly nonlinear relationship between upward AT steps and resulting DBT in certain temperature ranges. Sophisticated real-time data analysis would have to be applied alongside a model-based controller to keep up with data trends that would suggest time varying, higher order or nonlinear dynamics.
7) The study conducted in this paper relies on the responses to large AT steps. For the sake of generating the model, the steps were chosen high enough to push the chickens out of their homeothermal zone and to produce a very noticeable measurable response. In real conditions, it would be very rare for temperature to rise by such a large step in such a short period of time. Further studies
are needed to investigate the responses of chickens under a continuum of step temperature changes that more closely mimic real conditions. Moreover, other factors such as humidity and air velocity would have to be taken into consideration. Finally, the experiments conducted for this study involved a small number of chickens. In order for the developed model to be useful in real conditions, experiments involving larger groups of birds would have to be conducted to estimate model parameters.
Figure 6 Higher order dynamics of DBT responses to step changes in AT
4 Conclusions
Results of the study summarized in this paper suggest that chickens subjected to large step changes in ambient temperature (AT) respond with dynamic deep body (DBT) temperature changes that are measurable, predictable and consistent with one another. Moreover, first order dynamics are a good approximation of these dynamics.
July, 2017 Hamrita T K, et al. Approaching of chicken deep body temperature response to ambient temperature Vol. 10 No.4 21
stepping stone towards better understanding of the relationship between DBT of poultry and AT, therefore providing an invaluable tool for predicting behavior to environmental stimuli and informing management and risk assessment decisions. Overall, these results lay a foundation for the development of model-based poultry management practices that integrate physiological responses of the chickens in order to improve their wellbeing.
[References]
[1] Wathes C M, Kristensen H H, Aerts J M, Berckmans D. Is precision livestock farming an engineer’s daydream or nightmare, an animal’s friend or foe, and a farmer’s panacea or pitfall? Computers and Electronics in Agriculture, 2008; 64(1): 2–10.
[2] Hamrita T K, Mitchell B. Poultry environment and production control and optimization. A summary of where we are and where we want to go. Transaction of the ASAE, 1999; 42: 479–483.
[3] Fournel S, Rousseau A N. Research opportunities in environment control of confined animal housing systems through precision livestock farming. CSBE/SCGAB Annual Conference, Halifax, Nova Scotia, Canada, 2016.
[4] Fournel S, Rousseau A N, Laberge B. Rethinking environment control strategy of confined animal housing systems through precision livestock farming. Biosystems Engineering, 2017; 155: 96–123.
[5] Hamrita T K, Paulishen M. Advances in management of poultry production using biotelemetry. In Modern Telemetry, Ondrej Krejcar, ed. InTech, 2011; pp.165–182. [6] Sellier N, Guettier E, Staub C. A review of methods to
measure animal body temperature in precision farming. American Journal of Agricultural Science and Technology, 2014; 2(2): 74–99.
[7] Hamrita T K, Hoffacker E C. Closed-loop control of poultry deep body temperature using variable air velocity: A feasibility study. Transactions of the ASABE, 2008; 51(2): 1–12.
[8] Aerts, J M, Buyse J, Decuypere E, Berckmans D. Order identification of the dynamic heat production response of broiler chickens to step changes in temperature and light intensity. Transactions of the ASAE, 2003; 46(2): 467–473. [9] Lacey B, Hamrita T K, Lacy M P, van Wicklen G L, Czarick M. Monitoring deep body temperature responses of broilers to changes in ambient temperature and relative humidity using biotelemetry. Applied Poultry Research, 2000; 9(1): 6–12.
[10] Lacey B, Hamrita T K, Lacy M P, van Wicklen G L. Assessment of poultry deep body temperature responses to ambient temperature and relative humidity using an on-line
telemetry system. Transaction of the ASAE, 2000; 43(3): 717–721.
[11] Aengwanich W. Effects of high environmental temperature on the body temperature of Thai indigenous, Thai indigenous crossbred and broiler chickens. Asian Journal of Poultry Science, 2008; 2: 48–52.
[12] Yang H H, Bae Y H, Min W. Implantable wireless sensor network to monitor the deep body temperature of broilers, Software Engineering Research, Management & Applications, 2007. SERA 2007. 5th ACIS International Conference on. IEEE, 2007; pp.513–517.
[13] Hamrita T K, van Wicken G, Czarick M, Lacy M. Monitoring poultry deep body temperature using biotelemetry. Appl. Eng. Agr., 1998; 14(3): 227–231. [14] Aerts, J M, Berckmans D, Wathes C M, Berckmans D.
Dynamic data-based modelling of heat production and growth of broiler chickens: Development of an integrated management system. Biosystems Engineering, 2003; 84(3): 257–266.
[15] Aerts J M, Berckmans D, Saevels P, Decuypere E, Buyse J. Dynamic and static responses of total heat production of broiler chickens to step changes in temperature and light intensity. Transaction of the ASAE, 2000; 43(6): 1835–1841. [16] Marchant-Forde J, von-Borell E, Langbein J, Després G,
Hansen S, Marchant-Forde R, et al. Heart rate variability as a measure of autonomic regulation of cardiac activity for assessing stress and welfare in farm animals: A review. Physiology & Behavior, 2007; 92: 293–316.
[17] Blanchard S M, Degernes L A, de Wolf Jr D K, Garlich J D. Intermittent biotelemetric monitoring of electrocardiograms and temperature in male broilers at risk for sudden death syndrome. Poultry Science, 2002; 81:887–891.
[18] Nascimento S T, Oliveira I J, da Silva A, Campos S, Castro M C, Vieira F M C. Mean surface temperature prediction models for broiler chickens—a study of sensible heat flow. International Journal of Biometeorology, 2014; 58(2): 195–201.
[19] Clark D W, Mohtadi C, Tuffs P S. Generalized predictive control – Part 1. The basic algorithm. Automatica, 1987; 23(2):137–148.
[20] Zhu Y Q, Rangaiah G P, Lakshminarayanan S. Identification of a second order plus dead time and zero model for single-input single-output processes using step response and curve fitting. Journal of the Institution of Engineers, 2003; 42: 14–20.
[21] Rohit R, Lakshminarayanan S, Rangaiah G P. Process identification using open-loop and closed-loop step responses. Journal of the Institution of Engineers, 2005; 45(6): 1–13. [22] Lacey B, Hamrita T K, McClendon R. Feasibility of using