Image processing methods to evaluate tomato and
zucchini damage in post-harvest stages
José Antonio Alvarez-Bermejo
1*,
Cynthia Giagnocavo
2,
Li Ming
3*,
Encarnación Castillo Morales
4,
Diego P. Morales Santos
4,
Yang Xinting
3(1. Department of Informatics, CeiA3, University of Almeria, Almeria, CP 04120, Spain; 2. Cátedra (Chair) Coexphal-UAL of Horticulture, Cooperative Studies and Sustainable Development, University of Almería, Spain; 3. Beijing Research Center for Information Technology
in Agriculture/National Engineering Research Center for Information Technology in Agriculture/National Engineering Laboratory for Agri-product Quality Traceability/Key Laboratory for Information Technologies in Agriculture, Ministry of Agriculture, Beijing 100097,
China; 4. Department of Electronics and Computer Technology, Facultad de Ciencias, Granada, CP 18071, Spain)
Abstract: Through the supply chain, the quality or quality change of the products can generate important losses. The quality control in some steps is made manually that supposes a high level of subjectivity, controlling the quality and its evolution using automatic systems can suppose a reduction of the losses. Testing some automatic image analysis techniques in the case of tomatoes and zucchini is the main objective of this study. Two steps in the supply chain are considered, the feeding of the raw products into the handling chain (because low quality generates a reduction of the chain productivity) and the cool storage of the processed products (as the value at the market is reduced). It was proposed to analyze the incoming products at the head the processing line using CCD cameras to detect low quality and/or dirty products (corresponding to specific farmers/suppliers, it should be asked to improve to maintain the productivity of the line). The second stage is analyzing the evolution of the products along the cool chain (storage and transport), the use of an App developed to be use under Android was proposed to substitute the “visual” evaluation used in practice. The algorithms used, including stages of pre-treatment, segmentation, analysis and presentation of the results take account of the short time available and the limited capacity of the batteries. High performance techniques were applied to the homography stage to discard some of the images, resulting in better performance. Also threads and renderscript kernels were created to parallelize the methods used on the resulting images being able to inspect faster the products. The proposed method achieves success rates comparable to, and improving, the expert inspection.
Keywords: image processing, color space, smartphone, efficient stitching, homography, controlled supervision, artificial vision, embedded parallel processing, injury assessment, traceability, post-harvest control, feature detection
DOI: 10.25165/j.ijabe.20171005.3087
Citation: Alvarez-Bermejo J A, Giagnocavo C, Li M, Morales C E, Santos D P M, Yang X T. Image processing methods to evaluate tomato and zucchini damage in post-harvest stages. Int J Agric & Biol Eng, 2017; 10(5): 126–133.
1 Introduction
In a FAO document, an interesting definition of what
Received date: 2017-05-18 Accepted date: 2017-09-20
Biographies: Cynthia Giagnocavo, PhD, Professor, research interests: agricultural cooperatives, innovative business models and ICT economic viability, Email: [email protected]; Encarnación Castillo Morales, PhD, Associate Professor. research interests: reconfigurable digital processing systems for environmental and biomedical signals, Email: [email protected]; Diego Pedro Morales Santos, PhD, Associate Professor, research interests: reconfigurable applications on wearable processing and electronics systems for environmental and biomedical signals, Email:
is a post-harvest system can be found, it is defined as a system/chain/pipeline that should be considered as encompassing the delivery of a crop from the time and place of harvest to the time and place of consumption[1].
[email protected]; Yang Xinting, PhD, Professor, research interests: agricultural product quality safety, Email: xintingyang@ nercita.org.cn.
September, 2017 Alvarez-Bermejo J A, et al. Image processing methods to evaluate tomato and zucchini damage Vol. 10 No.5 127
The key term system denotes a dynamic, complex aggregate of logically interconnected functions or operations within a sphere of activity. The term chain or pipeline highlights the functional succession of various operations but tends to ignore their complex interaction. Processing and manufacturing companies have complex, synchronized product lines and the fact that a product line should stop to pre-process the problematic products (clean the dust, remove the injury ones, etc) causes the line to slow down affecting the entire process of manufacturing, packaging and distribution. It is worth considering that processing lines must meet strict time schedules, and that any inconvenient is translated directly into loses. In addition to avoid slowing down the lines, an automatic and objective method is obviously essential, which could detect the external quality of fruits and vegetables, such as their color, texture, size, shape, as well as the visual defects and dust in time[2].
Machine vision is a rapid, consistent and objective inspection technique, which has expanded into agriculture and food industry. Its speed and accuracy provide one alternative for identifying and classifying the agri-product in the production line within automated and non-destructive way. The main researchers about this field is from Spain[3], China[4], India[5], Japan[6], etc. Over the past decades, computer vision systems, including visible computer vision system, hyperspectral computer vision system, and multispectral computer vision system, have been widely used as important tools for the automatic external quality inspection of agricultural products. Many researches based on spatial image and/or spectral image processing and analysis have been published proposing the use of computer vision technique in the field of external quality inspection of fruits and vegetables. Automatic external quality inspection of fruits and vegetables is still a challenging work[2]. Some external quality criteria, such as color, texture, size, and shape, are actually automated on industrial graders, but the other appearance criteria, such as dust and some other unobvious defects which present the similar color and texture to the products, is not yet efficient identified and we are still lack of computer vision system carrying out fruit inspection before arrival
at the packing lines[7,8]. Also a system was needed when
it mounted on a mobile platform where workers placed the harvested fruits, which was specially designed for sorting fruit in the field.
The objective of this work is to provide an application designed for embedded devices such as mobile Android smartphones to objectivize the measurements using machine vision.
2 Materials and methods
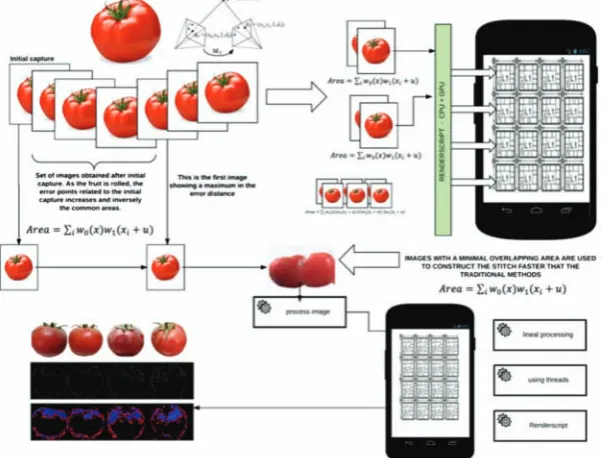
The technique implemented to analyze the surface of each tomato or zucchini is the image stitching - homography. Image stitching has been solved in different ways and is widely commented in the literature[9,27]. Image stitching can be automated through direct or feature-based methods. Direct methods use all image data and minimize the pixel-to-pixel dissimilarities. Feature-based methods match image features. To accelerate the process, images that contained too much information in common with already acquired images were discarded. This was calculated using feature-based methods (SURF[10]). The composition was made by means of stitching the selected images using direct methods. Supporting theories[27] for our proposal are exposed next.
A variant of the normalized device coordinates used in computer graphics[11] has been adopted to facilitate working with images at different resolutions. Pixel coordinates range from [−1, 1] along the longer axis, and [−a, a] for the shorter axis, a is the inverse of the aspect ratio. Thus, for an image with width W and height H, the equations mapping integer pixel coordinates to
( , )
x= x y normalized device coordinates x=( , )x y are 2x W
x S
−
= and y 2y H S
−
= , where, S=max(W, H). Once defined, the coordinates are transformed following the projective model, (homography), that operates on homogeneous coordinates x% and x%′, x%′~Hx% %, where, ~ denotes equality up to a scale, and H% is a 3×3 arbitrary matrix, homogeneous. The resulting x%′
coordinate must be normalized to get a non-homogeneous result x′:
00 01 02
20 21 22
h x h y h x
h x h y h
+ +
′ =
+ + and
10 11 12
20 21 22
h x h y h y
h x h y h
+ +
′ =
This model keeps straight lines. If involving 3D instead of simple 2D transformations, then 4×4 matrices need to be used this way central projections map 3D
(X,Y,Z) points to 2D points (x, y, 1) with a distance f
along z axis. θ is the angle of vision over z.
1
, , tan 2
X Y
x f y f f
Z Z
θ
−
= = = (2) The perspective projection is given in the form of a permutation matrix that permutes the last two elements of homogeneous 4-vector p = (X, Y, Z, 1). The z-buffer values tend to be ignored as they cannot be sensed and therefore
0 0 0
0 0 0 [ | 0] 0 0 1 0
f
x f p K p
⎡ ⎤
⎢ ⎥ =
⎢ ⎥
⎢ ⎥
⎣ ⎦
% (3)
K is the calibration matrix (intrinsic). To achieve high quality results when stitching images from conventional cameras, the focal distance should be used to create K. A 3D point p is mapped to an image coordinate x%0 in the position 0 of the camera through the combination of a Euclidean motion E0 and a
perspective projection P0:
0 0
0 0T 1 0
R t
x =⎡⎢ ⎤⎥p E p=
⎣ ⎦ x%0~P E p0 0 (4)
Given the nature of the cameras used to conduct this paper, there is no information available of depth coordinates of pixels, the algorithm works with planar
scenes adding to Equation (3) a general plane equation
0 0
ˆ
n p c⋅ + . So, the mapping equation reduces to
1
x% ~H x% %10 0, where, H%10 is a general 3×3 homography matrix and x%0 and x%1 are now 2D homogeneous coordinates. To understand the alignment between a pair of images (once the motion model used is described), an error metric and a search method need to be developed. Given a template image I0(x), it is our aim to find where
in I1(x) pixels of interest (feature-based methods were
used) are located. A straight solution may be to use the conventional minimum to the sum of the squared differences function: 2
1 0
[ ( ) ( )]
SD i i i
Error =
∑
I x + −u I x =2
i
ie
∑
. With u=(u,v) being the displacement andei =I1(xi +u) – I0(xi), the residual error. This metric
ignores the fact that many pixels under comparison may fall outside the original image boundaries. The weight of these pixels should be reconsidered to not allow them to contribute, the error metric then is weighted to meet such requirement: ErrorWSD =
∑
iw x w x0( ) (1 i+u)2
1 0
[ (I xi+u)−I x( )]i . From this we can calculate the overlap area as Area=
∑
iw x w x0( ) (1 i+u) which is thefactor that we consider discarding images (see Figure 1). Once we have discarded most of the images that provides bigger areas of overlap, we use BoofCV and Renderscript libraries to obtain the composed image.
September, 2017 Alvarez-Bermejo J A, et al. Image processing methods to evaluate tomato and zucchini damage Vol. 10 No.5 129
After composing (stitching) the images for analysis (whether they are just shots or video) the stages involved in the analysis of the surfaces are processed to obtain features from the set of images so that the percentage of
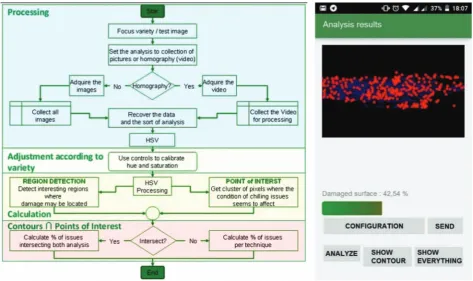
damaged surface can be computed. Steps are processed sequentially. Figure 2 describes the steps. Before the images are ready, the values to operate in HSV are configured manually according to the light conditions.
Figure 2 Flow diagram of the algorithm and App snapshot
The image processing is started according to Figure 2 where the flow diagram of the algorithm is depicted. The processing of the images can be lineal (image after image) or parallel (using Android threads or RenderScript to involve GPUs in the processing task). Mainly, the processing stage consists in calculating the points of interest: to get the points where the defects are, the algorithm of detecting points of interest Hessian Affine[12,13] was used. To detect the region of interest, Canny algorithm[14,15] was used. Figure 2 shows the result image of the piece under study, and the data is analyzed and the faulty regions are covered with the red dots. When the points of interest (red dots) are engaged, the total area and the injured percentage are computed. Figure 2 shows the results of the analysis (using video), with 42.5% injured area.
3 Results
3.1 Proposed method applied in tomato
Results after applying the proposed method to measure defects in the surface of products (tomato and
zucchini in this case) are discussed. The data was gathered after the crop was collected and transported to the manufacturing cooperative, using Android smartphones (the use of such devices is an extended practice[16]) as an example of cheap, mobile embedded system. The performance of the method was tested during two stages of the production. The first stage was the raw product entering the production lines, during this stage we are interested in computing the percentage of dirt covering the surface of tomatoes. The second stage under study is the cold storage phase, where injuries due to long exposure to cold were analyzed for the zucchini case. For the first stage, the study was conducted in the two modes of operation (images -see Figure 3- and video) results are shown in Table 1 and Table 2.
Table 1 Analysis of the surface of the production as it enters the cooperative
Sample Dirt percent/% Lineal/ms Threaded/ms RS/ms Picture. The piece
was not moving and no homography was
calculated (see Figure 3). Three different tomatoes.
42.78 9789 7784 5376
41.68 11976 8734 5526 40.74 10905 8803 5317
Table 2 Percentages of surface damaged and computation when unfolding the surfaces
Homography/s Analysis of the unfolded surface/ms Overlap SURF-SURF SURF-Direct Injury/% Lineal Threaded RS
>20% 437 11,74 30.74 9770 7881 5565 >10% 381 4,81 44.64 8764 6864 5302 >2% 312 1,90 53.65 2194 1794 852
The production can be first analyzed by taking pictures with the application, see Table 1. This will calculate the percentage of dirt or bad conditions in general. The portion of dirt includes the percentage of the analyzed surfaces which were visible to the camera (with the region detector). The optimization of the Homography or image stitching method was used when the image acquisition was conducted using video as shown in Table 2. Table 1 and Table 2 columns show, in milliseconds, the time it took for analyzing the surfaces (Table 2 includes the time it took to create the homography). In both tables lineal, stands for the version of the algorithm with no optimization. It is the straight implementation of the methods (no parallel code, no image discards to build the homography). In every case, we can see that this is the worst option. The threaded column identifies the first optimization implemented using exclusively threads, this option was faster than the lineal version was restricted to the CPUs of the device. The third column, RS, is the RenderScript version. This is an optimized version to parallelize the calculations (expressed in Figure 2) including extra computational resources, such as the GPU (Graphic Processing Unit) of the smartphone device. When using RenderScript (for the generation of the homographies) the BoofCV library was modified to send data to GPU. An interesting aspect to consider is that when using the CPU and GPU together (RS column) to analyze the tomato conditions, the time spent is by far the best time but it keeps around 5 s to analyze each surface whereas the
other versions of the methods increases in time when the surfaces are more complex.
3.2 Method applied in zucchini
Figure 4 and Table 2 show the time taken to create the homography using SURF method to discard images with an overlapping area over 20%, 10% and 1% for each case and SURF versus Direct methods to compose it. As new data are added to the homography buffer, new computation is associated with the RS kernels and new operations are concurrently started. The fine grain achieved shows to perform better than the threaded version. The costly side of this analysis is the composition of the image stitch or homography when the feature based method is used instead of the direct method modified using our proposed approach of ignoring images with overlapping area, as shown in Figure 1. Once the homography is calculated, the surface analysis (using RenderScript) is over 5 s.
Figure 4 Stage 1: Analysis made using homographies (Varying the overlapping area)
The time it took to create the image stitch using feature methods was too long. When using direct methods, the time to create the complete surface was affordable.
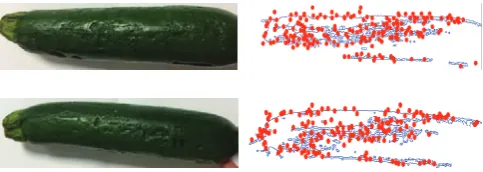
With regard of the freezing phase or stage two of our study, Figure 5 represents the graphical analysis on two out of twenty samples of zucchini piecesused to measure the effect of cold storage. Table 3 shows the different results of the analysis when carried out visually by an expert in contrast to the method presented in this paper. This process was experienced once on the samples after 7 d stored with a temperature of 9°C.
September, 2017 Alvarez-Bermejo J A, et al. Image processing methods to evaluate tomato and zucchini damage Vol. 10 No.5 131
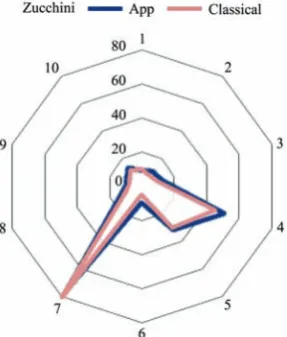
Table 3 Developed app versus classical method
Table 3 shows that the app throws better results than the visual inspection, the diagram shows the differences between the expert and the app. The standard deviation is 12.02 with the app and 12.48 when the expert must do the evaluation. The method used to validate has been the visual supervision by an expert, which classifies the injured area. In contrast, the App developed has proved to be adequate for the inspection since it has a slight variation compared with the classic method in absolute terms. The proposed method implies having a standardization of the evaluation, in contrast to an expert opinion (Figure 6).
Figure 6 Variation compared with the classic method in absolute terms
Our method was tested in two different stages of the production line, with two different elements (tomato and zucchini) the advantage of the method is evident when unfolding surfaces to analyze the fruit completely. The camera records video of the fruits as they advance in the production line. Frames with relevant information (overlap area) are selected. Direct methods are used to create a unique image, from the selected frames, of the unfolded surface. This image is analyzed to search for defects.
4 Discussion
A cheap, portable and fast method to evaluate the
quality of the production (tomatoes and zucchini) has been developed using efficient image processing techniques for embedded systems. The image processing is a well-established method in the agriculture sector, but there are two issues to consider:
(i) How the images are acquired, such as a system[17] is built with binocular cams to construct almost an homography. This supposes a benefit over the traditional processing of a stack of images (as in the case [18]), in these papers authors proposed an alternative solution to avoid the image stitching or homography as it is a costly computational process. Most of the literature shows that being able to unfold a surface (of a fruit) in order to execute efficiently the analysis, it requires a dedicated and expensive system or otherwise it is not affordable in terms of computational time. When using affordable embedded processing systems, authors tend to use separate images, this can lead to an incomplete analysis of the surface as many features of the surface may be ignored if they are not in the images. Otherwise, if too many pictures are collected time may be wasted analyzing already studied areas.
In this paper, we proposed a fast system to detect features of the images and compose in a reasonable time the stitch or homography that is later analyzed. An acquisition process uses feature detectors[19] to determine which images will be part of the stich (unfolded surface of the fruit). Ignoring images with overlapped areas allows to accelerate the process and avoids unnecessary computation.
(ii) The colour scheme where the processing is done, here there are a myriad of opinions as where the scheme used is CIE-LAB[18], or where authors move to HSI-YUV[19], or where authors move to HSV in
accordance with the scheme[20] used in this paper, because it represents the true color, or like where the scheme selected is RGB to HIS[21]. Moving to a color space ermits a better understanding of the features, in our case, and as most of the authors do, in this paper, when the stitch or homography is ready, the image is moved to the HSV space to make it independent as it separates luma, or the image intensity, from chroma or the color information.
Sample
Observed injuries after 7 days/%
APP Expert
Sample-1 15.78 10
Sample-2 35.97 35
(iii) Segmentation, where algorithms are well known such as watershed[22], or several methods are combined (Otsu and Canny)[23], in this paper the Canny algorithm is
used, which is set as the most efficient algorithm for this purpose[10]. In any of the definitions, what this paper pretend is to be able to calculate the impact of the damage of the fruit -when associated with a certain producer- and detect the potential food loss due to an inappropriate transport, cooling or manufacturing.
The novelty of the presented work resides in the ability to create a fast composition of the fruit images from a video stream, resulting in its unfolded surface (optimized) which is analyzed with efficient implementation (using the GPU of the embedded device or smartphone) of well-known algorithms such as Canny[24]. These results in a tool that can be used to monitor the quality of the products as they are fed into the processing lines or even when they are kept using cold chain[25] to preserve the quality. In this case, low temperatures or a long period of exposition to them, can cause damages[26] heading to loss of quality. The macroscopic changes that appear due exposure to cold are used to assess the effect of damage. Traditionally, the evaluation is done visually, and consequently subjective. The proposed method is a potential way for solving this problem.
5 Conclusions
Image processing of the quality of the products in two links of the supply chain has been evaluated: the head of the processing chain and the cold storage of the products. In the first case, a good quality analysis of the product improves the productivity of the chain reducing the cleaning time and avoiding processing low quality products. At the second link, we are able to evaluate the deterioration of the products, evaluating damage and taking measures to avoid the deterioration process. Our proposal was using image processing in both steps:
1) Including CCD cameras on the head of the processing lines, which evaluate the incoming products, generating alerts related with the producer – asking the worker to improve the quality or cleaning the products. The analysis has been made using three different methods,
lineal, threaded and RenderScript.
2) Using smartphones to analyse the stored (or transported) products to evaluate the damage generated during the elapsed time; in this case we proposed an algorithm in four steps: pre-processing, segmentation, analysis and presentation of significant results (on the same device). In this case, it is important to optimize the processing time and the power supply requirements. The results can affect not only the use/management of the specific lot of product, but also the general procedures in order to obtain better thresholds for the cooling stages of the supply chain.
All the tests have been done with two of the main local products, tomatoes and zucchini, offering less subjectivity than the standard method (equalling trained evaluators), advancing some deep damages and reducing the evaluation time. The overall processing is enhanced offering best qualified products and reducing the overload time. It can be concluded that it is possible to conduct these tests using conventional embedded devices and commercial operating systems like Android. Also, a method to assign costs and risks to each producer can be developed as measures on the quality and damages of the product are possible and fast.
Acknowledgments
This research was funded by the Controlcrop Project, P10-TEP-6174, project framework, supported by the Andalusian Ministry of Economy, Innovation and Science (Andalusia, Spain), the Spanish Ministry of Science and Innovation as well as the EUERDF funds under grant DPI2014-56364-C2-1-R, by TEAP project included in the Marie Curie Actions (PIRSES-GA-2013- 612659) and by Young Scientists Fund of National Natural Science Foundation of China (31401683).
[References]
[1] FAO. Post-harvest system and food losses. http://www. fao.org/docrep/004/ac301e/AC301e03.htm. Accessed on [201705-11]
September, 2017 Alvarez-Bermejo J A, et al. Image processing methods to evaluate tomato and zucchini damage Vol. 10 No.5 133 [3] Cubero S, Lee W S, Aleixos N, Albert F, Blasco J.
Automated systems based on machine vision for inspecting citrus fruits from the field to postharvest: A review. Food Bioproc Tech, 2016; 9: 1623–1639
[4] Rong D, Rao X Q, Ying Y B. Computer vision detection of surface defect on oranges by means of a sliding comparison window local segmentation algorithm. Comput Electron Agr, 2017; 137: 59–68
[5] Khoje S A, Bodhe S K. A Comprehensive survey of fruit grading systems for tropical fruits of maharashtra. Crit Rev Food Sci, 2015; 55(12): 1658–1671
[6] Su Q H, Kondo N, Li M Z, Sun H, Al Riza D F. Potato feature prediction based on machine vision and 3D model rebuilding. Comput Electron Agr, 2017; 137: 41–51 [7] Cubero S, Aleixos N, Albert A, Torregrosa A, Ortiz, C,
García-Navarrete O, Blasco J. Optimised computer vision system for automatic pre-grading of citrus fruit in the field using a mobile platform. Precis Agric, 2014; 15(1): 80–94. [8] Wang L, Tian X, Li A, Li H. Machine vision applications
in agricultural food logistics. Proceedings of 2013 6th International Conference on Business Intelligence and Financial Engineering, BIFE 2013, art. no. 6961105, 2014; pp. 125–129.
[9] Brown M, Lowe D G. Automatic panoramic image stitching using invariant features. Int J Comput Vision, 2007; 74(1): 59–73.
[10] Panchal P M, Panchal S R, Shah S K. A Comparison of SIFT and SURF. International Journal of Innovative Research in Computer and Communication Engineering, 2013; 1(2): 323–327
[11] OpenGL-ARB. OpenGL Reference Manual: The Official Reference Document to OpenGL, Version 1.1. Addison-Wesley, Reading, MA, 2nd edition. 1997.
[12] Mikolajczyk K & Schmid C. Scale & affine invariant interest point detectors. Int J Comput Vision, 2004; 60(1): 63–86.
[13] Mikolajczyk K, Tuytelaars T, Schmid C, Zisserman A, Matas J, Schaffalitzky F, et al. A comparison of affine region detectors. Int J Comput Vision, 2005; 65(1/2): 43–72. [14] McIlhagga W. The canny edge detector revisited. Int J
Comput Vision, 2011; 91(3): 251–261.
[15] Xin G, Ke C, Hu X G. An improved Canny edge detection algorithm for color image. IEEE 10th International Conference on Industrial Informatics, Beijing, 2012, pp. 113–117.
[16] Wu C C, Zhou L, Wang J, Cai Y P. Smartphone based precise monitoring method for farm operation. Int J Agric & Biol Eng, 2016; 9(3): 111–121.
[17] Xiao B X, Wang C Y, Guo X Y, Wu S. Image acquisition system for agricultural context-aware computing. Int J Agric & Biol Eng, 2014; 7(4): 75–80.
[18] Nagle M, Intani K, Romano G, Mahayothee B, Sardsud V, Müller J. Determination of surface color of ‘all yellow’ mango cultivars using computer vision. Int J Agric & Biol Eng, 2016; 9(1): 42–50.
[19] Zhang C L, Zhang S W, Yang J C, Shi Y C, Chen J. Apple leaf disease identification using genetic algorithm and correlation based feature selection method. Int J Agric & Biol Eng, 2017; 10(2): 74–83.
[20] Choe Lip Haw, Wan Ishak Wan Ismail, Siti Kairunniza-Bejo, Adam Putih, Ramin Shamshiri. Colour vision to determine paddy maturity. Int J Agric & Biol Eng, 2014; 7(5): 55–63.
[21] Kim D G, Burks T F, Qin J W, Bulanon D M. Classification of grapefruit peel diseases using color texture feature analysis .Int J Agric & Biol Eng, 2009; 2(3): 41–50. [22] Zhang J X, Ma Q Q, Li W, Xiao T T. Feature extraction of
jujube fruit wrinkle based on the watershed segmentation. Int J Agric & Biol Eng, 2017; 10(4): 165–172.
[23] Sun G X, Li Y B, Wang X C, Hu G Y, Wang X, Zhang Y. Image segmentation algorithm for greenhouse cucumber canopy under various natural lighting conditions. Int J Agric & Biol Eng, 2016; 9(3): 130–138.
[24] Narendra V G, Hareesh K S. Study and comparison of various image edge detection techniques used in quality inspection and evaluation of agricultural and food products by computer vision. Int J Agric & Biol Eng, 2011; 4(2): 83–90.
[25] Aghdam M S, Bodbodak S. Postharvest Heat Treatment for Mitigation of Chilling Injury in Fruits and Vegetables. Food Bioproc Tech, 2014; 7(1): 37–53.
[26] Sevillano L, Sánchez-Ballesta M T, Romojaro F, Flores F B. Physiological, hormonal and molecular mechanisms regulating chilling injury in horticultural species. postharvest technologies applied to reduce its impact. J Sci Food Agr, 2009; 89(4): 555–573.