IJPAR |Vol.5 | Issue 3 | July- Sep -2016
Journal Home page: www.ijpar.com
Research article Open Access
Development and validation of spectroscopic methods for simultaneous
estimation of combination of antibiotic agents
Prerana Sanas*
1, Amol Kulkarni
21
Department of Chemistry, CAYMET’s Siddhant College of Pharmacy Sudumbre, Talegaon, Pune, India.
2
Associate Professor Department of Chemistry, CAYMET’s Siddhant College of Pharmacy Sudumbre,
Talegaon, Pune, India.
*Corresponding Author: Prerana Sanas Email ID: - [email protected]
ABSTRACT
A simple, sensitive rapid and reproducible UV and method has been developed and validated for simultaneous determination of Cefixime and Pefloxacin in bulk and pharmaceutical formulation. For development of UV method for Cefixime and Pefloxacin methanol was used as solvent and detection wavelength were found to be at 289.0 nm and 232.80 nm respectively. The method was found to linear in concentration range 10-35 µg/ml for both drugs the precision and repeatability results showed %RSD less than 2%. The LOD was found to be 0.6445µg/ml and 1.7187 µg/ml for CEF and PEF respectively and LOQ was found to be 1.9531 µg/ml and 5.2083 µg/ml for CEF and PEF respectively. The method was validated as per ICH guidelines.
Keywords
:
Cefixime trihydrate, Pefloxacin mesylate, UV Spectroscopy, Combined Dosage Form.INTRODUCTION
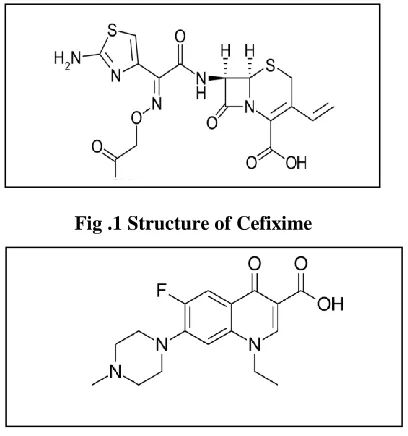
Cefixime is a aminothiazolyl, semi synthetic, broad spectrum third generation cephalosporin, active against gram positive and gram negative aerobic bacteria. This C16H15N5O7S2.3H2O is the chemical formula of Cefixime trihydrate with molecular weight 507.50 as trihydrate. Chemically, it is (6R, 7R)-7-{[(Z)-2-(2-aminothiazole-4-yl)-2- [(carboxymethoxy) imino] acetyl] amino]-3- ethyenyl-8-oxo-5-thia-1-azabcyclo [4.2.0] oct-2-ene-2-carboxylic acid trihydrate [1-2].
The Cefixime trihydrate is a cephalosporin antibiotic. The third generation antibiotic acts by
inhibiting the synthesis of bacterial cell wall. The bactericidal action of cephalosporin is due to the inhibition of cell wall synthesis. It binds to the penicillin binding proteins (PBPs), inhibiting the final transpeptidation step of the peptidoglycan synthesis in the cell wall of the bacteria, thus inhibiting biosynthesis and arresting cell wall assembly resulting in bacterial cell death. It is commonly used in the treatment of susceptible infections including gonorrhoea, otitis media, pharyngitis and infections of respiratory-tract such as bronchitis, and urinary-tract.
Fig .1 Structure of Cefixime
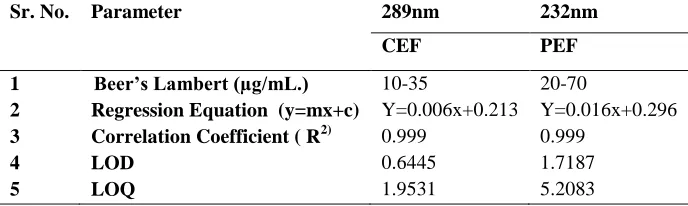
Fig.2 Structure of Pefloxacin
Pefloxacin is a broad-spectrum third generation fluoroquinolone synthetic antibiotic. Chemically pefloxacin is ethyl-6-fluoro-7- (4-methyl- 1-piperazinyl)-4-oxo- 1, 4- dihydro-3-quinolone carboxylic acid and structurally it is analog of norfloxacin. Dihydrate mesylate salt of pefloxacin has been frequently used worldwide in the form of, parentral infusion, oral tablet and topical eye drops [4].
It inhibits DNA gyrase and topoisomerase IV, the bacterial enzymes, which are responsible for transcription and replication of DNA of bacteria. The primary quinolone target for gram-negative bacteria is DNA gyrase while topoisomerase IV for gram-positive organisms. [5] Systemically PEF is prescribed in uncomplicated cystitis in women, uncomplicated gonococcal urethritis in males and in gastrointestinal and genitourinary tract (gram-negative bacterial infections) [6]. Some methods have been reported for determination of Pefloxacin in pharmaceutical formulation bulk, and biological fluids such as vibrational spectroscopy (VIB) [7], atomic absorption spectroscopy (AAS) [8-9], spectrofluorimetry (SF) [8], UV-spectroscopy (UV) [10], visible spectroscopy (VS) [11-18], voltammetric study (VL) [19-20] , microbiological assay (MA) [21-23], potentiometric titration [23], enzyme-linked immunosorbent assay (ELISA) [24-25] capillary electrophoresis (CE) [26] NIR-spectroscopy [27] colorimetric method[28] HPLC[29-32]. All the above methods have their
applications and limitations. Some of analytical methods (CE, MA, AAS, ELISA, HPLC, RP-HPLC) even have good sensitivity and selectivity. But the methods are time consuming; complex and costly thus are not suitable for assay of Pefloxacin. Besides this, in visible spectroscopic and colorimetric methods the use of various dyes and organic solvents results in non-eco-friendly, time consuming procedures and sometimes are proved carcinogenic.
MATERIALS AND METHODS
Reagents and Chemicals
Methanol (AR Grade), Acetonitrile, Water HPLC grade, potassium hydroxide orthophosphoric acid and potassium dihydrogen ortho phosphate were provided by Merck Pharmaceuticals ltd Hyderabad. Pure Standard gift sample of Cefixime Trihydrate (CEF) and Pefloxacin Mesylate was provided by Richer Pharmaceuticals.
Instrument
Preparation of Stock Solutions
Cefixime trihydrate
Weigh and transfer 100 mg of Cefixime trihydate working standard into 100 ml of volumetric flask, add 10 ml of methanol and sonicated to dissolve for 10 minutes and dilute to volume with diluents. The Wavelength of the Cefixime was found to be 289.00 nm and Absorbance is 0.617.
Pefloxacin mesylate
Weigh and transfer 200mg of Pefloxacin mesylate working standard into 100 ml volumetric
flask add 10 ml of methanol and sonicated to dissolve for 10 minutes and dilute to volume with diluent. The Wavelength of the Pefloxacin was found to be 232.80 nm and Absorbance is 0.352.
Preparation of mixture
Crush to powder 20 tablets, weigh and transfer the tablet powder equal to 430 mg of
into 100 mL volumetric flask add 20 mL of methanol, sonicated to dissolve for 10 minutes and dilute to volume with diluent. Filter the solution through whatman filter. Further dilute 2.5 ml to 100ml with diluents.The wavelength of the mixture was found to be 254.20 nm and absorbance is 0.492.
Fig. 3-UV Spectra of Cefixime
Fig .4:- UV Spectra of Pefloxacin.
Determination of absorptivity at analytical
Wavelength
Preparation of standard solutions
Weighed and transferred 100 mg of Cefixime trihydate and 200mg of Pefloxacin mesylate working standard into 100 ml volumetric flask,
added 20 ml of methanol and sonicated to dissolve for 10 minutes and diluted to volume with methanol .Further 2.5 ml of the above solution is diluted to 100ml with methanol.
Absorptivity for drug was calculated by using following equation A (1%, 1cm).
Validation of Simultaneous Equation Method
The proposed methods were validated by studying parameters such as accuracy, precision, linearity, limit of detection (LOD), limit if quantitation (LOQ).
Linearity
Selection of linearity range
For each drug, appropriate aliquots of standard stock solutions were transferred to a series of 10
ml, volumetric flasks. The volume was made up to the mark with methanol to obtain standard solution for CEF, of concentrations 10-30 µg/mL and for PEF 20-70 µg/ml. The absorbance of each of these solutions were measured at the selected wavelengths i.e. 289 nm and 232 nm and plotted against their concentrations.
Fig. 6:-Calibration curve of Cefixime at 289 nm
Fig. 7:-Calibration curve of Pefloxacin at 232 nm
0.46 0.535
0.616 0.698
0.775 0.862 y = 0.0161x + 0.2961
R² = 0.9997
0 0.2 0.4 0.6 0.8 1
0 10 20 30 40
Linearity of Cefixime
0.355 0.418
0.483 0.551
0.625 0.696 y = 0.0068x + 0.2135
R² = 0.9991
0 0.2 0.4 0.6 0.8
0 20 40 60 80
Precision
Sample solution of substance 25 µg/ml. of CEF and 50 µg/ml of PEF were used for studying the degree of precision of the developed method. Repeatability is given by intraday and interday precision. Intraday precision was determined by analyzing the one concentration of drug for six times in the same day. Inter day precision was determined by analyzing the three different concentration of the drug daily for three days.
Accuracy
For accuracy of method, recovery studies were carried out by applying a known amount of standard CEF and PEF at a level of 80%, 100%, and 120% to the sample solution (standard addition method). Three determinations were performed at each level and the results obtained were compared with the expected results.
Limit of Quantitation and Limit of Detection
(LOD and LOQ)
The LOD and LOQ were calculated using following equations as per International conference on harmonization guideline,
LOD=3.3xσ/S LOQ=10xσ/S
Where σ is standard deviation of the response and S is the slope of regression equation.
RESULT AND DISCUSSION
Linearity
The linear regression data showed a good linear relationship over the concentration range of 10-35µg/ml. with correlation coefficient R2=0.999 and y=0.016 at 289 nm for Cefixime and R2=0.999 and y=0.006 at 230nm for Pefloxacin.
Results are shown in table and calibration curve are given in figure.
Table .1: - Standard calibration curve table for Cefixime and Pefloxacin
Sr. No. Conc.
(µg/mL)
Absorbance of
Cefixime Pefloxacin
Cefixime Pefloxacin 289 nm 232 nm
1 10 20 0.46 0.355
2 15 30 0.535 0.418
3 20 40 0.616 0.483
4 25 50 0.698 0.551
5 30 60 0.775 0.625
6 35 70 0.862 0.696
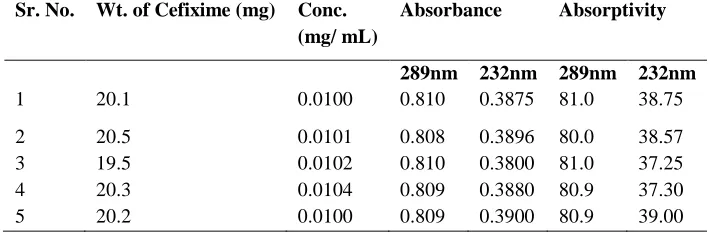
Table .2: - Comparative table for Cefixime and Pefloxacin Linearity
Sr. No. Parameter 289nm 232nm
CEF PEF
1 Beer’s Lambert (µg/mL.) 10-35 20-70
2 Regression Equation (y=mx+c) Y=0.006x+0.213 Y=0.016x+0.296
3 Correlation Coefficient ( R2) 0.999 0.999
4 LOD 0.6445 1.7187
Absorptivity
Table .3:-Absorptivity measurement of Cefixime Sr. No. Wt. of Cefixime (mg) Conc.
(mg/ mL)
Absorbance Absorptivity
289nm 232nm 289nm 232nm
1 20.1 0.0100 0.810 0.3875 81.0 38.75
2 20.5 0.0101 0.808 0.3896 80.0 38.57
3 19.5 0.0102 0.810 0.3800 81.0 37.25
4 20.3 0.0104 0.809 0.3880 80.9 37.30
5 20.2 0.0100 0.809 0.3900 80.9 39.00
Table .4:-Absorptivity measurement of Pefloxacin Sr. No. Wt. of Pefloxacin(mg) Conc.
(mg/ mL)
Absorbance Absorptivity
250nm 277nm 250nm 277nm
1 40.2 0.01000 0.223 0.375 22.3 37.5
2 40.5 0.01002 0.222 0.374 22.1 37.3
3 39.5 0.00996 0.225 0.376 22.5 37.7
4 40.2 0.00998 0.224 0.375 22.4 37.5
5 39.9 0.01028 0.224 0.372 22.4 37.2
Table .5: - Results of estimation of Cefixime and Pefloxacin in tablet formulation Sr.
No
Conc.
(µg/mL) (µg/mL) (µg/mL) (µg/mL)
Absorbance* Amount
found(mg)
%Amount found*
%RSD
CEF PEF CEF PEF CEF PEF CEF PEF CEF PEF
1 20 40 0.809 0.223 20.15 40.04 105 101 0.8587 0.2586
*Mean of 3 determinations
Precision
The precision and repeatability results showed %RSD less than 2%.The RSD values of CEF was found to be 0.56% and 0.148% of intraday and inter
day respectively and the RSD values of PEF was 0.053% and 0.054% of intraday and inter day respectively. This reveals that the given method is precise.
Table .6:-Determination of Intraday and Interday precision for CEF
Intraday precision of CEF Sr. No Conc.
(µg/mL)
Absorbance Amount Found(mg) %Amount Found
SD *%RSD
1 10 0.693 100.00 97.50 0.0030 0.56
Interday precision of CEF
1 10 0.629 100.00 99.80 0.1483 0.1484
Table .7:-Determination of Intraday and Interday precision for PEF Intraday precision of PEF
Sr. No Conc. (µg/mL)
Absorbance Amount Found(mg) %Amount Found
SD *%RSD
1 40 0.316 39.80 99.50 0.0519 0.0532
Interday precision of PEF
1 40 0.327 39.92 99.80 0.0529 0.0540
*Mean of 6 determination for intraday precision and Average of 3 determinations for Interday precision.
Accuracy
Recovery studies were carried out by applying a known amount of standard CEF and PEF at a level of 80%, 100%, and 120% to the sample solution
and the expected results are reported in the table 8. The results of recovery studies indicate the proposed method is highly accurate.
Table .8: - Accuracy of CEF at 289 nm
Sr. No. %Addition Conc.( (µg/mL) Absorbance Amount recovered %Recovered
1 80 8 0.544 5.44 78.52
2 100 10 0.688 6.88 99.23
3 120 12 0.839 8.39 121.00
Mean of 3 determinations
Table .9: - Accuracy of PEF at 232 nm
Sr. No. %Addition Conc.(µg/mL) Absorbance Amount recovered *%Recovered
1 80 5 0.436 4.36 79.53
2 100 10 0.545 5.45 99.39
3 120 15 0.661 6.61 120.53
*Mean of 3 determinations
LOD and LOQ
The LOD was found to be 0.6445µg/ml and 1.7187 µg/ml for CEF and PEF respectively and
LOQ was found to be 1.9531 µg/ml and 5.2083 µg/ml for CEF and PEF respectively.
Table .10:-Determination of CEF and PEF
Sr. No. Name Concentration.(µg/mL)
CEF PEF
1 Limit of detection (LOD) 0.6445 1.7187 2 Limit of Quantization(LOQ) 1.9531 5.2083
SUMMARY AND CONCLUSION
UV method was developed and validated as per ICH guidelines for the estimation of Cefixime and Pefloxacin.
For development of UV method for Cefixime and Pefloxacin methanol was used as solvent and detection wavelength were found to be at 289.0 nm and 232.80 nm respectively. The method was found to linear in concentration range 10-35 µg/mL for both drugs. The method was validated as per ICH guidelines. The precision and repeatability results
showed %RSD less than 2%. The LOD was found to be 0.6445µg/mL and 1.7187 µg/mL for CEF and PEF respectively and LOQ was found to be 1.9531 µg/mL and 5.2083 µg/mL for CEF and PEF respectively.
Based on the results observed, it was concluded that proposed method can be used for routine
analysis of Cefixime and Pefloxacin.
REFERANCES
[1]. British pharmacopoeia (B.P).Cefixime trihydrate, volume 1, 2010, 410-411.
[2]. .Martindale, Thirty –Sixth edition, Edited by Sean C Sweetman. Royal Pharmaceutical Society of Great Britain (RPS) Publishing, UK. 2009.
[3]. Bergogne-Brrrzin, E. Pefloxacin. International Journal of Antimicrobial Agents, 1, 1991, 29-46.
[4]. Goodman LS, Gilman AG, Rall TW, Nies AS, Taylor P, eds. Goodman and Gilman’s the pharmacological basis of therapeutics. New York: Pergamon Press, 8, 1990, 1057–60.
[5]. Clarke AM, Zemcov SJV, Campbell ME. In vitro activity of Pefloxacin compared to enoxacin, norfloxacin, gentamicin and new β-lactams. J Antimicrobial Chemother, 15, 1985, 39
[6]. Salem, H. Spectrofluorimetric, atomic absorption spectrometric and spectrophotometric determination of some fluoroquinolones. Am J Appl Sci, 2, 2005, 719–729.
[7]. Salem, H. Colorimetric and atomic absorption spectrometric determination of some fluoroquinolone derivatives. Sci Pharma, 72, 2004, 51–71.
[8]. Deng B, Li L, Shi A, Kang Y. Pharmacokinetics of Pefloxacin mesylate in human urine using capillary electrophoresis electrochemiluminescence detection. J Chromatogr B Analyt Technol Biomed Life Sci, 877(24), 2009, 2585-8.
[9]. Xie Y., Song Y, Zhang Y, Zhao B. Near-infrared spectroscopy quantitative determination of Pefloxacin mesylate concentration in pharmaceuticals by using partial least squares and principal component regression multivariate calibration. Spectrochimica Acta Part A: Molecular and Bimolecular Spectroscopy, 75(5), 2010, 1535-1539.
[10].Ahmad A. K. S., Kawy M. A., Nebsen M. Spectrophotometric and Spectrofluorimetric determination of Pefloxacin. Anal Lett, 30, 1997, 809–820.
[11].Jelikić-Stankov M, Veselinović D, Malesev D, Radović Z. Spectrophotometric determination of Pefloxacin in pharmaceutical preparations. J Pharm Biomed Anal, 7(12), 1989, 1571-7.
[12].Avadhanulu A B, Pantulu A R R. Spectrophotometric determination of Pefloxacin in its dosage forms. Indian Drugs, 31(6), 1994, 258-262
[13].Mostafa, S. El-Sadek M., Alla, E. A. Spectrophotometric determination of ciprofloxacin and Pefloxacin through charge transfer complexation. J Pharm Biomed Anal, 27, 2002, 133-142.
[14].Mostafa, S. El-Sadek M., Alla, E. A. Spectrophotometric determination of enrofloxacin and Pefloxacin through ion-pair complex formation. J Pharm Biomed Anal, 28, 2002, 173-180.
[15].Kuchekar B. S., Kale A. A. Shinde G. S. Shaikh A. M. Shinde D. B. Extractive spectrophotometric determination of pefloxacin in pharmaceutical dosage forms. Indian Drug, 40, 2003, 471-473.
[16].Basavaiah K., Prameela, H. C. Quantitative determination of pefloxacin mesylate by residual-base neutralization method. J Serb Chem Soc, 69, 2004, 403–410.
[17]. Radi A, El Ries MA, Kandil S. Spectroscopic and voltammetric studies of pefloxacin bound to calf thymus double-stranded DNA. Anal Bioanal Chem, 381(2), 2005, 451-455.
[18]. Basavaiah K, Prameela HC, Somashekar BC. Spectrophotometric determination of pefloxacin mesylate in pharmaceuticals. Acta Pharm, 57(2), 2007, 221-30.
[19].Beltagi AM. Determination of the antibiotic drug pefloxacin in bulk form, tablets and human serum using square wave cathodic adsorptive stripping voltammetry. J Pharm Biomed Anal, 31(6), 2003, 1079-88.
[20]. Uslu B, Topal BD, Ozkan SA. Electro analytical investigation and determination of pefloxacin in pharmaceuticals and serum at boron-doped diamond and glassy carbon electrodes. Talanta, 74(5), 2008, 1191-200.
[21].Montay G, Goueffon Y, Roquet E Absorption, distribution, metabolic fate, and elimination of pefloxacin mesylate in mice, rats, dogs, monkeys and humans. Antimicrob Agents Chemother 25, 1984, 463.
[23].Sullam, P M, Täuber, M G, Hackbarth, C J, Chambers, H F, Scott, K G, Sande, M A. Pefloxacin therapy for experimental endocarditis caused by methicillin-susceptible or methicillin-resistant strains of Staphylococcus aureus. Antimicrob Agents Chemother, 27(5), 1985, 685–687.
[24]. European Pharmacopoeia, 5th ed., European Directorate for the Quality of Medicines, Council of Europe, Strasbourg 2004, 2193-94. 32 British Pharmacopoeia, Her Majesty’s Stationery Office, 2(5), 2010, 1623-24 [25].Deng B, Li L, Shi A, Kang Y. Pharmacokinetics of pefloxacin mesylate in human urine using capillary
electrophoresis electro chemiluminescence detection. J Chromatogr B Analyt Technol Biomed Life Sci, 877(24), 2009, 2585-8. 16
[26].Xie Y., Song Y, Zhang Y, Zhao B. Near-infrared spectroscopy quantitative determination of Pefloxacin mesylate concentration in pharmaceuticals by using partial least squares and principal component regression multivariate calibration. Spectrochimica Acta Part A: Molecular and Biomolecular Spectroscopy, 75(5), 2010, 1535-1539.
[27].Sane RT, Dighe V, Bapat VV, Gangrade MG. Extractive colorimetric method for the determination of pefloxacin mesylate dihydrate from pharmaceutical preparations. Indian J Pharm Sci., 53, 1991, 64–6.
[28].Lacarelle B, Le Guellec C, Morel A, Albanese J, Alazia M, Ballereau M, Llurens M, Bruno R, Francois G, Durand A. Monitoring of pefloxacin serum concentrations in intensive care unit patients: comparison of a new immunoassay with high-performance liquid chromatography. Ther Drug Monit, 16(2), 1994, 209-13.
[29]. Montay G, Tassel JP. Improved high-performance liquid chromatographic determination of pefloxacin and its metabolite norfloxacin in human plasma and tissue. J Chromatogr, 339(1), 1985, 214–218.
[30]. Cochereau-Massin I, Bauchet J, Faurisson F, Vallois JM, Lacombe P, Pocidalo JJ. Ocular kinetics of pefloxacin after intramuscular administration in albino and pigmented rabbits. Antimicrob Agents Chemother, 35(6), 1991, 1112-5.