Vol. 5, No. 6 (2015): 1337-1343 Research Article
Open Access
I
ISSSSNN:: 22332200--66881100
Stability Indicating Method Development and
Validation for the Estimation of Residue of
Fingolimod by HPLC
M. Ramesh Babu
1,2* and V. Umamaheswararao
31
Aizant Drug Research Solutions Pvt.Ltd, Dulapally Village, Hyderabad-500 100, India.
2
Faculty of Pharmaceutical Sciences, Jawaharlal Nehru Technological University, Hyderabad-500 085, India.
3
CMR College of Pharmacy, Medchal Road, Hyderabad-501 401, India.
* Corresponding author: M. Ramesh Babu, e-mail: [email protected]
ABSTRACT
The purpose of the investigation was to develop a new RP-HPLC Method for estimation of Fingolimod in pharmaceutical dosage forms. Chromatography was carried out on an Zorbax Eclipse XDB C18, (150 mm x 4.6) mm, 5µm with a isocratic mobile phase composed of Buffer pH 2.5: Acetonitrile (50:50v/v) at a flow rate of 1.5 mL/min. The column temperature was maintained at 40°C and the detection was carried out using a PDA detector at 220 nm. Validation parameters such as system suitability, linearity, precision, accuracy, specificity, limit of detection (LOD), limit of quantification (LOQ), Stability of sample and standard stock solutions and robustness were studied as reported in the International Conference on Harmonization guidelines. The retention time for Fingolimod was 2.785 min. The percentage recovery of Fingolimod was 102.24%. The relative standard deviation for assay of capsule was found to be less than 2%. The Method was fast, accurate, precise and sensitive hence it can be employed for routine quality control of capsules containing drugs in quality control laboratories and pharmaceutical industries.
Keywords:
Fingolimod, ICH guidelines.1. INTRODUCTION
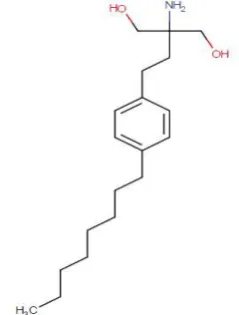
Fingolimod is a sphingosine 1-phosphate receptor modulator indicated and approved for the treatment of relapsing-remitting multiple sclerosis, 2-amino-2-[2-(4-octylphenyl) ethyl] propane-1, 3-diol. Its empirical formula is C19H33NO2. [1].
Fingolimod is a crystalline solid, with a molecular weight of 307.47g/mole. It is soluble in organic solvents like ethanol, DMSO and Dimethyl formamide and it is sparingly soluble in aqueous solutions. To enhance the aqueous solubility, add organic solvents to the aqueous solutions or buffers [2]. Fingolimod is classified as an NK1 antagonist because it blocks signals given off by NK1 receptors. This, therefore, decreases the likelihood of vomiting in patients. Emend is usually taken as a preventative for chemotherapy-induced nausea and vomiting, which is a serious side-effect
experienced by over 80% of patients who undergo chemotherapy [3-5].
Various HPLC assay Methods are also reported in the literature for the estimation of Fingolimod [6-10]. According to literature survey there is official Method for the estimation of Fingolimod by RP-HPLC in capsule dosage forms. Hence, an attempt has been made to develop better Method for estimation and validation of Fingolimod in formulation in accordance with the ICH guidelines [10-15].
2. MATERIALS AND METHODS
Instrumentation: Chromatography was performed
with waters 2695 HPLC provided with high speed auto sampler, column oven, degasser and & 2996 PDA detector to provide a compact and with class Empower-2 software.
Received: 01 December 2015 Accepted: 19 December 2015 Online: 21 December 2015
Reagents and chemicals: The reference sample of Fingolimod was provided as gift samples from Aizant Drug Research Solutions Pvt. Ltd, Hyderabad. HPLC grade acetonitrile, HPLC grade Methanol and all other chemicals were obtained from Merck chemical division, Mumbai. HPLC grade water obtained from Milli-Q water purification system was used throughout the study. Commercial formulation (Dosage: Fingolimod-0.5mg capsule).
Figure 1. Chemical structures of drugs investigated in this study.
Chromatographic condition: The chromatographic
separation was carried out under the isocratic conditions. Chromatographic separation was achieved by injecting a volume of 10μl of standard into Zorbax Eclipse XDB C18, (150 mm x 4.6) mm, 5µm column. The mobile phase composed of Buffer pH 2.5: Acetonitrile (50:50v/v) was allowed to flow through the column at a flow rate of 1.5 ml per minute for a period of 8 min at 400C column temperature. Detection of the component
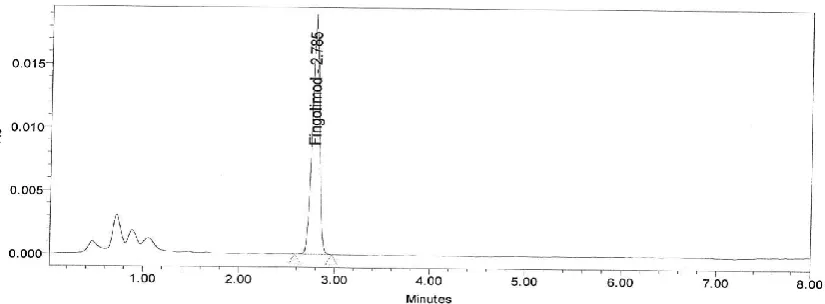
was carried out at a wavelength of 220 nm. The retention time of the component was found to be 2.785 min for Fingolimod.
Preparation of diluent solution: Diluent solution was prepared by Water and Methanol in the ratio of 50:50(v/v) and sonicates to degas for 5 minutes.
Preparation of standard stock solution: Weigh and transfer about 5 mg of AIZ17 working standard/ reference standard into 50 mL volumetric flask. Add about 30 mL of diluent and sonicate to dissolve for 10 minutes. Dilute to the volume with diluent and mix well, Pipette out 1 mL of stock solution into 10 mL volumetric flask, dilute to volume with diluent and mix well.
Preparation of Working Standard Solutions: A series
of Fingolimod solutions were prepared in the range of about LOQ to 150% of standard concentration.
Sample preparation: 1 capsule was weighed and
powdered and it was taken into a 10ml volumetric flask and made up with diluents and labeled as Sample stock solution. Sample stock solution was filtered by HPLC filters.2ml of filtered sample stock solution was
transferred to 10ml volumetric flask and made up with diluents.
Method validation:
System suitability tests: To ensure the resolution and reproducibility of the HPLC system was adequate for the analysis, a system suitability test was established. Data from six injections of 10 µL of the working standard solutions of Fingolimod was used for the evaluation of the system suitability parameters like tailing factor, the number of theoretical plates, retention time.
Linearity: A series of Fingolimod solutions were prepared in the range of about LOQ to 150% of standard concentration and injected into the HPLC system.
Linearity of detector response was established by plotting a graph between concentration and response of Fingolimod peak. The detector response was found to be linear from about LOQ to 150% of standard concentration. The correlation coefficient, squared correlation coefficient, slope, intercept, residual sum of squares was calculated by least square fit method.
Accuracy: Recovery studies by the standard addition Method were performed with a view to justify the accuracy of the proposed Method. Previously analyzed samples of Fingolimod to which known amounts of standard Fingolimod corresponding to LOQ, 50%, 100% and 150% of target concentration were added. The accuracy was expressed as the percentage of analyte recovered by the proposed Method.
Precision: Precision was determined as repeatability and intermediate precision (ruggedness), in accordance with ICH guidelines. The intra-day and inter-day precision were determined by analyzing the samples of Fingolimod. Determinations were performed on the same day as well as well as on consequent days.
Limit of detection and the limit of quantification:
Limit of detection (LOD) and limit of quantification (LOQ) of Fingolimod was determined by calibration curve Method. Solutions of both Fingolimod was prepared in linearity range and injected in triplicate. Average peak area of three analyses was plotted against concentration. LOD and LOQ were calculated by using following equations. LOD = (3.3 ×Syx)/b, LOQ= (10.0×Syx)/b
Where Syx is residual variance due to regression; b is slope.
Robustness: The robustness of Fingolimod was
performed by deliberately changing the chromatographic conditions. The organic strength was varied by ±5%, column temperature was varied by ±50c, flow rate was varied by ±0.2mL and the mobile
Stability:The sample and standard solutions injected at 0 hr (comparison sample) and after 24 hr (stability sample) by keeping at ambient room temperature. Stability was determined by determining %RSD for sample and standard solutions.
Degradation studies:
Oxidation:
To 1 ml of stock solution of Fingolimod, 1 ml of 20% hydrogen peroxide (H2O2) was added separately. The solutions were kept for 30 min at 600c. For HPLC study,
the resultant solution was diluted to obtain 10µg/ml solution and 10 µl were injected into the system and the chromatograms were recorded to assess the stability of sample.
Acid Degradation Studies:
To 1 ml of stock s solution Fingolimod, 1ml of 2N Hydrochloric acid was added and refluxed for 30mins at 600c .The resultant solution was diluted to obtain
10µg/ml l solution and 10 µl solutions were injected into the system and the chromatograms were recorded to assess the stability of sample.
Alkali Degradation Studies:
To 1 ml of stock solution Fingolimod, 1 ml of 2N sodium hydroxide was added and refluxed for 30mins at 600c.
The resultant solution was diluted to obtain 10µg/ml solution and 10 µl were injected into the system and the chromatograms were recorded to assess the stability of sample.
Dry Heat Degradation Studies:
The standard drug solution was placed in oven at 1050c
for 6 h to study dry heat degradation. For HPLC study, the resultant solution was diluted to 10µg/ml solution and10µl were injected into the system and the chromatograms were recorded to assess the stability of the sample.
Photo Stability studies:
The photochemical stability of the drug was also studied by exposing the 100µg/ml solution to UV Light and visible by keeping the beaker in UV Chamber for 7days or 200 Watt hours/m2 in photo stability chamber.
For HPLC study, the resultant solution was diluted to obtain 10µg/ml solutions and 10 µl were injected into the system and the chromatograms were recorded to assess the stability of sample.
Neutral Degradation Studies:
Stress testing under neutral conditions was studied by refluxing the drug in water for 6hrs at a temperature of 60º. For HPLC study, the resultant solution was diluted to 10µg/ml solution and 10 µl were injected into the system and the chromatograms were recorded to assess the stability of the sample.
Statistical analysis:
Wherever applicable, results were expressed as the Mean±SD, %RSD and data were analyzed statistically by using t- test with aid of Microsoft excel-2007 software and data were considered not significantly different at 5% significance level of probability P ≤0.05.
(a)
(b)
Figure 3. Chromatograms of Blank (a) and spiked (b)
3. RESULTS AND DISCUSSION
Fingolimod method development:
Initially reverse phase liquid chromatography separation was tried to develop using various ratios of Methanol and Water, Acetonitrile and Water as mobile phases, in which drugs did not responded properly, and the resolution was also poor. The organic content of mobile phase was also investigated to optimize the separation of both drugs. To improve the tailing factor, the pH of mobile phase becomes important factor. Thereafter, 0.05N phosphate buffer (pH 2.5): Acetonitrile were taken in isocratic ratio: 50:50 and with flow rate of 1.5 mL/min was employed. Zorbax Eclipse XDB C18, (150 mm x 4.6) mm, 5µm was selected as the stationary phase to improve resolution and the tailing of both peaks were reduced
considerably and brought close to 1. To analyze drug detection were tried at wavelengths 220nm. Fingolimod showed maximum absorption at 220nm of wavelength and 220 nm was selected as the detection wavelength for PDA detector. The retention times were found to about 2.785 min for Fingolimod. The chromatogram obtained was shown in the Fig. 2.
Fingolimod method Validation:
System suitability and Specificity: System suitability parameters such as number of theoretical plates, peak tailing, and retention time was determined. The total run time required for the method is only 6 minutes for eluting Fingolimod. The results obtained were shown in Table No.1. The chromatogram obtained for blank and spiked was shown in the Fig. 3.
Table 1: System suitability of Fingolimod
SYSTEM SUITABILITY PARAMETERS FINGOLIMOD
No of theoretical plates 5125
Tailing Factor 1.0
RT 2.785 min
Mean Area 98376
%RSD 0.5
Table 2: Results of accuracy of Fingolimod
Sample % spiked level Amount added (ppm) Amount
Recovered (µg/ml) Recovery (%) % RSD
Fingolimod
LOQ 0.27 0.29 107.3 3.2
50 4.47 4.79 107.2 0.4
75 6.71 6.26 99.6 3.1
100 9.12 9.43 103.4 2.5
Accuracy:To pre analyzed sample solution, a definite concentration of standard drug (LOQ, 50%, 100% & 150 % level) was added and recovery was studied. The % Mean recovery for Fingolimod is 102.24% and these results are within acceptable limit of 98-102. The %
RSD for Fingolimod was 0.64 and %RSD for Fingolimod is within limit of ≤2, hence the proposed method is accurate and the results were summarized in Table No.2.
Table 3: Results of Precision for Fingolimod Repeatability data Inter day precision
S. No. Fingolimod Sr. No. Fingolimod
1 98719 1 98159
2 98583 2 97583
3 99017 3 99127
4 98318 4 98018
5 98136 5 98756
6 97486 6 97886
Mean 98376.5 Mean 98255
%RSD 0.5 %RSD 0.59
Precision: Repeatability: Six replicates injections in same concentration (10μg/ml of Fingolimod) were analyzed in the same day for repeatability and the % RSD for Fingolimod found to be 0.5 and % RSD for Fingolimod found to be within acceptable limit of ≤2 and hence method is reproducible and the results are shownin Table No. 3.
Intermediate Precision: Six replicates injections in same concentration were analyzed on two different days with different analyst and column for verifying the variation in the precision and the % RSD for Fingolimod is found to be 0.59 and it is within acceptable limit of ≤2. Hence the Method is reproducible on different days with different analyst and column. This indicates that the method is precise and the results are as shown in Table No. 3.
Table 4: Results of Robustness for Fingolimod
Table 5: Linearity results of Fingolimod % Linearity level Concentration (ppm) Response
LOQ 0.2682 2934
10 0.894 13051
50 4.47 49576
75 6.705 72479
100 8.94 97850
125 11.175 121764
Correlation coefficient (r) : 0.999776913 Slope : 10788.43774 Intercept : 1357.215838 Residual sum of squares : 17454377107 Square of correlation co-efficient (r2) : 0.9999776913
%-Y intercepts bias at 100% conc. : 1.38703
Table 6: Results of stock solution stability for Fingolimod.
Drug %Assay at 0 hr %Assay at 24 hr %Deviation
FINGOLIMOD 103.4 102.25 1.2
Table 7: Results of HPLC Analysis of capsule for Fingolimod
Label amount (mg) Amount found(mg) n=6 %Assay (Mean±SD) RSD
0.5 0.510 102.01±1.24 1.25
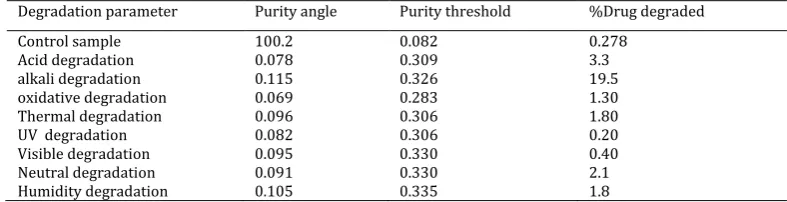
Table 8: Results of HPLC Degradation of Fingolimod.
Degradation parameter Purity angle Purity threshold %Drug degraded
Control sample Acid degradation alkali degradation oxidative degradation Thermal degradation UV degradation Visible degradation Neutral degradation Humidity degradation 100.2 0.078 0.115 0.069 0.096 0.082 0.095 0.091 0.105 0.082 0.309 0.326 0.283 0.306 0.306 0.330 0.330 0.335 0.278 3.3 19.5 1.30 1.80 0.20 0.40 2.1 1.8
Robustness: The robustness was established by
changing the flow rate, column temperature, pH of buffer and composition of the mobile phase within allowable limits from actual chromatographic conditions. It was observed that there were no marked change in mean Rt and RSD is within limit of ≤2 .The
tailing factor, resolution factor and no. of theoretical plates are found to be acceptable limits for Fingolimod. Hence the Method is reliable with variations in the analytical conditions and the result of Fingolimod was shown in Table 4.
Linearity:Fingolimod showed a linearity of response between 0.2-15 μg/mL. These were represented by a linear regression equation as follows: y (Fingolimod) =10788X + 1357 (r2=0.999) and
regression line was established by least sqsuares method and correlation coefficient (r2 ) for Fingolimod
is found to be greater than 0.999. Hence the curves established were linear (Table 5).
Stability of sample solution: The sample solution injected after 24 hr by keeping at ambient room temperature 30OC did not show any appreciable
change. The % Deviation in the assay is not more than 2 and the results are shown in table-6.
LOD and LOQ:LOD and LOQ for Fingolimod were 0.1 and 0.3 μg/mL respectively. The lowest values of LOD and LOQ as obtained by the proposed Method indicate that the Method is sensitive.
Capsule Analysis: The Content of Fingolimod in the capsules was found by the proposed method. RSD values for both Fingolimod was within limit of ≤2 and the results were shown in Table No. 7.
Degradation studies: The degradation studies for
Fingolimod was performed by various conditions like Acid, Alkali, Oxidation, Thermal, Photolytic UV, visible, Humidity and Neutral Degradation Studies and their limits like purity angle and purity threshold values like purity angle< purity threshold and the results shown in table no.8
4. CONCLUSION
A new precise accurate and simple HPLC Method was developed and validated for estimation of Fingolimod pharmaceutical dosage form. This Method is fast, accurate, precise and sensitive hence it can be employed for routine quality control of capsule containing drug in QC laboratories and industries.
5. REFERENCES
1. Ramesh M G, Channaveerayya H, process for producing
fingolimod salts.U.S. Patent US20120184617, 2012.
2. fingolimod hydrochloride. The American Society of
Health-System Pharmacists. 2015.
3. Sanford M, Fingolimod a review of its use in
relapsing-remitting multiple sclerosis. Drugs 74 (12): 1411–33.
4. Chiba, K., et al. 1998. J. Immunol. 160: 5037-5044.
5. Brinkmann, V., et al. 2002. Curr. Opin. Immunol. 14: 569-575.
6. Effat S, mohammad Z. Sci pharm. 2015; 83: 85–93.
7. Nagaraju Ch. V. S. Der pharma chemical. 2014, 6(2):335-342.
9. Kathiresan K, bhagath K R M. Int j pharm pharm sci, 4(1) 289-292.
10.Rajan N. Anver B K Original Chromatographia. 2014
77(21):1545-1552.
11.ICH (2000) Stability testing of new drug substances and
products (Q1AR). International conference on
harmonization, IFPMA, Stability Testing of New Drug Substances and Products: Geneva.
12.ICH, Q1A (R2) Stability Testing of New Drug Substances and
Products, International Conference on Harmonization, Geneva, (2003).
13.ICH, Q1B Stability Testing: Photo stability Testing of New
Drug Substances and Products, International Conference on Harmonization, Geneva, (1996).
14.Maheshwaran, R., FDA Perspectives: Scientific
Considerations of Forced Degradation Studies in ANDA Submissions, Pharmaceutical Technology, 2012: 36, 73-80.
15.Snyder, L.R., Kirkland, J.J., Glajch, J.L., Practical HPLC Method
Development, 2nd ed., Wiley, New York, (1997).
*****