Development and validation of RP-HPLC method for simultaneous estimation of gliclazide and metformin in pure and tablet dosage form
8
0
0
Full text
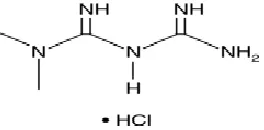
(2) Nirupama.D, et al / Int. J. Pharm. & Analytical Res. Vol-3(4) 2014 [326-333]. required for metformin's inhibitory effect on the production of glucose by liver cells. AMPK probably. also plays a role, as metformin administration increases AMPK activity in skeletal muscle.. Figure 2: chemical structure of metformin precise, accurate, sensitive, specific, and robust, and The objective of this study was to develop reverse therefore suitable for routine analysis. phase high performance liquid chromatography method for the simultaneous estimation of gliclazide3 and MATERIALS AND METHOD metformin in pure and pharmaceutical dosage form HPLC Instrumentation and chromatographic without any derivatization4 and having the short conditions retention time. The method was found to be linear, The analytical separations were carried out on a waters six 10ml volumetric flasks 1, 2, 4, 6, 8, 10ml were 2487 HPLC system with Photo Diode Array detector. transferred and diluted to 10ml with diluents, that gave The output of signal was monitored and integrated 62.5, 125, 250, 375, 500 and 625 µg/ml of Metformin using LC-solutions 2000 software. The analytical and 10, 20, 40, 60, 80, and 100 µg/ml of Gliclazide. column was phenomex (kromosil-250mm× 4.6mm,5μm).Mobile phase consisted phosphate Preparation of sample solution buffer(pH-6.5) and methanol in the ratio of 60:40. 20 tablets of combined formulation of Metformin and Mobile phase was mixed, filtered through 0.45μ Gliclazide were weighed, average weight was membrane filter and degassed under ultrasonication. calculated and triturated in a mortar with pestle from The mobile phase was used as diluent. The flow rate that, powder equivalent to 62.5 mg of Metformin and was 1.0ml/min and runtime was 7minute. The column 10 mg of Gliclazide was weighed and dissolved in was maintained at ambient temperature. UV detection diluent and test concentration was prepared by further was measured at 230nm and the volume of sample dilution with same. injected was 10μl.. RESULTS AND DISCUSSION Preparation of mobile phase. HPLC method development and optimization. Accurately weighed portion of 2.722g of potassium dihydrogen orthophosphate was dissolved in 200 ml of HPLC water. Separately 700mg of di-sodium hydrogen orthophosphate was weighed and dissolved in 20ml of HPLC water, the pH adjusted to 6.5 using disodium hydrogen ortho phosphate, and then the solution was filtered through a 0.22µm filter membrane and stored in closed container.. To optimize the chromatographic conditions, different columns, mobile phases, flow rates etc., were tested. Buffer and methanol in the ratio of 60:40 was preffered as mobile phase. Because it resulted in a greater response to gliclazide, metformin after several preliminary investigatory runs compared with the different mobile phase combinations. The effect of the flow rate was studied in the range 0.9 to 1.1ml/min and 1.0ml/min was preffered to be effective. Under these conditions, the analyte peak obtained was well-defined and free from tailing. The retention time(RT) was found to be 5.0 and 3.2min. The optimized chromatographic parameters5 were listed in table 1.. Preparation of standard stock solution Accurately weighed 62.5mg of Metformin and 10mg of gliclazide was dissolved in diuent, in 100 ml volumetric flask, that gave 625 µg/ml of Metformin and 100 µg/ml of Gliclazide1. From this into a series of. www.ijpar.com. ~ 327~.
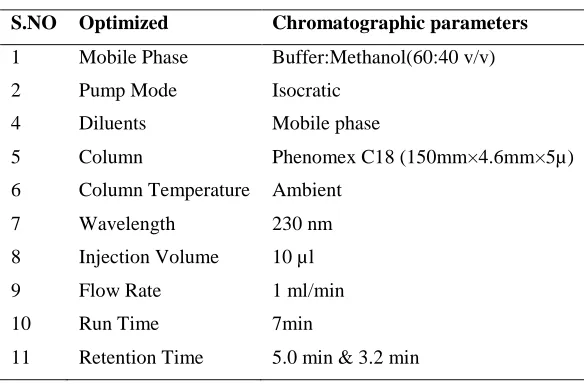
(3) Nirupama.D, et al / Int. J. Pharm. & Analytical Res. Vol-3(4) 2014 [326-333]. Fig 1: optimized chromatogram Table 1: Optimized chromatographic parameters S.NO. Optimized. Chromatographic parameters. 1. Mobile Phase. Buffer:Methanol(60:40 v/v). 2. Pump Mode. Isocratic. 4. Diluents. Mobile phase. 5. Column. Phenomex C18 (150mm×4.6mm×5µ). 6. Column Temperature. Ambient. 7. Wavelength. 230 nm. 8. Injection Volume. 10 µl. 9. Flow Rate. 1 ml/min. 10. Run Time. 7min. 11. Retention Time. 5.0 min & 3.2 min. VALIDATION OF THE METHOD When method development and optimizations are complete, it is necessary to accomplish method validation6. the validation studies include linear range (Correlation coefficient), method precision (RSD,%), method accuracy (%Recovery and RSD%), sensitivity studies (LOD & LOQ), and robustness.. performance of the chromatographic system. Retention time (RT), tailing factor(T), and peak asymmetry (AS), resolution (RS) were evaluated. The system suitability test was performed before analysis of sample. The system suitability method acceptance criteria set in each validation run were: capacity factor>2.0; tailing factor <2.0 and theoretical plates>2000. In all cases, the relative standard deviation(R.S.D) for the analytic peak area for two consecutive injections was <2.0%. system suitability parameters were shown in table 2.. System suitability studies System-suitability tests are an integral part of method development and are used to ensure adequate. Table 2: system suitability parameters parameters. gliclazide. metformin. Retention time. 5.0. 3.2. www.ijpar.com. ~ 328~.
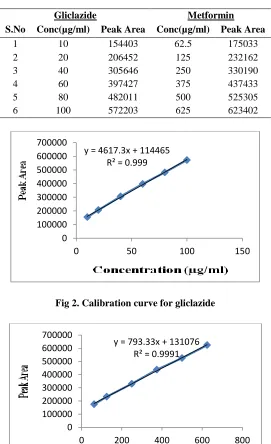
(4) Nirupama.D, et al / Int. J. Pharm. & Analytical Res. Vol-3(4) 2014 [326-333]. Linearity observed with (R2)=0.999, (Figure.3). the regression equation was found to be Y=4617.x + 11446 and Y=793.3x + 13107 respectively. The statistical data are presented in table 3. And the calibration curve was shown in figure 3.. The linearity of the method was evaluated by preparing six series of standard solutions of gliclazide and metformin in the range of 10-100 µg/ml, 62.5625µg/ml in mobile phase and injecting the solution into the HPLC system. Excellent correlation between gliclazide, metformin peak area and concentration was. Table 3: linearity results for gliclazide and metformin. S.No 1 2 3 4 5 6. Gliclazide Conc(µg/ml) Peak Area 10 154403 20 206452 40 305646 60 397427 80 482011 100 572203 700000 600000 500000 400000 300000 200000 100000 0. Metformin Conc(µg/ml) Peak Area 62.5 175033 125 232162 250 330190 375 437433 500 525305 625 623402. y = 4617.3x + 114465 R² = 0.999. 0. 50. 100. 150. Fig 2. Calibration curve for gliclazide 700000 600000 500000 400000 300000 200000 100000 0. y = 793.33x + 131076 R² = 0.9991. 0. 200. 400. 600. Fig 3. Calibration curve for metformin. www.ijpar.com. ~ 329~. 800.
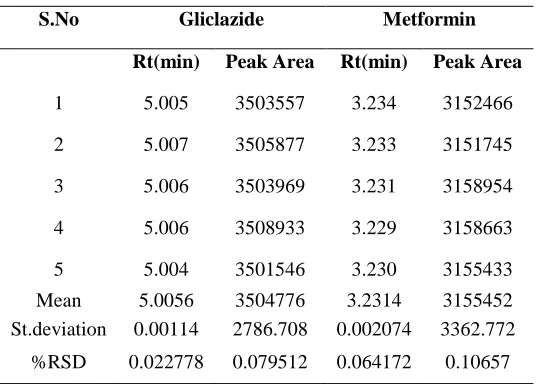
(5) Nirupama.D, et al / Int. J. Pharm. & Analytical Res. Vol-3(4) 2014 [326-333]. Precision System precision(Repeatability). percent relative standard deviation7 (%RSD) for peak responses was calculated. Results of system precision studies were shown in table 4.. To study precision, five replicate standard solutions of gliclazide (40µg/ml), metformin(250µg/ml) were prepared and analyzed using the proposed method. The. Table 4: system precision results for gliclazide and metformin S.No 1 2 3 4 5 Mean St.deviation %RSD. Gliclazide Rt(min) Peak Area 4.975 350236 4.962 350654 4.943 350693 4.965 350398 4.978 350451 4.9646 350486.4 0.013795 188.7731 0.277866 0.05386. Metformin Rt(min) Peak Area 3.234 315642 3.233 315371 3.231 315598 3.239 315877 3.221 315668 3.2316 315631.2 0.006618 180.7587 0.204795 0.057269. Method. Precision (Reproducibility). The intraday and inter-day precision of the proposed method was determined by analyzing the correspomding responses 6 times of the same day and on different days for concentration of 10µg/ml of. gliclazide and 100µg/ml of metformin. The results was reported in terms of relative standard deviation (%RSD), results of method precision studies were shown in table 5.. Table 5: Method precision results for gliclazide and metformin S.No. Gliclazide. Metformin. Rt(min). Peak Area. Rt(min). Peak Area. 1. 5.005. 3503557. 3.234. 3152466. 2. 5.007. 3505877. 3.233. 3151745. 3. 5.006. 3503969. 3.231. 3158954. 4. 5.006. 3508933. 3.229. 3158663. 5. 5.004. 3501546. 3.230. 3155433. Mean St.deviation. 5.0056 0.00114. 3504776 2786.708. 3.2314 0.002074. 3155452 3362.772. %RSD. 0.022778. 0.079512. 0.064172. 0.10657. Intermediate precision The intermediate precision of the proposed method was determined by performing the method by two analysts. (Analyst 1 and Analyst 2) for concentration of sample solutions of gliclazide (40µg/ml), metformin. (250µg/ml). The percent relative standard deviation (%RSD) for peak responses was calculated. The results for intermediate were shown in table 6.. www.ijpar.com. ~ 330~.
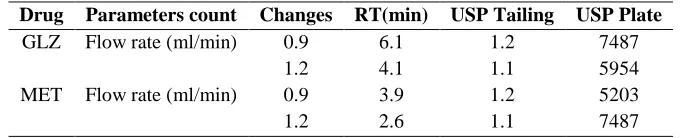
(6) Nirupama.D, et al / Int. J. Pharm. & Analytical Res. Vol-3(4) 2014 [326-333]. Table 6: results of intermediate precision for gliclazide, metformin. Repeatability (% RSD) (n=6) GLZ MET. Intermediate precision (% RSD) (n=6) Day 1 Day 2 Analyst 1 Analyst 2 Analyst 1 Analyst 2 0.0815 0.0398 0.0632 0.0808 0.0777 0.0128 0.0521 0.0636. Accuracy Accuracy of the method was confirmed by the standard addition method, which was carried out by performing recovery studies at different concentrations are accordance with ICH guidelines, by replicate analisis. (n=3). The closeness of obtained value to the true value indicates that the proposed method is accurate. Recovery studies were shown in table 7.. Table 7: Results of recovery studies for gliclazide, metformin Sample. GLZ. MET. Spiked Amount. (mg). % Recovered. 20. Recovered Amount (mg) 19.76. 40 60 125 250 375. 40.03 60.01 125.02 250.01 375.01. 100.03 100.006 100.7 100.27 101.07. % Average Recovery. 99.54 99.90. 100.06. . Robustness The robustness study was performed to evaluate the influence of small but deliberate variation in the chromatographic condition, the robustness was checked by changing parameters like flow rate of mobile phase and detection wavelength.. Change the dection wavelength ± 2nm(228nm and 232nm) Change in flow rate by ± 0.2ml/minute (1.1ml/min and 0.9ml/min) After each change, sample solution was injected and %assay with system suitability parameters were checked. Robustness values were given in table 8.. Table 8: results of robustness for gliclazide and metformin Drug GLZ. Parameters count Flow rate (ml/min). MET. Flow rate (ml/min). Changes 0.9 1.2 0.9 1.2. RT(min) 6.1 4.1 3.9 2.6. USP Tailing 1.2 1.1 1.2 1.1. USP Plate 7487 5954 5203 7487. Limit of Detection and Quantitation Detection and quantitation limit were calculated by the method based on the standard deviation and slope of the calibration plot, using the formula.. Limit of Detection = 3.3×σ/S, Limit of Quantitation=10×σ/S. Where, σ = the standard deviation of the response and S = slope of the calibration curve.. www.ijpar.com. ~ 331~.
(7) Nirupama.D, et al / Int. J. Pharm. & Analytical Res. Vol-3(4) 2014 [326-333]. Table 9: Results if LOD, LOQ for gliclazide, metformin Name of drug LOD (µg/ml) LOQ (µg/ml) 0.0750μg/ml 0.2273μg/ml GLZ 0.6557μg/ml 1.9872μg/ml MET. Specificity Specificity of an analytical method is its ability to measure the analyte accurately and specifically in the presence of component that may be expected to be present in the sample matrix. Chromatograms of standard and sample solutions were compared in order to provide an indication of specificity of the method.. Sample. GLZ. MET. Assay The proposed validated method was successfully applied to determine gliclazide, metformin in their pharmaceutical dosage form and the % assay results were shown in table 10.. Table 10: Results of % assay by using RP-HPLC method Spiked Amount (mg) Recovered % Recovered % Assay Amount (mg) 20 19.76 99.54 99.90 40 40.03 100.03 60 60.01 100.006 125 125.02 100.7 100.06 250 250.01 100.27 375 375.01 101.07. CONCLUSION A simple, rapid, accurate, and precise RP-HPLC method for the analysis of gliclazide and metformin in pure and in pharmaceutical dosage forms had been developed and validated in accordance with ICH guidelines. The RP-HPLC method developed is costeffective due to short retention time which enabled analysis of gliclazide and metformin samples with a small amount of mobile phase. From the%RSD values of precision and recovery studies the method was found. to be precise and accurate. The low detection and quantification limits achieved indicate the method is very sensitie. The robustness data gathered during method validation showed that the method is not susceptible to small changes in chromatographic conditions, the proposed RP-HPLC method developed by the author is suitable for routine analysis ana quality assessment of gliclazide, metformin in pharmaceutical products.. Table 11: summary of validated parameters for proposed method Parameters GLZ MET Linearity (µg/ml) 10-100 62.5-625 Regression equation 4617.x + 11446 793.3x + 13107 Slope (m) 4617 793.3 Intercept (C) 11446 13107 Correlation coefficient (r2) 0.999 0.999 Method precision (%RSD, n=5) 0.06 0.10 LOD (µg/ml) 0.0750μg/ml 0.2273μg/ml LOQ (µg/ml) 0.6557 μg/ml 1.9872μg/ml % Assay 99.89% 99.98%. www.ijpar.com. ~ 332~.
(8) Nirupama.D, et al / Int. J. Pharm. & Analytical Res. Vol-3(4) 2014 [326-333]. REFERENCES [1] Bhagyashri V. Vadnere, Aarti M. Jain and Priyanka S. Jadhav, Prof. S. P. Patil, Dr. S. D. Barhate have developed and validation for the simultaneous estimation of gliclazide metformin and in tablet dosage form by RPHPLC.Journal of Pharmacy Research 2012, 5(10), 5036-5038. [2] http://en.wikipedia.org/wiki/Metformin. [3] http://en.wikipedia.org/wiki/Gliclazide. [4] Edigasasikirangoud, V.Krishna Reddy, Chandra K Sekharhave developed andvalidation for the simultaneous estimation of metformin and gliclazide in tabletdosage form by RP-HPLC. International Journal of Pharmacy and Biological Sciences,Volume 2, Issue 4, OCT-DEC-2012 [5] A.anusha, N.Prajwala. M.Sandhya, Dr.UmaMaheswara Rao have developed and validation for the simultaneous estimation of metformin and gliclazide in tablet dosage form by RP-HPLC. International Journal of Pharmacy and Pharmaceutical Sciences, Volume- 5, Suppl 4, 2013 [6] KanijFatema, Md.zakirRahman, TasnuvaHaque, Mohammad abulkalamazad, and Md.selimreza, Development and validation of a simple method for simultaneous estimation of Metformin hydrochloride and gliclazide in tablets by using RP-HPLC, Dhaka UnivJ.PharmSci , 2010, 9(2) : 83-89 [7] B.V.V.Ravikumar, A.K. Patnaik, Saroj Kumar Raul, NagireddyNeelakanta Rao Development and Validation of a simple method for the Estimation of Gliclazide in bulk and Pharmaceutical Dosage Forms by RP-HPLC. Journal of Applied Pharmaceutical Science Vol. 3 (04), pp. 059-062, April, 2013.. www.ijpar.com. ~ 333~.
(9)
Figure
+3

Related documents
Conclusions: The findings from this study indicate the importance of “ pushing ” active classroom teachers from the design to the mapping arena by instituting curriculum
Abstract: This paper consists of the design and implementation of a simple conditioning circuit to optimize the electronic nose performance, where a temperature modulation method
Walachowski S, Dorenlor V, Lefevre J, Lunazzi A, Eono F, Merbah T, Eveno E, Pavio N, Rose N (2014) Risk factors associated with the presence of hepatitis E virus in livers
The purpose of this study is to characterize the very eld- erly population, who received emergency general surgery, and examine their surgical outcomes including identifica- tion
attenuated virus, as it is clear from the tissue culture studies that this virus replicates well; direct comparisons in which the two isolates are used to infect a compatible cell
When growth was visible on SC-Met-His and SC-Met-Cys-His plates in the high- throughput C2H screen, indicating potential PPI, the corresponding bait- and prey- harboring strains
Here, using simulation benchmarks and two case studies, we demonstrate the utility of preprocessing sparse microbiome data sets with matrix completion to allow com-
(G) Localization of the kinetochore (mCherry–CENP-A) with respect to the nuclear envelope (GFP-Ndc1) does not change in sad1 null cells compared to the wild-type cells, in
