ISSN: 2306-9007 Honarbakhsh, Hamid & Barjandi (2013) 65
The Effects of Dividend Policy on Market Value on Companies
Listed In Tehran Stock Exchange
SAMIRA HONARBAKHSH
Department of accounting, Zarindasht Branch, Islamic Azad University, Zarindasht, Iran Email: Honarbakhsh_88@yahoo.com
Tel:+989172596344
HAMID BIRJANDI
(Corresponding author)Department of accounting, Fasa Branch, Islamic Azad University, Fasa, Iran Email: H.birjandi63@gmail.com
Tel:+989179308625
MASOUD BIRJANDI
Department of commercial management, Larestan Branch, Islamic Azad University, Larestan
,
Iran Email: Masoud.birjandi2010@gmail.comTel:+989383323394
Abstract
This study investigates the effects of dividend policy on market value. Empirically the research data is collected from 45 firms in the Tehran Security Exchange (TSE) during 2006-2011.Multiple regressions technique is used for examining the stated hypotheses. It is used for, three Ohlson equity valuation models. The first model is based on permanent earning and the second model is based on expected future earnings and, finally, the third model is based on current earnings. The relationship between earnings and dividends has content information for evaluation of the companies. In order to examine the hypotheses, data is collected from the annual reports of the companies using official bulletins of the Tehran stock exchange, mainly, through Novin software, Tadbir Pardaz software, and stock sites such as www.rdis.ir. The results indicate that based on the models, debt, permanent income and, the net operating cash flows, debt and investment, , investments and debt are associated with stock prices, significantly and positively and all samples are selected, .It also confirms that the results of the comparison of three models, anatomical features and the ability of the models to predict the market value are more important than the other two models .This research provided a good chance to examine the effects of dividend policy on company's market value. Meanwhile, it took into consideration whether other control mechanisms such as firm’s size have any effects on this relationship.
Keywords
: dividend policy, the company's market value, equity valuation models Ohlson.1. Introduction
Most researches on securities valuation focus on net income and book value (composition of them as the main factors determining the value (price), less dividend policy and its relation to the stock market. Ohlson (1995) model of equity valuation was expanded based on the theoretical framework of the dividend Modigliani and Miller (1961). He claimed that when dividends are paid, book value of equity decreases. However, no impact is reported on current earnings. Therefore, the current market value of the company's dividend policy is not affected. Consequently, recently, equity valuation models based on Ohlson (1995) ordered to investigate the broader issues related to assess interest rate, risk and the relationship between earnings and stock price.
I
www.irmbrjournal.com March 2013I
nternationalR
eview ofM
anagement andB
usinessR
esearchVol. 2 Issue.1
ISSN: 2306-9007 Honarbakhsh, Hamid & Barjandi (2013) 66 In this study, three models of equity valuation have been stated based on Ohlson (1995). The first-ordered model, based on permanent earning, the second model is based on earnings from present discounted value in expected future . Finally, the third model is based on current earning. The permanent earning hypothesis uses dividend adjustments. The permanent earning hypothesis components form the present discounted value of expected future earnings, are represented by the permanent earning, without considering the volatile components of earnings and dividends that are used to adjust quickly. Gordon dividend growth model is based on accounting data. He (1962) believed, stock dividends affect recommendations to increase the value of observational management that companies must have for a high rate of dividend payment. And the relationship between stock prices and earnings components of the permanent, components of the discounted value of expected future earning and the current earnings components which are now being investigated, in the present study, to determine the predictability and Anatomical Model that are empirically examined. Features of this model are as follows:
Model 1:It considers dividend as a fraction of the permanent component of earnings.
Model 2: It considers dividend as a fraction of the present discounted value of expected future earnings. Model 3:It considers dividend as a proportion of the current earnings.
2. Literature Review
Gordon (1959) argued that dividend policy affects the company's cost of capital and this supports the view that the higher rates of paid dividends, cover more cost of capital Modigliani and Miller (1961) Texted analysis of capital to draw the policy to pay dividends. They argued that as long as the company's cash flow distribution is stable and there is no tax effect, choosing a policy of paying dividends on the stock market value has no effect. In their analysis, there was the increased profits from the sale of shares of new stock supply.( Ohlson ,1995), There was also the residual income valuation model based on earnings, book value of assets and development rights to owners of capital. Ohlson's model under the framework of the theory is developed in relation to dividends. He claimed dividends are paid, current book value of equity will be reduced, but it does not affect current earnings. The claims concerning that his theory of dividends Modigliani and Miller(1961) is consistent. Barclay,(1995) after numerous studies, three factors will be discussed as determinants of corporate dividend policy; (1) the amount of investment opportunities, (2) the effects of a updates and changes in cash dividends (3) firm size. In their model, the cash dividend yield on the dividend policy is intended as a substitute variable. Bar&Callen (1996)' dynamic data, the model Ohlson discovered and found that earnings, book value of assets, equity and dividend, in a period of time, the dynamic information in connection with the evaluation of the equity are important.
Lee& Frankel (1998) found that, if the estimated market value of companies is Ohlson evaluation model and the investment decisions are taken, a higher efficiency can be occupied for periods of one, two or three more years. Lo& Lys(2000)studied Ohlson literary model, and showed that the evaluation model developed by Ohlson on the accounting items have an impact on financial information and market research.
Other research and theories was conducted about the determinants of dividend policy by( Beiner, 2001) to test this model that had presented in previous research. His research makes clear that the dividend yield on Swiss companies are associated with a dividend yield profits each year.This is consistent with the theory of smoothing. Meanwhile, investment opportunities and firm size, the Swiss company has an inverse relationship with income distribution.
Yun-sheng & et al (2005) were investigated three model of equity valuation models Ohlson, the relationship between earnings, dividends and dividend information content in the evaluation of the company. Experimental results of their research developed for the three models shows that, the Model 2 anatomical features and the ability are better to predict stock price. Also, all three models, book value of equity, debt and investments price of stock are related to each other for the total sample.
ISSN: 2306-9007 Honarbakhsh, Hamid & Barjandi (2013) 67 Balachandrak & &et al (2007) Reducing the impact of dividends on the wealth of shareholders and the stock price reaction to dividend cuts and the end of the period looked Australian companies. They found that the market reaction to dividend cuts is more negative during periods of declining profits stock at the end of the year. They also showed the amount of dividends reduces the risk of company's profitability and changes in corporate profitability.
(Fairchild ,2008) A stock dividend signals the complex relationship between a stock dividend, motivated managers and it shows the value of the company.The research results show that the stock dividend a signal of current earning provides, and affects the ability to participate in a new investment project.. He also received signals into higher dividends on investment because of the condition and treat hair, and higher quality signal is lower than the dividend shares.
Harris and et al (2008) divided the discounted dividend model (DDM) 1or the Gordon growth model began. They also estimated the intrinsic value of equity model that is used to estimate the return on equity where reviewed. They showed the DDM model between P/E multiple in a market with market growth rate relationship exists.
Priestley & et al (2009), smoothing it into dividends and it were investigated predictability. The results showed that, if the stock splits is in a smoothing companythere is predictability in a sample of the limits. Also it is possible to predict, dividend growth stocks in companies that profit sharing is a smooth coat in them to get rid of that less dividend smoothing.
Booth & et al (2009), examined how the imperative of market power on dividend policy affects the market measured by means of three criteria: 1. Fayndl and Hrchymn the index 2. The basic firms of imported jackets. 3.Learner indices were used. Results showed that the market positively on the ability to pay dividends and dividend decisions also affect the amount of dividends. They found the impact on market structure decisions, where dividend stocks, is a commercial risk.
Basel Al-Najjar & et al (2010), examined the relationship between time deposits and corporate dividend policy in a broad sample of 400 companies for the period 1991 -2008 . Their investigation shows that deposit, the dividend, leverage, growth; size, risk, and profit potential are influenced. It also showed that when both variables are divided into bonds and dividends they are simultaneously monitored by the impact of any criteria.
(Mazna Ramli , 2010) examined the impact of policies on distribution of profits and ownership structure, in companies in Malaysia in a time period 2002 - 2006. His research shows that companies that benefit more from the shareholders have split the shares of large and has increased; and the importance of the dividend to shareholders will be higher in the company of great importance in the distribution of profits.
Dimitar Rafailo & et al (2011), examined the impact of the company's characterizes on dividend decisions. The results showed that dividend policy depends on the life cycle of a conflict of interest between minority and majority shareholders.
3. Research Hypotheses
In fact this hypothesis, is the reconnaissance of those financial variables that affect the company's market value. Corporate dividend policy has been used to reflect the same variables. These variables are permanent components of earnings (book value of equity, debt, investments, financial assets and permanent earning), the present discounted value of the components expected future earnings (book value of equity, debt and investment, and net operating cash flow) and components current earnings (book value of equity, investment and financial assets and liabilities).
1
. Dividend discount model
I
www.irmbrjournal.com March 2013I
nternationalR
eview ofM
anagement andB
usinessR
esearchVol. 2 Issue.1
ISSN: 2306-9007 Honarbakhsh, Hamid & Barjandi (2013) 68 Hypotheses of this study are as follows:
3.1.The first group of hypotheses: companies whichconsiders dividend as a fraction of the permanent component of earning.
H1: There is a significant relationship betweenthe company's market value and its financial assets.
H2: There is a significant relationship betweenthe company's market value and permanent earning. H3: There is a significant relationship between the company's market value and book value of equity. H4: There is a significant relationship between the company's market value and debt.
H5: There is a significant relationship betweenthe market value of the investment of company .
3.2.The second group of hypotheses: companies which considers dividend as a fraction of the present discounted value of expected future earnings.
H1: There is a significant relationship betweenthe company's market value andnet operating cash flows. H2: There is a significant relationship between the company's market value and book value of equity. H3: There is a significant relationship between the company's market value and debt.
H4: There is a significant relationship betweenthe market value of the investment company.
3.3.The third group of hypotheses: companies which consider dividend as the proportion of the current earnings.
H1: There is a significant relationship betweenthe company's market value and financial assets. H2: There is a significant relationship between the company's market value and book value of equity. H3: There is a significant relationship between the company's market value and debt.
H4: There is a significant relationship betweenthe market value of the investment company.
4. Variables Definitions
4.1.Dependent variable:
Market value of Stock: Last value traded (market) is the common stock at the end of the fiscal period. The value of statistics and information is available on scholarships. Such as www.rdis.ir &www.irbourse.com.
4.2.Independent variables:
The independent variables investigated financial assets, permanent earnings, book value of equity, investments, debt and net operating cash flow of the balance sheet data, income statement and operating cash flows of the companies listed in Tehran Stock Exchange during 2003-2010. Data and information are collected from the annual reports of the official bulletins of the Tehran stock exchange, market information, stock organization library, Novin software, Tadbir Pardaz software, and stock sites suchaswww.rdis.ir&www.irbourse.com.
Independent variables of this study are calculated:
Financial assets: a simple measure of net of financial obligations (FAt)2 is the first operational assets, the operating assets (OAt)3, subtracting the book value of equity, cash and term securities, plus short-term and long-short-term debt and minority rights are calculated, Morton & schafere, (2000). from the book value of equity, the entire net operating assets (OA t) and net of financial obligations (FAt) is the net result of financial
2
. financial assets 3
. Operating assets
ISSN: 2306-9007 Honarbakhsh, Hamid & Barjandi (2013) 69 obligations (FA t), the difference can be achieved from between the net book value of operating assets of the owners of capital Feltham & Ohlson(1995).
FAt is calculated and defined as follows:
(1)
=Operating assets
OL =Operating liabilities
A= Total assets
Cash= Short-term investments + cash
FA t= financial assets
= Book value of equity
Permanent income: Income before items by discontinued operations minus the unexpected and the annual adjustments of the tax Morton & Hong (1999). This value can be easily calculated based on data and information exchange.
Book value of equity: shares of the Company's offices, is based on historical cost at the end of the fiscal period. The balance sheet value of companies is available listed on the Stock Exchange Audited Financial Statements.
Investment: Is additional investment is include long- term and short-term investment.
Liabilities: Total liabilities include current liabilities, long-term liabilities, other liabilities and a reverse is calculated.
Operating net cash flows: Total received minus total cash payments of cash from operations or net assets during a period to be determined Feltham & Ohlson (1995). If the value of corporate cash flows, presented in the Audited Financial Statements is available in stock.
These Variables are summarized in the table (1).
(Table 1)
Description of the variables
Names of the
Variables Proxies Calculations
market value of Stock Last value traded (market) is the common stock at the end of the fiscal period.
FA t financial assets Net of operating assets- Book value of equity
permanent earning Income before items by discontinued operations minus the unexpected and the annual adjustments of the tax
Book value of equity shares of the Company's offices at the end of the fiscal period, is based on historical
Investment Additional Investment
Liabilities Total liabilities( current liabilities+long-term liabilities+other liabilities+ reveres)
Operating net cash flow Total received - total cash payments of cash
I
www.irmbrjournal.com March 2013I
nternationalR
eview ofM
anagement andB
usinessR
esearchVol. 2 Issue.1
ISSN: 2306-9007 Honarbakhsh, Hamid & Barjandi (2013) 70
5. Methods of Data Analysis
In this study, the multiple regressions are used for data analysis. Initial data was inserted in Excel spreadsheet and SPSS software was applied to analyze the data statistically. Also Rahavard Novin software, Tadbir Pardaz software, stock organization library and stock sites such as www.rdis.ir & www.irbourse.com were used.
6. Research Method and Regression Model
Considering that the aim of this study was to examine the relationship between stock prices and earning's components of the permanent, components of the discounted value of expected future earning and the current earning's components that as a share dividend policy is to replace the variables, and attention to three groups of variables and assumptions about the research mentioned in the same way it was prior to the model, and the overall study group for each of the following research was decisive.
First of all variables in the model study in a multiple regression model tested general form it is as: follows
In the Model 2:
In the Model 3:
7. Sample Selection
The sample was chosen from the firms listed on the Tehran stock exchange (TSE), from 2003 to 2010, using the following criteria:
1). Firms were listed in TSE during 2003-2010. 2). Data was available for all the years under the study.
3). The companies didn’t have changed the fiscal year for the period studied. 4). Banks, Insurance and Investment firms were not considered in this study.
The data used in the analysis were collected from the annual reports of the official bulletins of the Tehran stock exchange. The final sample contains 45 firms.
8. Data Analysis
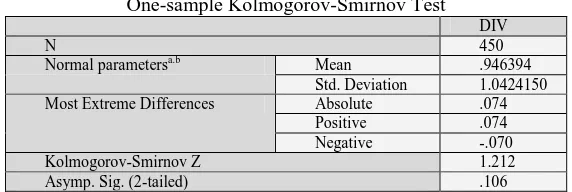
Pearson Correlation Coefficient and Multivariate Regression were used to analyze data. H0=normal
H1= Data is abnormal
Table (2)
One-sample Kolmogorov-Smirnov Test
DIV
N 450
Normal parametersa.b Mean .946394 Std. Deviation 1.0424150 Most Extreme Differences Absolute .074
Positive .074 Negative -.070 Kolmogorov-Smirnov Z 1.212 Asymp. Sig. (2-tailed) .106
)
4
(
3 , ,
4 ,
3 ,
2 ,
1
0
h
C
ith
Y
i th
B
ith
L
it i th
pi
)
5
(
3 , ,
4 ,
3 ,
2 ,
1
0
k
FA
itk
Y
itk
B
itk
L
it i tk
pi
ISSN: 2306-9007 Honarbakhsh, Hamid & Barjandi (2013) 71 a. Test distribution is normal.
b. Calculated from data.
Following the table (II), Sig = 0.106>0.05. Thus results show that data is normal.
8.1. Companies which considers dividend as a fraction of the permanent component of earning.
Testing Results of the first group hypothesis:
Table (3)
Variables Entered
A total optimum model was used to predict the stock prices considering dividend as a fraction of the permanent component of earning. We entered variables into the model respectively. 3 models were defined and finally the last model (3) including 3 variables was defined as an optimum model for predicting the performance. As a result, the regression model came as the followings:
Table (4) Excluded Variables VIf Partial Correlation Sig t Beta ln Variable mod el 1.002 -0.92 0.52 -1.949 -0.041 1 1.001 -0.054 0.25 3 -1.144 -0.024 2
As it is seen, significance level is equal to 0.52> 0.05, therefore, this variable was not entering the model. Also significance level is equal to 0.253> 0.05, therefore, this variable was not entering the model.
Presenting total optimum model based on model 3 (T-test)
Optimum model was model 3, which had a more determination coefficient than the previous ones. In fact, when most variables were beside each other, they could present a more precise prediction of the stock prices and in the first group hypothesis, the optimum model was 3.
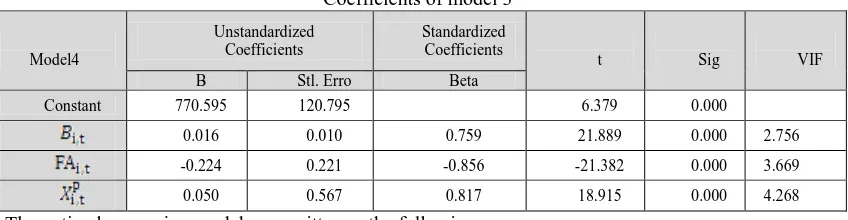
Table (5)
Coefficients of model 3
VIF Sig t Standardized Coefficients Unstandardized Coefficients Model4 Beta Stl. Erro B 0.000 6.379 120.795 770.595 Constant 2.756 0.000 21.889 0.759 0.010 0.016 3.669 0.000 -21.382 -0.856 0.221 -0.224 4.268 0.000 18.915 0.817 0.567 0.050
The optimal regression model was written as the following:
)
7
(
05
.
0
224
.
0
016
.
0
595
.
770
Bi
FA
XP
Pi
Method
Durbin-Watson Adjusted R Square
Variables Entered Mod el Step wise 0.584 1 Step wise 0.674 2 Step wise 1.862 0.804 3
I
www.irmbrjournal.com March 2013I
nternationalR
eview ofM
anagement andB
usinessR
esearchVol. 2 Issue.1
ISSN: 2306-9007 Honarbakhsh, Hamid & Barjandi (2013) 72 According to the statistical results of the first group hypothesis to test the research, the first group, debts and permanent earning are positive and have a significant impact on the company's market value while financial assets impact is negative and significant. So if the dividend is based on a proportion of permanent earning, it can be argued that increasing the debts and permanent earning, the company's market value will increase. . Meanwhile, based on Table (3) the results of group tests, suggest that, three independent variables of the study have a significant relationship with the company's market value (F= @. /000), which together offer a 80% (AdjR 2 = ) 802) Explains the behavior of the dependent variable.
8.2. Companies which considers dividend as a fraction of the present discounted value of
expected future earnings.
Testing Results of the second group hypothesis: Table (6)
Variables Entered
A total optimum model was used to predict the stock prices while considering dividend as a fraction of the
present discounted value of expected future earnings. We entered variables into the model respectively. 3 models were defined and finally the last model (3) including 3 variables was defined as an optimum model to predict the performance. As a result, the regression model came as the followings:
Table (7) Excluded Variables VIf Partial Correlation Sig t Beta ln Variable mod el 1.004 -0.47 0.31 9 -0.998 -0.013 1
As it is seen, significance level is equal to 0.319> 0.05, therefore, this variable was not entering the model.
Presenting total optimum model based on model 3 (T-test)
Optimum model was model 3, which had a more determination coefficient than the previous ones. In fact, when most variables were beside each other, they could present a more precise prediction of the stock prices and in the second group hypothesis, the optimum model was model 3.
Table (8) Coefficients of model 3
VIf Sig t Standardized Coefficients Unstandardized Coefficients Model3 Beta Stl. Erro B 0.000 12.393 84.123 1042.553 Constant 1.946 0.000 38.442 0.681 0.032 0.004 2.458 0.000 18.174 0.362 0.430 0. 23 3.811 0.000 3.617 0.090 0.670 0.001 Method Durbin-watson
Adjusted R Square Variables Entered Mod el Step wise 0.782 1 Step wise 0.926 2 Step wise 1.995 0.928 3
)
8
(
3 , , 4 , 3 , 10
h
C
ith
B
ith
L
it i th
pi
ISSN: 2306-9007 Honarbakhsh, Hamid & Barjandi (2013) 73 The optimal regression model was written as the following:
)
9
(
001
.
0
23
.
0
004
.
0
533
.
1024
Li
Bi
Ci
Pi
According to the results of statistics the second group hypothesis to test the research, the second group, Liabilities, Investment and operating net cash flow have a positive and significant impact on the company's market value. So if the dividend is based on a proportion of thepresent discounted value of expected future earnings, it can be argued that increasing the Liabilities, Investment and Operating net cash flow, the company's market value will increase. . Meanwhile, based on table (6) the second group test suggeststhat ,three independent variables have a significant relationship with the company's market value (F= @. /000), which together offer a 92% (AdjR 2 = .928) Explains the behavior of the dependent variable.
8.3. Companies which consider dividend as a fraction of the current earning Testing Results of the third group hypothesis:
Table (9)
Variables Entered
A total optimum model was used to predict the stock prices while considers dividend as a fraction of the present discounted value of expected future earnings. We entered variables into the model respectively. 3 models were defined and finally the last model (3) including 3 variables was defined as an optimum model to predict the performance. As a result, the regression model came as the followings:
Table (10) Excluded Variables VIf Partial Correlation Sig t Beta ln Variable mo del 1.073 0.80 0.0 92 1.68 9 0.03 5 1
As it is seen, significance level is equal to 0.092> 0.05, therefore, this variable was not entering the mode
Presenting total optimum model based on model 3 (T-test)
Optimum model was model 3, which had a more determination coefficient than the previous ones. In fact, when most variables were beside each other, they could present a more precise prediction of the stock prices and in the third group hypothesis, the optimum model was model3.
Table (11) Coefficients of model 3
VIF Sig t Standardized Coefficients Unstandardized Coefficients Model3 Beta Stl. Erro B 0.000 8.342 166.533 1389.166 Constant 13.602 0.000 -5.405 -0.395 0.215 -0.030 3.513 0.000 18.425 0.685 0.512 0.111 8.250 0.000 14.794 0.843 0.334 0.69 Method Durbin-watson Adjusted R Square Variables Entered Mod el Step wise 0.686 1 Step wise 0.737 2 Step wise 2.102 0.823 3
)
10
(
3 , , 3 , 2 , 10
k
Y
itk
B
itk
L
it i tk
pi
I
www.irmbrjournal.com March 2013I
nternationalR
eview ofM
anagement andB
usinessR
esearchVol. 2 Issue.1
ISSN: 2306-9007 Honarbakhsh, Hamid & Barjandi (2013) 74 The optimal regression model was written as the following:
)
11
(
069
.
0
111
.
0
030
.
166
.
1389
Yi
Bi
Li
Pi
According to the statistical results of the second group hypothesis to test the research, the second group, Liabilities and Investment have a positive and significant impact on the company's market value while Book value of equity 's impact is negative and significant. So if the dividend is based on a proportion of the present discounted value of expected future earnings, it can be argued that increasing the Liabilities and Investment, the company's market value will increase. . Meanwhile, based on Table (9) the results of tests group l the third suggests that the, three independent variables have a significant relationship with the company's market value (F= @. /000), which together offer an 82% (AdjR 2 = .823) Explains the behavior of the dependent variable.
9. Conclusion:
In this study, the effect of dividend policy has been assessed on company market value of companies listed in Tehran Stock Exchange. In this regard, three models was reviewed of equity valuation models Ohlson, the relationship between earnings, dividends and dividend information content of the evaluation. According to the results of statistical models to test the research, the first model, the Liabilities and permanent earning standing in the market value of the company were extremely positive and significant, while financial assets were negative and significant. Thus, while the proportion of dividend earning is permanent, it can be claimed that the increase in Liabilities and permanent earning would increase the company's market value. In the second model, Liabilities ,the net operating cash flow and Investment on market value of the company were positive and significant. So when the dividend is based on a proportion of the present discounted value of expected future earning, it confirms this with the increase in Liabilities ,the net operating cash flow and Investment, and the company's market value will increase. And finally, the third model, the relationship between the significant and positive market value and Investment Company, and Liabilities showed that the company's book value of equity is negative and significant. Thus it can be concluded that when the dividend is based on the proportion of current earning, with the increase in Liabilities investments the company's market value will increase. These results are consistent with the results of the, Yun-sheng & et al (2005) study, that reviewed ". The relationship between dividend policy and equity valuation models" were not experimental results of their research. It says that for the three models developed, all three models, book value of equity, Liabilities and investment were mainly positive and the stock price for the total sample are related.
And it also confirms the results of comparing the three models show that, the anatomical features of the second model's ability to predict market value are more than the other models. Such a conclusion is also consistent with the results of the Yun-sheng & et al (2005) study that reviewed "The relationship between dividend policy and equity valuation models, also found, anatomical features and the ability of the model to predict the market value to be more than the other two models.
References
Balachandrak & vidanapathirana (Augst 2007) “ The Impact of Dividend Reduction on Shareholders Wealth “,at: www.ssrn.com
Barclay, M. J. et., (Winter 1995) .”The Determinants of Corporate Leverage and Dividend Policies”, Journal of Applied Corporate Finance,1,207-224
Basil Al-Najjar & Yacine Belghitar (December , 2010)Corporate Cash Holdings and Dividend Payments: Evidence from Simultaneous Analysis”Managerial and Decision Economics, ,at: www.ssrn.com
Beiner Stefan (June 2001). Theories and Determinants of Dividend Policy available at : www.sbf.unisg.ch
ISSN: 2306-9007 Honarbakhsh, Hamid & Barjandi (2013) 75 Booth Laurence & zhou jun (February, 2009) Market power and dividend policy available at:
www.ssrn.com
Chen long & priestley Richard (june, 2009) Dividend soothing and predict ability available at:
www.ssrn.com
Dimitar Rafailov & Mirena Trifonova(September, 2011)” The Effect of Firm Characteristics on Dividend Decisions of Bulgarian Companiesavailable at: www.ssrn.com
Fairchild Richard (August, 2008). Dividend policy signaling and free cash flow available at: www.ssrn.com
Franke,R., and M.CLee, (1998). Accounting valuation, Market Expectation, and cross-sectional Stock Returns,” Journal of Accounting and Economics, 25,283-319
Gordon.M.J. ,) 1959(.” Dividends,Earnings, and Stock pricos,” Review of Economic studies, 41,99-105 Lo,K.,and T.Lys, (2000),”The ohlson Model: contribution to valuation Theory, Limitations, and Epirical
Application,” Journal of Accounting, Auditing &Finance,15,337-367
Nathasa Mazna Ramli(February 2010)” Ownership Structure and Dividend Policy: Evidence from Malaysian Companies” International Review of Business Research Papers , 6, 170-180.
Ohson,J.A,( 1995) ,” Earning , Book value and Dividend in Equity valuation “ Contemporary Accounting Research, 11,661-687
Robert s. Harris &Kenneth M. Eades(october2008) “The Dividend Dicount Model” available at:
www.ssrn.com
Yi-Mienlih, Yun-sheng HSU, Wood Liao,(2005), “The Relationship between Dividend policy and Equity Valuation Mode” at: www.ssrn.com