http://www.sciencepublishinggroup.com/j/ijefm doi: 10.11648/j.ijefm.20180606.12
ISSN: 2326-9553 (Print); ISSN: 2326-9561 (Online)
Performance Evaluation of Machine Learning Approaches
for Credit Scoring
Anqi Cao
1, Hongliang He
2, Zixuan Chen
2, *, Wenyu Zhang
21
Dongfang College, Zhejiang University of Finance and Economics, Hangzhou, China
2
School of Information, Zhejiang University of Finance and Economics, Hangzhou, China
Email address:
*Corresponding author
To cite this article:
Anqi Cao, Hongliang He, Zixuan Chen, Wenyu Zhang. Performance Evaluation of Machine Learning Approaches for Credit Scoring.
International Journal of Economics, Finance and Management Sciences. Vol. 6, No. 6, 2018, pp. 255-260. doi: 10.11648/j.ijefm.20180606.12
Received: October 15, 2018; Accepted: November 12, 2018; Published: December 11, 2018
Abstract:
In today’s world, assessing financial credit risk is of immense importance in both accounting and finance areas. Financial institutions need to keep the credit default risk to an acceptable level so that higher profitability can be achieved. Recently, with the fast development of modern data science, many machine learning methods have been applied to make accurate predictions based on the information extracted from diverse data sources. The present study aims to apply data mining techniques in acquiring evidence used to judge which classifier performs better in assessing credit scoring for a proposed model. The two datasets employed in the analysis of this paper are the “Give Me Some Credit” dataset and the “PPDai” dataset. Eight classification methods are adopted in the paper including Linear Discriminant Analysis (LDA), Logistic Regression (LR), Decision Tree (DT), Support Vector Machine (SVM), Random Forest (RF), Gradient Boosting Decision Tree (GBDT), eXtreme Gradient Boosting (XGboost) and Multi-Layer Perceptron (MLP). Three indicators (Accuracy, AUC and Logistic loss) are used to analyze the performance of each classifier. The final experiment results indicate that the XGBoost classifier has a better performance in predictive analytics compared with the other seven models. The study results will also provide practical values for financial institutions in choosing the appropriate classifier so as to make correct judgements when they are faced with credit problems in real situations.Keywords: Data Mining, Credit Scoring, Machine Learning, Performance Evaluation
1. Introduction
In the field of modern finance, normal business activities always include different decision-makings affiliated with relevant financial risk management. Any uncertainty in the business entities that could result in financial losses can be regarded as financial risk. Market risk, credit risk, liquidity risk and operational risk are the major four types of financial risk. Determining the type of financial risk is an essential step for a financial institution to take in organizing a risk management system for the sake of making reasonable decisions. This paper centers on credit risk, which is the probability that counterparties fail to make repayments on the debt obligations when the due date is coming.
As the number of applicants increase significantly, the importance of selecting an appropriate model for predicting credit risk is imperative. Statistical techniques as well as the AI (Artificial Intelligence) techniques are chosen in this paper to assess the level of credit scoring. Linear Discriminant Analysis (LDA) and Logistic Regression (LR) are the statistical techniques selected and Decision Tree (DT), Support Vector Machine (SVM), Random Forest (RF), Gradient Boosting Decision Tree (GBDT), eXtreme Gradient Boosting (XGboost), Multi-Layer Perceptron (MLP) are the AI techniques used throughout the assessing procedures [2, 3]. These classification models also constitute the core algorithms in the field of machine learning. Borrowers can make reference to the results that are produced from the algorithms used to decide whether the decision is reasonable or not. There are two datasets that will be used in doing the validation and demonstration. One dataset is from the Kaggle website1 with the theme of “give-me-some-credit” bank loan, while the other dataset is a portion of loan data collected from PPDai2, a fintech committed to the research of big data, cloud computing and artificial intelligence. The experiment result shows that XGboost model’s overall performance for predicting the level of credit scoring is better in contrast with the other seven models.
The rest of the paper is organized as follows. Section 2 is a review of relevant researches on the classification models in credit scoring in recent years. The content of the proposed model is explained in Section 3 in detail. In Section 4, three types of performance metrics are introduced, and the prediction results are well compared and deeply interpreted through the performance validation approaches. Section 5 is a conclusion reached based on the above analysis and future work for the study is indicated as well.
2. Related Works
The modern data mining techniques have contributed a great deal in information science industry. Since data mining is a method of knowledge extraction, it is necessary for business managers to apply these techniques so that they could find useful hidden information transformed from mass of data to gain a better understanding of their customers and operations and to solve complicated organizational problems. This study mainly focuses on credit scoring in the field of finance.
Over the past few decades, great progress has been achieved in the research of credit scoring. Identifying the features that impact the customers’ payment or non-payment behavior and his/her default risk is the main idea underlying credit scoring models. Such models are used to reach a conclusion of either accepting or rejecting the credit applications [4]. By applying the traditional statistical approaches or advanced machine learning approaches, the creditworthiness of customers can be easily evaluated.
1 https://www.kaggle.com/c/GiveMeSomeCredit/data 2 https://www.ppdai.com
Sufficient evidence found from recent studies has revealed that without the reliance on restrictive assumptions, the accuracy of statistical methods can be improved a great deal by intelligent methods [5]. Therefore, many data mining techniques as well as the optimization algorithms have gradually become widespread in the credit scoring domain. For instance, in Huang and Chen’s study [1], the SVM classifier achieves an identical classificatory accuracy in assessing the credit risk with relatively few input features, compared with neural networks, genetic programming, and decision tree classifiers. Xia and Liu [6] raise a sequential ensemble credit scoring model on the basis of a variant of gradient boosting machine (i.e., extreme gradient boosting (XGBoost)), which largely improved the interpretability of credit scoring model.
and sharding. They find that XGBoost scales uses much fewer resources than all the other existing systems. This method has become more popular in recent years and it is chosen as the specific algorithm for many winning teams in machine learning competitions.
In what follows, a comparison is made between XGBoost and the other classifiers in predicting accuracy about the level of credit scoring based on two typical datasets.
3. Data Preprocessing and Modeling
Methods
3.1. Dataset Preprocessing
Before the proposed model for assessing credit risk is constructed, preprocessing is a necessary step towards preparing data for training. It converts the data into a format
that is much easier to understand for both its intended users and computers. Also, data-gathering methods are sometimes full of loopholes, giving rise to out-of-range figures or missing values. If this kind of data is analyzed without any processing, the results will be misleading and inaccurate. Therefore, ensuring the quality of the dataset should be ranked first before an analysis is started.
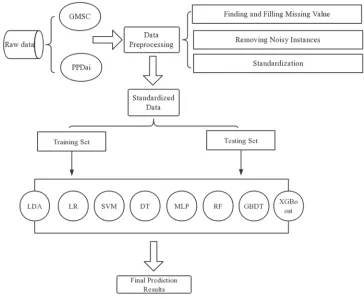
Finding and filling missing values within the dataset in accordance with the types of features is the initial step of data preprocessing. Secondly, noisy instances should be removed to make the original dataset manageable. Then the selected instances are either normalized or standardized. Final training set should be the product of data preprocessing.
After doing the missing value filling, filtering and standardization, the process reaches the prepared data before using eight classifiers to get the final predicting results.
3.2. The Introduction of Modeling Method
Figure 1. The process of the proposed model.
Figure 1 shows the general performable route of assessing financial credit risk. The two classes of investigated raw data are obtained from Kaggle website and a financial company whose primary business is providing bank loan.
During the preprocessing procedure, the patterns of transformed data are explored by intelligent techniques statistically. Different modeling algorithms are developed by integrating the prepared data and these algorithms help to reinforce the exploration and make data more interpretable. The GMSC dataset has 90 features while the PPDai dataset
Area under ROC Curve (AUC) and Logistical loss) are adopted.
The ultimate goal of this study is to find out which out of the eight commonly used classifiers (LDA, LR, SVM, DT, MLP, RF, GBDT, XGBoost) is the most suitable model for accurately predicting about the financial credit risk.
4. Experimental Results
Every classifier in each dataset was repeatedly processed 30 times to avoid the single-result bias and improve the overall dataset quality. The results of the experiments are described in Table 1.
Table 1. Performance of classifiers on two datasets.
Dataset Classifier performance measure metrics Accuracy AUC Loss
GMSC LDA 0.82057 0.76598 0.45302
LR 0.82058 0.76778 0.43957
SVM 0.82012 0.72297 0.45851
DT 0.72592 0.61469 9.45622
MLP 0.80916 0.75430 0.48390
RF 0.81673 0.76627 0.44133
GBDT 0.82006 0.78152 0.42867
XGBoost 0.82022 0.78241 0.42816
PPDai LDA 0.86567 0.64893 0.37107
LR 0.87042 0.64961 0.36769
SVM 0.86978 0.58853 0.38372
DT 0.78253 0.54497 7.51004
MLP 0.85593 0.61423 0.43984
RF 0.87115 0.69275 0.35926
GBDT 0.87123 0.70671 0.35424
XGBoost 0.87155 0.71084 0.35238
Prediction accuracy, AUC and Logistic loss [3] are the three evaluation measures used in this study to express the performance of different classifiers. The AUC and accuracy are calculated using the following equations:
TPR (1)
TNR (2)
Accuracy (3)
The True Positive Rate (TPR) (Equation 1) is the percentage by which positive data are truly predicted, while the True Negative Rate (TNR) (Equation 2) is the percentage by which negative data are truly predicted. Equation 3 shows the calculation of accuracy rate. To work out the percentage of accuracy, it is necessary to have Ture Positive (TP), Ture Negative (TN), False Positive (FP) and False Negative (FN) values.
AUC measurement serves as a crucial tool in evaluating the classifiers’ performance, especially when two models have the same accuracy rate. It can be induced from Receiver Operating Characteristics (ROC) curve: it is the area under the ROC curve. The x-axis of ROC curve refers to False Positive Rate (one minus TNR) while the y-axis refers to the TPR.
Figure 2. Performance of selected classifiers on GMSC dataset.
Figure 3. Performance of selected classifiers on PPDai dataset.
Referring to Figure 2 and Figure 3, Figure 2 shows that the percentage of accuracy of XGBoost model in GMSC dataset is slightly lower than LR model and LDA model. However, for both the GMSC dataset and PPDai dataset, XGBoost model has achieved the biggest AUC value and fewest losses. This indicates that the XGBoost model has dominant advantages over all the other classifiers. Therefore, it is obvious that XGBoost should be chosen as our primary analytical tool in assessing the level of credit scoring.
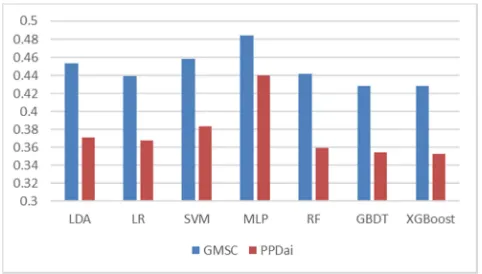
Figure 4. The comparison of losses between two datasets.
in the two datasets are 20 times larger than all the other classifiers’ losses, it is not meaningful to take them into account. Hence, we remove them in Figure 4 to make salient the other figures that show subtle distinctions and are more comparable. Obviously, DT classifier is the worst in this respect while XGBoost is the best classifier thanks to the least loss it causes in both the two datasets.
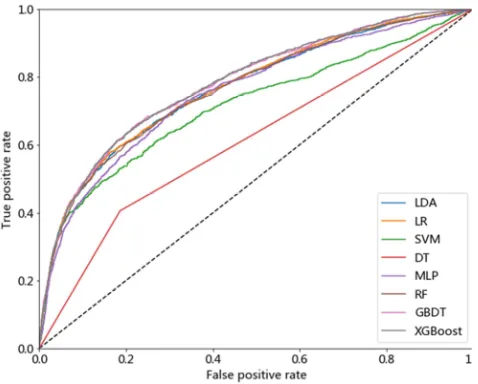
Figure 5. Whole ROC curves for GMSC dataset.
Figure 6. Whole ROC curves for PPDai dataset.
Figure 5 and Figure 6 show the overall distribution of AUC curves of the two datasets under eight classifiers respectively and the detailed values of AUC can be found in Table 1. All the values of AUC are within the range from 0.5 to 1, which means that all the eight methods are better than random prediction method. From the two graphs, we can notice that the AUC curves produced by XGBoost model are always slightly beyond all the other curves. This phenomenon is proved by the fact that XGBoost model has highest AUC values in Table 1. Applying a model with the highest AUC is always a wise choice because high AUC value means a high possibility of getting the true positive instances.
5. Conclusion and Future Work
It is indispensable for financial institutions to test the level of credit scoring of their customers, so choosing a reasonable model becomes the most important issue. Due to the fast development of algorithm technology, machine learning methods are playing a growing role in the competitive business environment. In this study, firstly, two different classical datasets are selected for data preprocessing in the finance area. Secondly, after the data preprocessing procedure is done, the methods of LDA, LR, SVM, DT, MLP, RF, GBDT, and XGBoost are employed to predict the accuracy of credit scoring. Then we choose three performance measuring tools to decide which model is the best synthetically. The experiment shows that XGBoost model has the most satisfying performance. The results of the performance evaluation can improve the scale of business entities’ undertaking by reducing default risks and making smarter decisions.
However, there are still some limitations in this study for business environment has become more complex nowadays. Many aspects need to be further improved in future work. For instance, the performance of the selected classifiers might be affected by the absence of certain values and the existence of certain abnormal information, and so larger data sets should be used in order to lift accuracy. Moreover, the efficiency of the proposed model could be promoted if classifiers can be better integrated.
References
[1] Huang, C. L., Chen, M. C., & Wang, C. J. (2007). Credit scoring with a data mining approach based on support vector machines. Expert Systems with Applications, 33(4), 847-856.
[2] Sharda, R., Delen, D., & Turban, E. (2018). Business Intelligence, Analytics, and Data Science: A Managerial Perspective (4th ed.). Boston: Pearson.
[3] Han, J., Kamber, M., & Pei, J. (2006). Data Mining: Concepts and Techniques. Burlington: Morgan Kaufmann.
[4] Chen, S. Y., & Liu, X. (2004). The contribution of data mining to information science. Journal of Information Science, 30(6), 550-558.
[5] Chen, N., Ribeiro, B., & Chen, A. (2015). Financial credit risk assessment: a recent review. Artificial Intelligence Review, 45(1), 1-23.
[6] Xia, Y., Liu, C., Li, Y., & Liu, N. (2017). A boosted decision tree approach using Bayesian hyper-parameter optimization for credit scoring. Expert Systems with Applications, 78, 225-241.
[7] Fisher, R. A., (1986). The use of multiple measurements in taxonomic problems. Annals of Eugenics, 7, 179-188. [8] Karlis, D., & Rahmouni, M. (2007). Analysis of defaulters’
[9] Danenas, P., & Garsva, G. (2015). Selection of Support Vector Machines based classifiers for credit risk domain. Expert Systems with Applications, 42(6), 3194-3204.
[10] Orrù, G., Pettersson-Yeo, W., Marquand, A. F., Sartori, G., & Mechelli, A. (2012). Using Support Vector Machine to identify imaging biomarkers of neurological and psychiatric disease: A critical review. Neuroscience and Biobehavioral Reviews, 36(4), 1140-1152.
[11] Maldonado, S., Pérez, J., & Bravo, C. (2017). Cost-based feature selection for support vector machines: an application in credit scoring. European Journal of Operational Research, 261(2), 656-665.
[12] Kamiński, B., Jakubczyk, M., Szufel, P., &
Leopold-Wildburger, U. (2018). A framework for sensitivity analysis of decision trees: Central European Journal of Operations Research, 26(1), 135-159.
[13] Trevor, H., Tibshirani, R., & Friedman, J. (2008). The Elements of Statistical Learning (2nd ed.), Springer.
[14] Zięba, M., Tomczak, S. and Tomczak, J. (2016). Ensemble boosted trees with synthetic features generation in application to bankruptcy prediction. Expert Systems with Applications, 58, pp. 93-101.