INTRODUCTION
The ionic conductivity of oxide glasses has been established by Warburg¹ about a century ago. During the last decades Li+, Na+, Ag+and Cu+ conducting glasses have been synthesized. The ion conductivity attained at room temperature is of the order of 10-2 S/cm for silver and copper2-4 conducting glasses. These values are comparable to those for the ionic conductivity of aqueous electrolytes as well as to those for the best crystalline electrolytes. Compared to polycr ystalline electrolytes, ion conducting glasses have a number of advantages due to their isotropic nature, the absence of grain boundaries, the ease of their preparation in various bulk forms, powders and thin films, the good possibilities for selection of appropriate components and the possibility of varying the working characteristics over a wide range by changing the chemical composition. This makes the glasses a promising material for application in solid state ionic devices, as primary or secondary solid state batteries, fuel cells, gas sensors,
Material Science Research India Vol. 4(2), 331-340 (2007)
Study of Ionic conduction and dielectric relaxation of
AgPO
3-AgI superionic glasses based solid electrolyte
FATHY SALMAN and AZIZA EL-HOSIL
Department of Physics, Faculty of Science for Girls at Dammam, (Kingdom of Saudia Arabia). (Received: April 12, 2007; Accepted: June 04, 2007)
ABSTRACT
The electrical conductivity for the glass system (AgPO3)1-x(AgI)x, where 0 × 0.5, is determined by the impedance method in the frequency range 100Hz-1MHz and the temperature range from room temperature to glass transition temperature.The impedance plot appeared on the complex plane as semicircles passing through origin The temperature dependence of conductivity grows linearly reaching a value of 0.6×10⁻² (-1cm-1) for a composition x=0.5 which is identified as
a “fast-ionic” conductor. Variations of ' and " with frequency and temperature are found , which corresponds to an interfacial process. The dielectric constant is found to be increasing with increase AgI content which is due to the fact that the mobile ion concentration increases, which leads to the increasing of conductivity. The composition The charge-discharge processes of Ag/SE/Ag2S battery using AgPO3 -AgI superionic glasses based solid electrolyte is studied.
Key words:Ionic conduction, AgPO3-Agl superionic glasses, Solid electrolyte.
electrochromic displays, etc. These properties of glasses with super ion conductivity predetermine their increasing importance in the research on solid state electrolytes.
Silver ion conducting glasses were discovered accidentally by Kunze5 in 1973 in his attempt to obtain an anion-stabilized -AgI by melting AgI and Ag2SeO4 in different proportions followed by rapid cooling of the melt in air or liquid nitrogen. When 75 mol.% AgI and 25 mol.% Ag2SeO4 were used, the glass obtained had an ionic conductivity = 3 ×10⁻² S/cm at room temperature and an activation energy E = 0.2 eV. This marked the beginning of intense studies and synthesis of silver ion conducting glasses.
Among superionic glasses, the AgI-AgPO3 system has been extensively studied by different methods, because of its high ionic conductivity, low melting point and ease of preparation6. AgPO
increases the conductivity to 10-4, 10-3 and 10-2 S/cm for AgCl, AgBr and AgI respectively7,8.
Characterization of a material plays a vital role in the field of solid electrolytes. Many of the features in condensed matter are accompanied by the motion of charge carriers, creating various types of dipoles. The dielectric properties are attributed to the polarization change of the movements of charge carriers and molecular vibrations depending on the frequency of the field.
The aim of this study is to investigate the superionic conduction of the glass system (AgPO3)1-x(AgI)x, ( 0×0.5) to be used as solid electrolyte battery . The study is carried out with the conductivity and dielectric properties as a function of temperature , frequency and composition dependence. The measurement of density is used to determine the relationship between the structure and the ionic conductivity.
EXPERIMENTAL
Glassy AgPO3 was prepared by taking raw materials NH4H2PO4 and AgNO3 in the molecular weight ratio and mixed thoroughly. The mixture was heated in porcelain crucibles at a temperature ranging from 250 to 350°C for two hours until gas evolution is ceased. After that the temperature was raised gradually to 600 °C and left for 4 hours in order to complete chemical reactions. During melting the melt was shacked several times to ensure the homogeneity. The melt was quenched and poured on a steel plate kept at room temperature. Glassy samples of (AgPO3)1-x(AgI)x, ( x=0, 0.1, 0.2, 0.3, 0.4 and 0.5) were prepared in the following way. Appreciate amounts of AgI and glassy AgPO3 were melted in a porcelain crucible at 600°C and then quenched.
For electrical conductivity measurements, samples in the form of pellets of diameter ~1cm and of thickness ~2mm were used. The area used on the investigated sample was coated with silver conducting paint, which showed ohmic contact. The sample was fixed between two copper electrodes in the conductivity holder and heated in an electrical furnace. The ac measurements were carried out in the frequency range from 50 Hz to 1
MHz and temperatures range (300 to 370 k) by means of a RCL- meter Hi-tests (Hioki 3532) controlled through interface by a personal computer. The temperature range of heating was 300-370K. The rate of heating was adjusted to be 1 K/min, using a digital temperature controller.
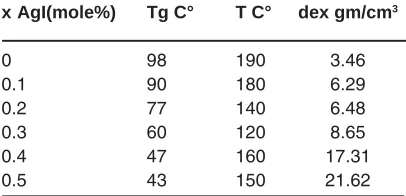
Glass nature of the prepared samples was confirmed by X-ray diffraction method. The prepared glasses have been analyzed using DTA technique. The values of glass transition temperature (Tg) and crystallization temperature (Tc) for investigated samples are listed in Table 1. It is noticed that the glass transition temperature monotonically decreases with increasing AgI concentration within the glass forming region. It is expected that the starting amount of AgI is completely dissolved in the glass without precipitation or segregation from the fact that the glass transition temperature is lower in the high concentration region¹².
Table 1: Tg, Tc and dexp. Values for samples (AgPO3)1-x(AgI)x, ( 0 x 0.5).
x AgI(mole%) Tg C° T C° dex gm/cm3
0 98 190 3.46
0.1 90 180 6.29
0.2 77 140 6.48
0.3 60 120 8.65
0.4 47 160 17.31
0.5 43 150 21.62
RESULTS AND DISCUSSIONS
Electric conductivity and dielectric properties of AgPO3-AgI superionic glasses based solid electrolyte
The impedance measurements were carried out from room temperature up to the glass transition temperature in the frequency range (50 Hz-1MHz)for all glassy samples of the system (AgPO3)1-x(AgI)x, (0×0.5).
(Z') for (AgPO3)0.9(AgI)0.1 ( a typical example ) at different temperatures. Each plot consists of a semicircle passing through the origin. This semicircle is well described by the parallel combination of resistance and capacitance equivalent to the sample. The intersection of the semicircle with Z’-axis gives the bulk resistance Rb.
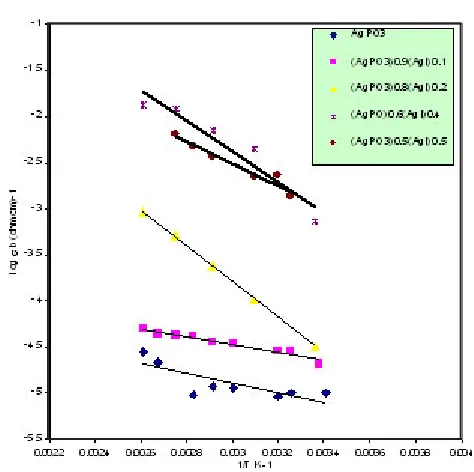
Fig. 2 shows the temperature dependence of the bulk conductivity in the form of log versus 1/ T for all sample compositions (AgPO3)1-x(AgI)x ( x=0, 0.1, 0.2, 0.3, 0.4 and 0.5). It is noticed that the conductivity plot is Arrhenious-type obeying the relation = o exp ( -Eb /kT) where o is the prexponential factor, Eb is the activation energy and
Fig. 2: Temperature dependence of the bulk conductivity log b versus 1000/T for (AgPO3)0.9(AgI)0.1glasses .
Fig. 1: (a) Complex impedance plots of Z' versus Z" for (AgPO3)0.9(AgI)0.1glasses at different temperatures.
Z(OHMS) (AgPO3)0.9(Agl)0.1
k is the Boltzman constant. The conductivity increases with increasing AgI content. For x=0.5 the conductivity grows linearly reaching a higher value of 0.6×10⁻² (-1cm-which is identified as a “fast-ionic” conductor. The bulk activation energy values determined from Fig.2 are listed in Table 2.
The activation energy is within 0.17-0.04 eV for glass compositions and in a good agreement with the reported values for silver ion conducting glasses in the superionic phase¹³. The relaxation time of the conductivity is determined from semicircles plots using the relation =1 at the top of each semicircle. The obtained activation energy E are listed in Table 4.
The conductivity ( tot ) for the glasses (AgPO3)1-x(AgI)x, (0×0.5) as a function of composition at T=333K is represented in Fig.3.
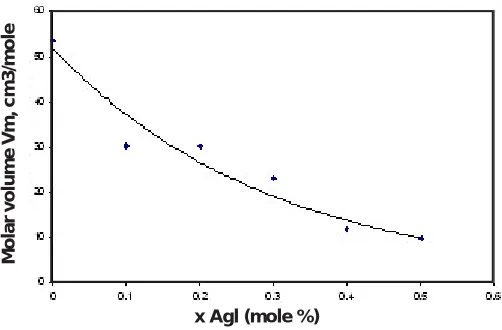
Fig. 4, shows the molar volume of (AgPO3)1-x(AgI)x, (0×0.5) system as a function of dopant salt concentration x. It is noticed that the molar volume usually decreases slightly with increasing salt concentration.
Table 2: Eb and E values for (AgPO3) 1-x(AgI)x, ( 0׳0.5)
x AgI(mole%) Eb eV Eô eV
0 0.16 0.2
0.1 0.14 0.05
0.2 0.16 0.23
0.3 0.17 0.07
0.4 0.04 0.19
0.5 0.04 0.16
Fig. 3: Conductivity vs. AgI composition at 25°C
log tot
Agl content (mole %)
Fig. 4: Molar volume for (AgPO3)1-x(AgI)x, ( 0 × 0.5) x Agl (mole %)
The conductivity of the same glasses increases generally rapidly with increasing dopant concentration. This indicates that the glass network expands considerably upon salt doping14. So, the main reason for the large increase in conductivity on addition of the dopant salt is the more open structure of the expanded network which provides the necessary free volume for Ag+ motion15.
The dielectric properties in ion conductive glasses mainly arise from the ionic motions. The free energy barriers impeding the ionic diffusion, however , can be expected to vary from site to site , so there are different ionic motions in glasses16. The first is the rotation of ions around their negative sites, the second is short-distance transport, i.e. ions hop out of sites with low free-energy barriers and tend to pile up at sites with high free-energy barriers in the electric field direction in dc or low frequency electric field or oscillate between the sites with high free-energy barriers in an ac electric field. Both the first and the second motions make a contribution to the dielectric constant ' of glasses. The third ionic motion is that the ions with higher energy can penetrate the glasses, i.e. conduct electricity and cause the dielectric loss ". In the case of blocking electrodes and or domain interface or even low-frequency conduction can easily lead to electrode polarization. Thus, it will not only cause dielectric loss " but also lead to a sharp increase of the apparent dielectric constant ' of glasses.
The frequency dependences of both dielectric constant ' and dielectric loss ", are represented in fig. 5(a and b) respectively at different temperatures. It can be observed from the figures that the dielectric constants increase rapidly with decreasing frequencies reaching high values. This high dispersion at lower frequencies, can be explained as follows7. When an electrical stimulus is applied, the flow of charge carriers agglomerates across the electrode-electrolyte interface creating space charge layers, leading to the high value of capacitance at the interfaces, which decreases with increase of frequency. This low frequency dispersion (LFD) behavior is related to the extended motion of charge carriers and may be associated with either volume or interfacial phenomena18. It may be possible to distinguish between the two mechanisms such as volume and interfacial processes. In general, if the real part ' and imaginary part " remain parallel over large frequency ranges, then LED can be associated to a volume process, otherwise it corresponds to interfacial process19. In the present case, variations of ' and " (shown in Fig.5(a) and (b)) are found to be deviating to a great extent with frequency, which corresponds to an interfacial process.
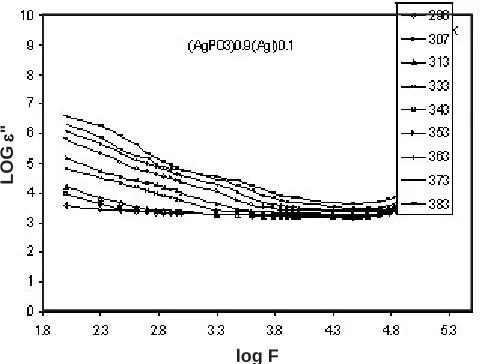
The temperature dependences of both dielectric constant ' and dielectric loss ", are represented in fig. 6(a and b) respectively at different temperatures. At low frequencies from 100 Hz to 10
Fig. 5(a): Frequency dependence of the dielectric constant ' for (AgPO3)0.9(AgI)0.1glasses different temperatures
LOG
"
log F
KHz both ' and " rise with increase in temperature. For frequencies higher than 10 KHz the increase in ' and " is very less pronounced compared to low frequencies. At low frequencies, with increase in temperature, the mobile ions are free to hop themselves parallel to the applied field, which leads to the rise in the permittivity. For higher frequencies, in the temperature interval, where our experiments
have been done, the charge carrier (i.e., Ag+ ions) are not sufficiently free to follow the changing electric field and therefore, the ' and " quantities remain nearly constant.
Fig. (7) shows the plot of logarithm of the dielectric constant (') versus mole% of AgI content in (AgPO3)1-x(AgI)x, (0×0.5) glassy system at
Fig. 5(b): Frequency dependence of the dielectric loss " for (AgPO3)0.9(AgI)0.1glasses at different temperatures
log F
Fig.6(a): Temperature dependence of the dielectric constant " for (AgPO3)0.9(AgI)0.1glasses at different frequencies
"
Fig.6(b): Temperature dependence of the dielectric loss ´´ for (AgPO3)0.9(AgI)0.1glasses at different frequencies
Fig. 7: dielectric constant vs. AgI composition at different frequencies different frequencies. The dielectric constant is found
to be increasing with increase in the AgI content which is due to the fact that the mobile ion concentration is also increasing, which leads to the increasing conductivity and hence the dielectric constant.
Electrochemical properties AgPO3 -AgI superionic glasses based
solid electrolyte
The solid electrolyte glass (AgPO3)0.6
(AgI)0.4 was pulverized into very small grain sizes The solid electrolyte powder was pressed under the desired pressure to obtain pellet of 12 mm diameter and 1 mm thickness . The blocking electrode material is Ag2S where was mixed with electrolyte glass powder in a weight ratio of 2 : 3²². It was pressed together with the solid electrolyte layer into a two-layered pellet . Silver paste, which showed ohmic contact with solid electrolyte layer, used to coating the surface of the solid electrolyte layer as a negative electrode .
(AgPO3)0.9(Agl)0.1
The charge-discharge processes of Ag/SE/ Ag2S battery using AgPO3-AgI superionic glasses based solid electrolyte is studied. In the present section we study the effect of load resistance on the cell voltage and discharge current at room temperature (30°C)23. Fig. 9 illustrates the charge current versus time for the solid electrolyte Ag/SE/ Ag2S battery , thickness (2.02 mm) and preparation pressure (37.8 MPa) at constant applied voltage 3V. It is noticed that, the charge current decays with increasing time to stationary value.
Fig. 10 illustrates the cell voltage against the electrical capacity for the solid electrolyte Ag/ SE/Ag2S battery at different load resistances. It is noticed that, as the load resistance increases the cell voltage shifts upward . This can be attributed to the load resistance control of the battery current drain. It is also noticed that, the value of electrical capacity in the case of 2M is higher than that in the case of 1 and/or 5M because at higher load resistance, 2 M, the discharge current spend long
Fig. 8: Charge current versus time for the solid electrolyte battery Ag/SE/Ag2S charged at constant voltage 3V
T h =2.02 m m V =3 v
R=10 M W
R=5 M W R=1 M W
Fig. 9: Cell voltage versus electrical capacity for the battery Ag/SE/Ag2S discharged at a different load resistances
cell volt
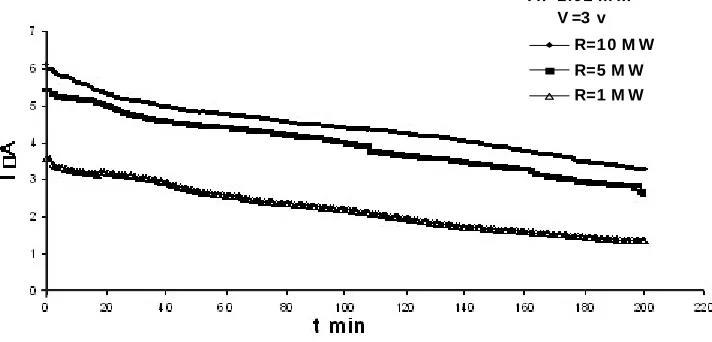
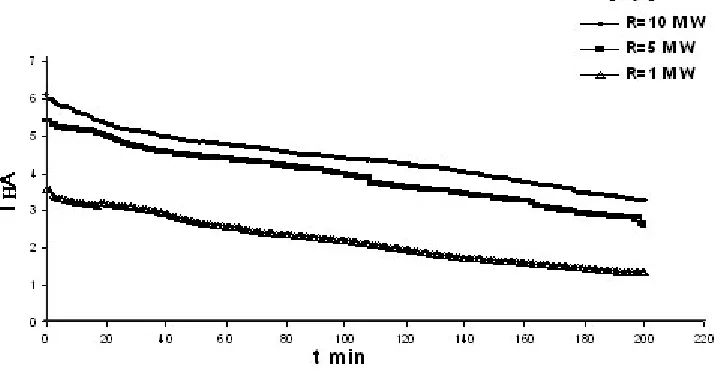
Fig. 10: Discharge current versus time for the solid electrolyte battery Ag/SE/Ag2S charged at constant voltage 3V
time at higher values in the whole range of discharge time.This means that the battery supplies smaller current for longer time. Fig. 11 illustrates the discharge current against time for the solid electrolyte Ag/SE/Ag2S battery at different load resistances. The general behaviour is the decrease of discharge current untill a stationary values. Conclusions
The bulk conductivity obtained by impedance method increases with increasing AgI content. For x=0.5 the conductivity grows linearly reaching a value of 0.6×10⁻² (-1cm-1) which is identified as a “fast-ionic” conductor. the relaxation process is thermally activated with activation energy 0.20-0.05 eV ver y close to that of the bulk conductivity, 0.17-0.04 eV, and it suggests that the transport of silver ions is a hopping mechanism.
It is noticed that the molar volume usually decreases slightly with increasing salt concentration.
The rise in ' observed at low frequency is mainly due to the interfacial polarization. The dielectric loss " is found to vary inversely with frequency due to the contribution of dc conductivity. The charge-discharge processes of Ag/SE/Ag2S battery using AgPO3 -AgI superionic glasses based solid electrolyte is studied. It is noticed that, the charge current decays with increasing time to stationary value. It is noticed that, the charge current decays with increasing time to stationary value. It is noticed that, as the load resistance increases the cell voltage shifts upward. The discharge current against time for the solid electrolyte Ag/SE/Ag2S battery at different load resistance decreases until stationary values.
REFERENCES
1. Warburg, G., Ann. Phys., 21: 622 (1884). 2. Garette, B., Maurin, M., Ribes, M., Duclot,
M., Solid St. Ion. 9/10: 655 (1983).
3. Malugani, J.P., Fahys, B., Mercier, R., Robert, G., Duchange, J.P., Baurdy, S., Brouselly, M.,
Gabano, J.P., Solid St. Ion. 9/10: 659 (1983). 4. Kennedy, J.H., Yang, Y., J. Solid State Chem.,
69: 252 (1987).
5. Kunze, D., in: W., Van Gool (ed.), Fast Ionic Transpor t in Solids, Nor th Holland, Amsterdam, (1973).
6. Martin, S.W., J. Am. Ceram. Soc. 74: 1767 (1991).
7. Malugani, J.P., Chiodelli, G., Schiraldi, A., Electrochim, Acta 24: 203 (1979).
8. Malugani, J.P., Mercier, R., Solid St. Ion. 13, (1984)293.
9. Hill, R.M., Jonscher, A.K., J. Non-Cryst. Solids 32: 53 (1979).
10. W.K. Lee, J.F. Liu, A.S. Nowick, Phys. Rev. Lett. 67: 1559 (1994).
11. Jeevanadam, P., Vasudevan, S., J. Chem. Phys. 109: 8102 (1999).
12. Takahashi, H., Rkitake, N., Sakuma, T. and Ishii, Y., Solid St. Ion. 175: 671 (2004). 13. Lefterova, E., Angelov, P., Dimitriev, Y. and
Stoynov, Z., ‘Reviews, Analytical Laboratory,
6(3) (1997).
14. Swenson, J. and Börjesson, L., Phys. Rev. Lett. 77: 3569 (1996).
15. Swenson, J. and Börjesson, Phys. Rev. Lett. 77: 3569 (1996).
16. Varshneya, A.K., Fundamentals of Inorganic Glasses, San Diego : Academic Press, Inc., (1994).
17. Selvasekarapandian, S., Chithra Devi, an R., Mater.Chem. Phys., 58: 90 (1999).
18. Almond, D.P., West, A.R., Solid St. Ion., 11: 57 (1983).
19. Sastry, M.C.R. and Rao, K.J., Solid St. Ion., 44: 187 (1991).